. 2019 Dec;4(12):2310-2318.
doi: 10.1038/s41564-019-0562-y. Epub 2019 Sep 30.

Identifying residual hotspots and mapping lower respiratory infection morbidity and mortality in African children from 2000 to 2017

Affiliations

Identifying residual hotspots and mapping lower respiratory infection morbidity and mortality in African children from 2000 to 2017

Robert C Reiner et al. Nat Microbiol. 2019 Dec.

Abstract

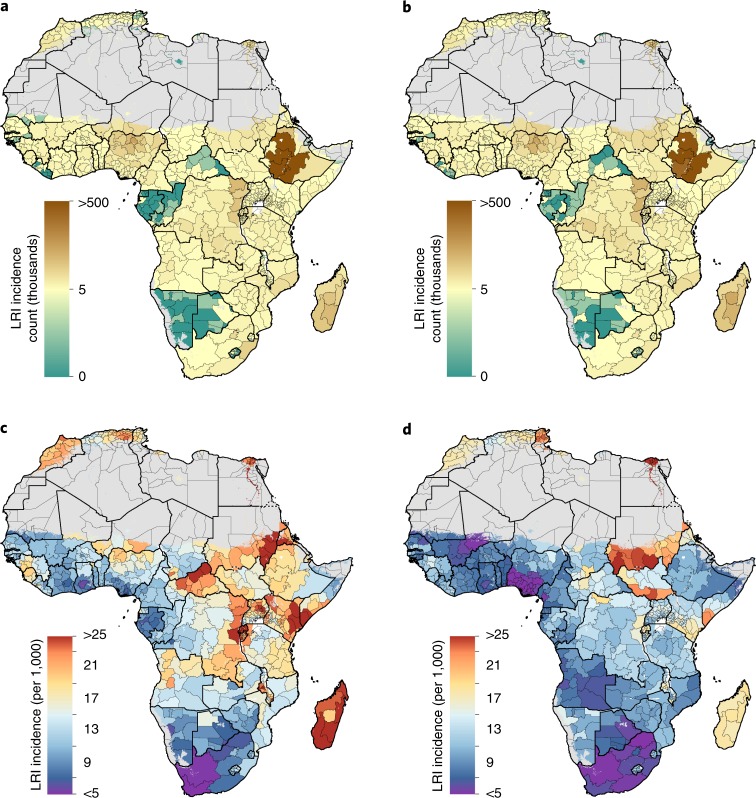
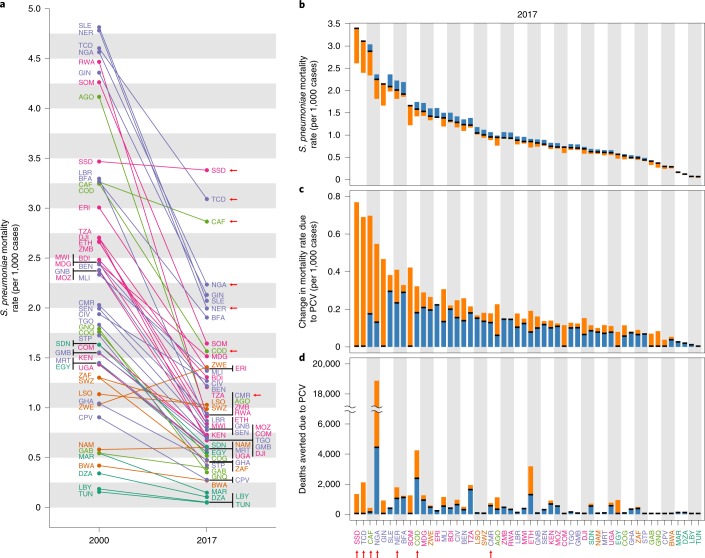
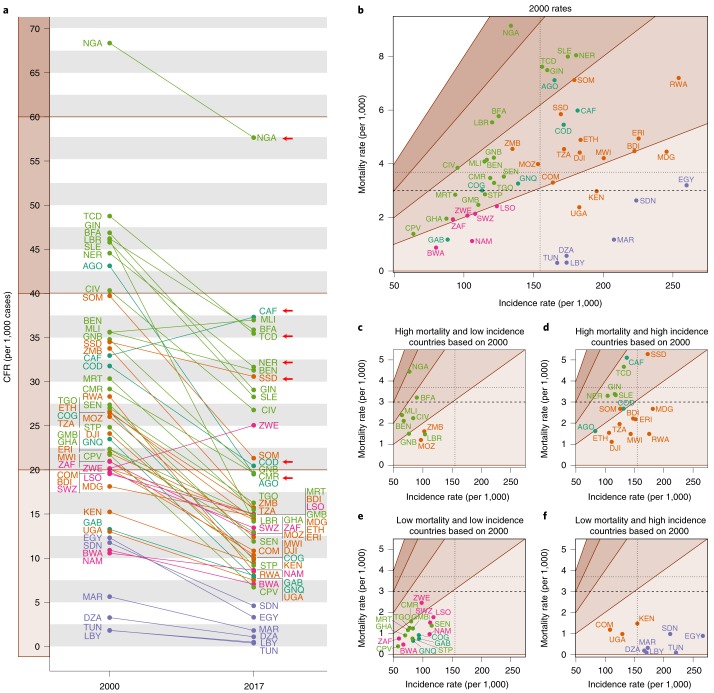
Lower respiratory infections (LRIs) are the leading cause of death in children under the age of 5, despite the existence of vaccines against many of their aetiologies. Furthermore, more than half of these deaths occur in Africa. Geospatial models can provide highly detailed estimates of trends subnationally, at the level where implementation of health policies has the greatest impact. We used Bayesian geostatistical modelling to estimate LRI incidence, prevalence and mortality in children under 5 subnationally in Africa for 2000-2017, using surveys covering 1.46 million children and 9,215,000 cases of LRI. Our model reveals large within-country variation in both health burden and its change over time. While reductions in childhood morbidity and mortality due to LRI were estimated for almost every country, we expose a cluster of residual high risk across seven countries, which averages 5.5 LRI deaths per 1,000 children per year. The preventable nature of the vast majority of LRI deaths mandates focused health system efforts in specific locations with the highest burden.


Conflict of interest statement

This study was funded by the Bill & Melinda Gates Foundation. Otherwise, the funders of the study had no role in the study design, data collection, data analysis, data interpretation, writing of the final report or decision to publish. The corresponding author had full access to all the data in the study and had final responsibility for the decision to submit for publication.

Figures

Fig. 1
Fig. 1. LRI incidence among children under 5 in 2000 and 2017.
a,b, Estimated mean number of LRI episodes aggregated to the first-level administrative subdivision for 2000 (a) and 2017 (b). c,d, Estimated LRI episodes rate per 1,000 children aggregated to the first-level administrative subdivision for 2000 (c) and 2017 (d). Areas with fewer than 10 people per 1 × 1 km2 or classified as ‘barren or sparsely vegetated’ are coloured in grey.
Fig. 2
Fig. 2. LRI mortality rate, number of deaths and clustering of risk among children under 5 in 2000 and 2017.
a,b, Estimated mean number of LRI deaths aggregated to the first-level administrative subdivision for 2000 (a) and 2017 (b). c,d, Estimated mean mortality rate per 1,000 children due to LRI aggregated to the first-level administrative subdivision for 2000 (c) and 2017 (d). e,f, z-scores as determined by the hotspot analysis for 2000 (e) and 2017 (f). Discontinuities in the colour scale at −3.8 and 3.8 correspond to locations identified as coldspots or hotspots, respectively (based on adjustments for multiple hypotheses tests). Areas with fewer than 10 people per 1 × 1 km2 or classified as ‘barren or sparsely vegetated’ are coloured in grey.
Fig. 3
Fig. 3. LRI mortality rate and number of deaths among children under 5 by first-level administrative subdivision, 2000 and 2017.
a, The 10 first-level administrative subdivisions with the highest mortality rates (per 1,000) associated with LRIs in 2000 and 2017. b, The 10 first-level administrative subdivisions with the highest number of childhood deaths associated with LRIs in 2000 and 2017. Regions not in the top 10 in both 2000 and 2017 are listed below the vertical ellipses with their associated year-specific rank. The lines connecting regions are solid if the rank increased from 2000 to 2017 and dashed if the rank decreased. Relative change in values is shown for 2017. SNNPR, Southern Nations, Nationalities, and Peoples’ Region.
Fig. 4
Fig. 4. LRI mortality rate attributable to S. pneumoniae among children under 5 in 2000 and 2017.
a, S. pneumoniae LRI mortality rate per 1,000 episodes for each country (indicated by the ISO3 abbreviations; www.iso.org/obp/ui) in 2000 and in 2017. b, The same mortality rate in 2017 in black, with the blue regions indicating gains made due to current PCV coverage and the orange regions indicating remaining reductions possible with perfect PCV coverage. Countries are plotted in order of the current mortality rate. c, The plot from b reoriented to illustrate the absolute difference in current mortality rate versus a baseline of no PCV deployment. The height of the orange bar indicates the remaining gain available in mortality rate given 100% PCV coverage. d, Same information as c but by total number of avertable deaths. Countries in purple are in western sub-Saharan Africa, countries in light green are in central sub-Saharan Africa, countries in orange are in southern sub-Saharan Africa, countries in pink are in eastern sub-Saharan Africa and countries in dark green are in North Africa. The arrows indicate countries located in the 2017 residual hotspot.
Fig. 5
Fig. 5. LRI CFR among children under 5 in 2000 and 2017.
a, LRI CFR per 1,000 cases in 2000 and 2017 for each country (indicated by the ISO3 abbreviations). bf, Plots by country and year of incidence rate per 1,000 versus mortality rate per 1,000 for 2000 (b) and 2017 (cf). The median incidence and mortality rate values are indicated by the dotted lines; the GAPPD goal of 3 deaths per 1,000 children attributable to LRI is indicated by the dashed lines. cf, Rates are in the context of how each country performed in 2000 and each panel corresponds to a quadrant of b. The ‘high’ and ‘low’ mortality or incidence is defined to be above or below the corresponding median value from 2000. bf, The shaded regions from light to dark tan indicate regions of mortality/incidence rate space corresponding to CFRs of 0–20, 20–40, 40–60 and 60–80. The countries in purple are in western sub-Saharan Africa, countries in light green are in central sub-Saharan Africa, countries in orange are in southern sub-Saharan Africa, countries in pink are in eastern sub-Saharan Africa and countries in dark green are in North Africa. The arrows indicate countries located in the 2017 residual hotspot.

References

    1. Roth GA, et al. Global, regional, and national age-sex-specific mortality for 282 causes of death in 195 countries and territories, 1980–2017: a systematic analysis for the Global Burden of Disease Study 2017. Lancet. 2018;392:1736–1788. doi: 10.1016/S0140-6736(18)32203-7. - DOI - PMC - PubMed
    1. Troeger C, et al. Estimates of the global, regional, and national morbidity, mortality, and aetiologies of lower respiratory infections in 195 countries, 1990–2016: a systematic analysis for the Global Burden of Disease Study 2016. Lancet Infect. Dis. 2018;18:1191–1210. doi: 10.1016/S1473-3099(18)30310-4. - DOI - PMC - PubMed
    1. Bhutta ZA, et al. Interventions to address deaths from childhood pneumonia and diarrhoea equitably: what works and at what cost? Lancet. 2013;381:1417–1429. doi: 10.1016/S0140-6736(13)60648-0. - DOI - PubMed
    1. Swingler G, Fransman D, Hussey G. Conjugate vaccines for preventing Haemophilus influenzae type B infections. Cochrane Database Syst. Rev. 2003;4:CD001729. - PubMed
    1. Lucero MG, et al. Pneumococcal conjugate vaccines for preventing vaccine‐type invasive pneumococcal disease and X‐ray defined pneumonia in children less than two years of age. Cochrane Database Syst. Rev. 2009;4:CD004977. - PMC - PubMed

Publication types