. 2019 Oct;51(10):1506-1517.
doi: 10.1038/s41588-019-0499-3. Epub 2019 Sep 30.

Allele-specific NKX2-5 binding underlies multiple genetic associations with human electrocardiographic traits

Affiliations

Allele-specific NKX2-5 binding underlies multiple genetic associations with human electrocardiographic traits

Paola Benaglio et al. Nat Genet. 2019 Oct.

Abstract

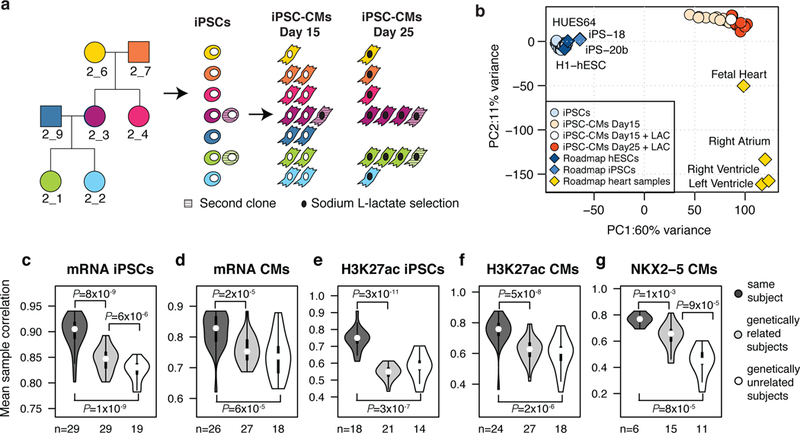
The cardiac transcription factor (TF) gene NKX2-5 has been associated with electrocardiographic (EKG) traits through genome-wide association studies (GWASs), but the extent to which differential binding of NKX2-5 at common regulatory variants contributes to these traits has not yet been studied. We analyzed transcriptomic and epigenomic data from induced pluripotent stem cell-derived cardiomyocytes from seven related individuals, and identified ~2,000 single-nucleotide variants associated with allele-specific effects (ASE-SNVs) on NKX2-5 binding. NKX2-5 ASE-SNVs were enriched for altered TF motifs, for heart-specific expression quantitative trait loci and for EKG GWAS signals. Using fine-mapping combined with epigenomic data from induced pluripotent stem cell-derived cardiomyocytes, we prioritized candidate causal variants for EKG traits, many of which were NKX2-5 ASE-SNVs. Experimentally characterizing two NKX2-5 ASE-SNVs (rs3807989 and rs590041) showed that they modulate the expression of target genes via differential protein binding in cardiac cells, indicating that they are functional variants underlying EKG GWAS signals. Our results show that differential NKX2-5 binding at numerous regulatory variants across the genome contributes to EKG phenotypes.


Figures

Figure 1 |
Figure 1 |. Generation and characterization of iPSCs and iPSC-CMs by gene expression and epigenetic profiling.
a, Pedigree showing the relationships of the seven individuals and summary of derived cell types analyzed. b, Principal component 1 and 2 of RNA-seq (15,725 genes) from iPSCs (29 samples from 7 individuals), iPSC-CMs (27 samples from 7 individuals), Roadmap stem cell lines (H1, HUES64, iPS-20b and iPS18), and human tissues (right ventricle, left ventricle, right atrium, and fetal heart). c-g, Distributions of the average Spearman correlation coefficients between pairs of samples across the 1,000 most variable genes (c,d) or peaks (e-g) for the indicated molecular phenotypes. Median (white dot), interquartile range (thick bar), and the rest of the distributions (line) are shown within each violin plot, with each sample size reported below. P-values of significant (P < 0.05) one-tailed Mann-Whitney tests are shown.
Figure 2 |
Figure 2 |. Identification of coordinated allele-specific effects (ASE) in gene expression, H3K27 acetylation, chromatin accessibility, and NKX2–5 binding in iPSCs and iPSC-CMs.
a, Total number of regions and heterozygous SNVs tested for ASE across all individuals and samples in each dataset. b, Total number of heterozygous SNVs and corresponding regions across all individuals and samples with ASE at FDR < 0.05. The number of ASE shared between iPSCs and iPSC-CMs is indicated by hatches. c, Scatterplot of the alternate allele proportion at shared ASE-SNVs between iPSCs and iPSC-CMs for RNA-seq (n = 516 SNVs) and H3K27ac (n = 43 SNVs). Spearman correlation statistics are indicated. d-f, Scatterplots of the mean proportion of the alternate allele of SNVs with ASE in heterozygous individuals and the effect size of each ASE-SNV, expressed as the slope of linear regression (ß) between gene expression or peak density and genotypes of all seven individuals. Spearman correlation statistics are indicated. The number of SNVs analyzed in d are: 970 for iPSCs and 799 for iPSC-CMs; in e: 255 for iPSCs and 550 for iPSC-CMs; in f: 1,714. g, Scatterplot showing relationship between effect sizes (ß’s) of ASE-SNVs in NKX2–5 peaks on both NKX2–5 and H3K27ac phenotypes (n = 854 SNPs). h, Table showing Spearman correlation coefficients of effect sizes between pairs of different molecular phenotypes. Correlations were calculated between ß’s of SNVs that showed ASE in ChIP-seq datasets (rows) and ß’s of the same variant for the closest gene or peak in a different molecular phenotype dataset (columns).
Figure 3 |
Figure 3 |. Transcription factor binding motifs are altered by SNVs with ASE in NKX2–5 ChIP-seq.
a, Odds ratios from two-sided Fisher’s exact test comparing the proportion of motif-altering SNVs between variants with ASE (n = 1,941) and variants without ASE (n = 19,371) in NKX2–5 ChIP-seq peaks from combined iPSC-CM samples. Asterisks indicate enrichment at FDR corrected P-value < 0.05. b, Number of TFBS motifs that were strengthened (red) or weakened (blue) by the preferred allele of ASE-SNVs identified in NKX2–5 ChIP-seq. c, Scatterplot of the reference allele proportion at ASE-SNVs (n = 341) and the difference of NKX2–5 motif score between reference and alternate alleles. Spearman correlation coefficient and P-value are indicated at the bottom. Dots are color-coded as in b. d, Summary table of Spearman correlation statistics calculated as in c for all motifs tested (see Supplementary Fig. 4 for the other scatterplots). e-h, Frequency of ASE-SNVs altering different positions within the motifs of NKX2–5 (e), GATA (f), MEIS1 (g), and TBX20 (h). NKX2–5, GATA and TBX20 PWMs were obtained using de-novo motif finding. Bars are color-coded as in b. Blue bars overlap the red ones (i.e. they are not stacked).
Figure 4 |
Figure 4 |. Enrichment of ChIP-seq ASE variants for known QTLs.
a-c, Histograms showing the percentage of SNVs with and without ASE in each ChIP-seq (from combined iPSC or iPSC-CM samples) and overlapping dsQTLs from LCLs (a), eQTLs from iPSCs (b), and combined eQTLs identified in different tissues (c). Two-sided Fisher’s exact test P-values are shown in red or blue for enrichment or depletion, respectively. d, Heatmap showing enrichment of ASE variants for tissue-specific eQTLs (similar tissues in GTEx were merged; see Methods). Asterisks indicate two-sided Fisher’s exact test FDR corrected P-value < 0.05. Heatmap is colored based on -log10 of FDR corrected P-values, with negative sign if odds ratio was < 1. The complete Fisher’s exact test statistics including P-values, odds ratios and number of SNVs analyzed are reported in Supplementary Table 5.
Figure 5 |
Figure 5 |. Enrichment of NKX2–5 SNVs at GWAS loci and validation of rs590041 as a regulatory variant in the SSBP3 locus for p-wave duration.
a-c, Volcano plots showing -log10 P-values and fold enrichment for GWAS loci in NKX2–5 (a), H3K27ac (b), and ATAC-seq (c) peaks from combined iPSC-CM samples. Red symbols indicate significant enrichment at FDR corrected P-value < 0.05, calculated using GREGOR. In total n = 125 GWAS traits were tested, of which 6 were for EKG traits. d, Percentage of NKX2–5 ASE-SNVs overlapping an EKG GWAS-SNP versus overlapping a non-GWAS-SNP. Two-sided Fisher’s exact test P-value and the number of SNVs are given. e, Top panel: regional plot of association P-values with P-wave duration, color coded based on r2 values. Second panel: regional plot of eQTLs for SSBP3 in atrial appendage samples from GTEx. NKX2–5 allelic imbalance (pie chart) for rs590041 is shown. Panels three through five: epigenetic tracks from iPSC-CM combined samples. Bottom panel: UCSC genome browser tracks for Roadmap fetal heart ChromHMM, DHS, and gene annotations. f, EMSA with nuclear extract from iPSC-CM using probes containing two allelic variants of rs590041. Similar results were obtained in two independent experiments. The full scans of the blots are shown in Supplementary Figure 9. g, Screenshot from the GTEx portal (https://gtexportal.org) showing association between rs590041 genotypes and expression levels of SSBP3 in heart atrial appendage samples. h, Luciferase assay in iPSC-CMs for rs590041, in both forward and reverse orientations. RLUs are normalized to cells transfected with the empty vector (pgl4.23). Lines indicate median, lower and upper quartiles of 6 transfection replicates per plasmid. P-values from two-tailed t-tests are shown, comparing expression from the two alleles. i, qPCR expression of SSBP3 in iPSC-CMs (id: iPSCORE_1_5) stably expressing dCas9-KRAB (CRISPRi) and either a control guide RNA (gCTL) or two guide RNAs targeting the region encompassing rs590041. Bars and error bars represent the mean and the standard deviation from three qPCR measurements, respectively; two-tailed t-test P-value is shown. Similar results were obtained in an independent cell line (Supplementary Fig. 10). All iPSC-CMs used in f, h, and i were lactate-purified.
Figure 6 |
Figure 6 |. Prioritization of candidate causal variants at heart rate loci using fgwas.
a, fgwas natural log fold enrichment of GWAS-SNPs for heart rate in iPSC-CM genomic annotations (y-axis). The bars indicate 95% confidence intervals. b, Table showing 11 SNPs with > 0.3 fgwas posterior probability of causality (PPA) and that overlapped at least two of the indicated iPSC-CM genomic annotations. SNPs that showed genome-wide significance (P < 10−8) for each trait in the corresponding studies are indicated, while those with P >10−8 are sub-threshold, and thus novel, GWAS loci. c, Functional annotation of rs6801957 associated with heart rate. Top panel: regional plot of association P-values; SNPs are color coded based on r2 values from the 1000 Genome Project CEU population; lead GWAS variants from other studies in the locus are indicated by a diamond. Second panel: fgwas PPA of the variants in the locus. Panels three through five: epigenetic tracks from iPSC-CM combined samples. Bottom panels: Roadmap fetal heart ChromHMM and genes from UCSC genome browser. Inner panel: allelic imbalance (pie chart) of NKX2–5 ASE with FRD-corrected P-values, and altered TF motif.
Figure 7 |
Figure 7 |. Functional characterization of rs3807989 as candidate causal variants for PR interval and atrial fibrillation.
a, fgwas natural log fold enrichment of GWAS-SNPs for atrial fibrillation (AF) and PR interval (PR) in iPSC-CM genomic annotations (y-axis). Bars indicate 95% confidence intervals. b, Tables showing the top 5 SNPs ordered by fgwas posterior probability of causality (PPA) and overlapping at least two of the indicated iPSC-CM genomic annotations. c, Top panel: regional plot of association P-values with PR interval, color coded based on r2 values. NKX2–5 allelic imbalance (pie chart) for rs3807989 is shown. Second panel: fgwas PPA of the variants in the locus. Panels three through five: epigenetic tracks from iPSC-CM combined samples. Bottom panel: UCSC genome browser tracks for Roadmap fetal heart ChromHMM, DHS, and gene annotations. d, Association between rs3807989 genotypes and gene expression of CAV1 and CAV2 genes in 128 iPSC-CMs from different individuals. Boxplot elements: median (thick line), lower and upper quartiles (box), maximum and minimum (whiskers). P-value of linear regression is shown. e, EMSA with iPSC-CMs nuclear extract using probes containing two allelic variants of rs3807989. A second blot from an independent experiment with similar results and full scans of the blots are shown in Supplementary Figure 9. f, Position of rs3807989 with respect to the NKX2–5 motif. g, Luciferase assays in iPSC-CMs for rs3807989, in both forward and reverse orientations. RLUs are normalized to cells transfected with the empty vector (pGL4.23). Plot lines indicate median, lower and upper quartiles of 6 transfection replicates per plasmid. P-values from two-tailed t-tests are shown. h, qPCR expression of CAV1 and CAV2 genes in iPSC-CMs stably expressing dCas9-KRAB (CRISPRi) (id: iPSCORE_1_5) and either a control guide RNA (gCTL) or two guide RNAs targeting the region encompassing rs3807989. Bars and error bars represent the mean and the standard deviation from three qPCR measurements, respectively; two-tailed t-test P-value is shown. The result was replicated in an independent cell line (Supplementary Fig. 10). All iPSC-CMs used in d-h were lactate-purified.

References

    1. MacArthur J et al. The new NHGRI-EBI Catalog of published genome-wide association studies (GWAS Catalog). Nucleic Acids Res. 45, D896–D901 (2017). - PMC - PubMed
    1. Gallagher MD & Chen-Plotkin AS The post-GWAS era: from association to function. Am. J. Hum. Genet. 102, 717–730 (2018). - PMC - PubMed
    1. van den Boogaard M et al. A common genetic variant within SCN10A modulates cardiac SCN5A expression. J. Clin. Invest. 124, 1844–1852 (2014). - PMC - PubMed
    1. Wang X et al. Discovery and validation of sub-threshold genome-wide association study loci using epigenomic signatures. Elife 5, e10557 (2016). - PMC - PubMed
    1. Deplancke B, Alpern D & Gardeux V The genetics of transcription factor DNA binding variation. Cell 166, 538–554 (2016). - PubMed

Methods-only references

    1. Ban H et al. Efficient generation of transgene-free human induced pluripotent stem cells (iPSCs) by temperature-sensitive Sendai virus vectors. Proc. Natl. Acad. Sci. USA 108, 14234–14239 (2011). - PMC - PubMed
    1. Lian X et al. Directed cardiomyocyte differentiation from human pluripotent stem cells by modulating Wnt/beta-catenin signaling under fully defined conditions. Nat. Protoc. 8, 162–75 (2013). - PMC - PubMed
    1. Tohyama S et al. Distinct metabolic flow enables large-scale purification of mouse and human pluripotent stem cell-derived cardiomyocytes. Cell Stem Cell 12, 127–137 (2013). - PubMed
    1. Auton A et al. A global reference for human genetic variation. Nature 526, 68–74 (2015). - PMC - PubMed
    1. Li H & Durbin R Fast and accurate short read alignment with Burrows-Wheeler transform. Bioinformatics 25, 1754–1760 (2009). - PMC - PubMed

Publication types

MeSH terms

Substances