. 2019 Oct;51(10):1494-1505.
doi: 10.1038/s41588-019-0505-9. Epub 2019 Sep 30.

Landscape of stimulation-responsive chromatin across diverse human immune cells

Affiliations

Landscape of stimulation-responsive chromatin across diverse human immune cells

Diego Calderon et al. Nat Genet. 2019 Oct.

Abstract

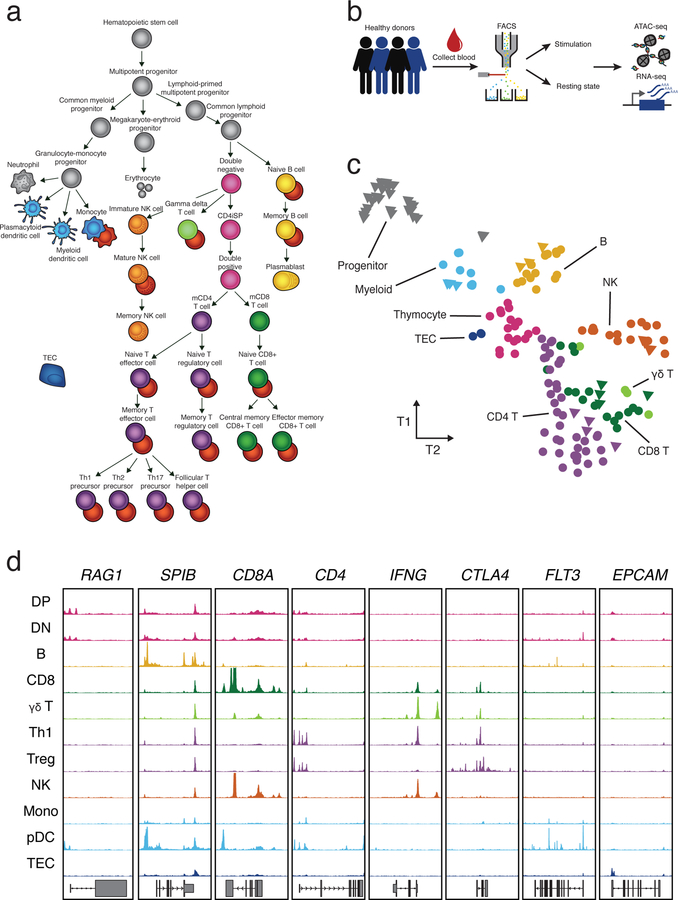
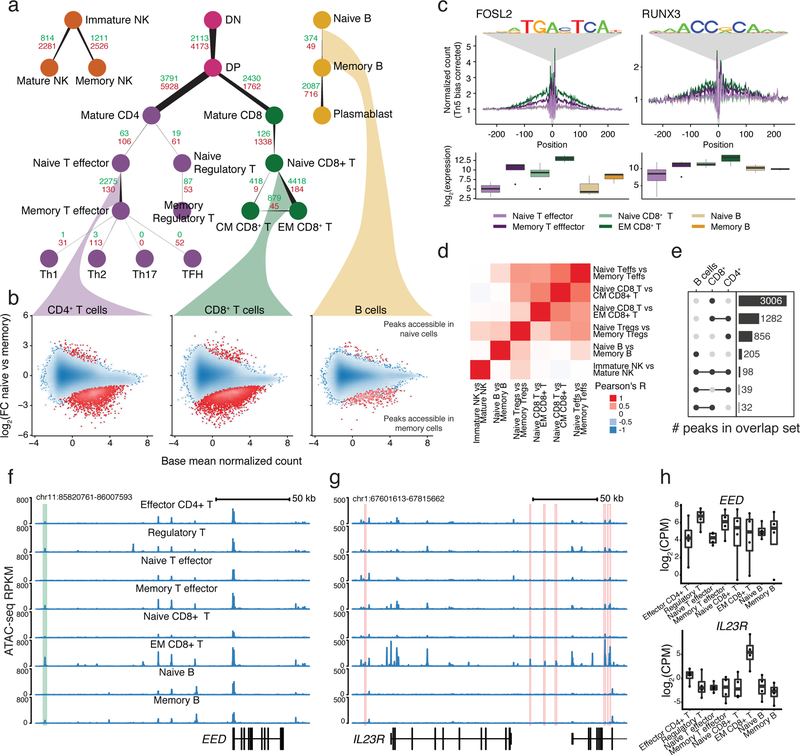
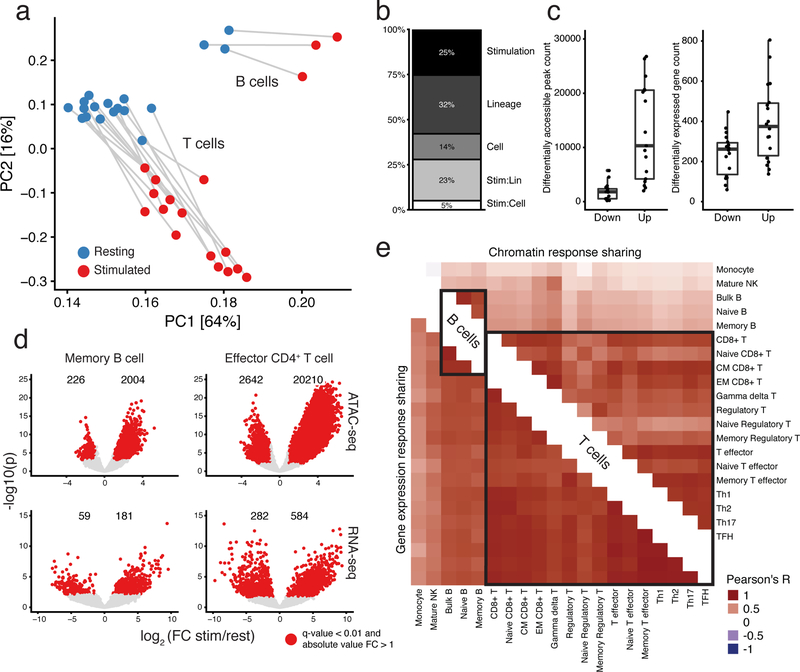
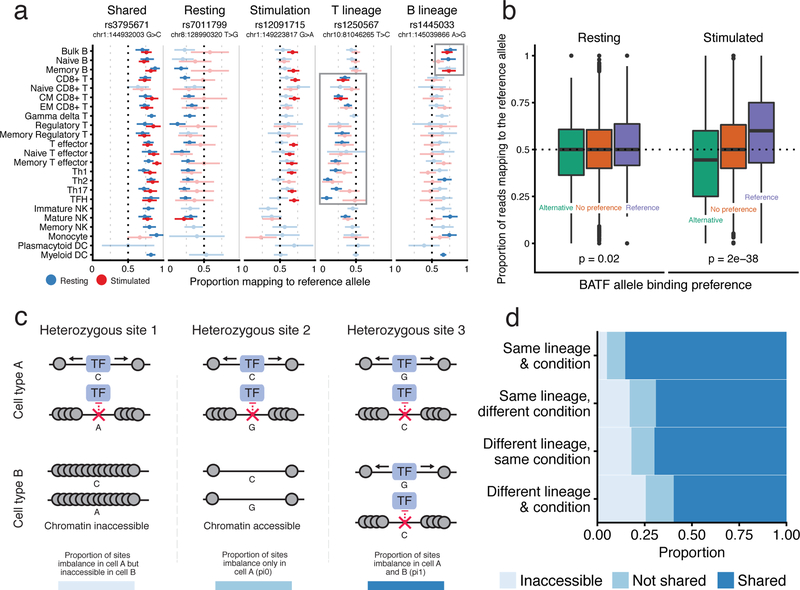
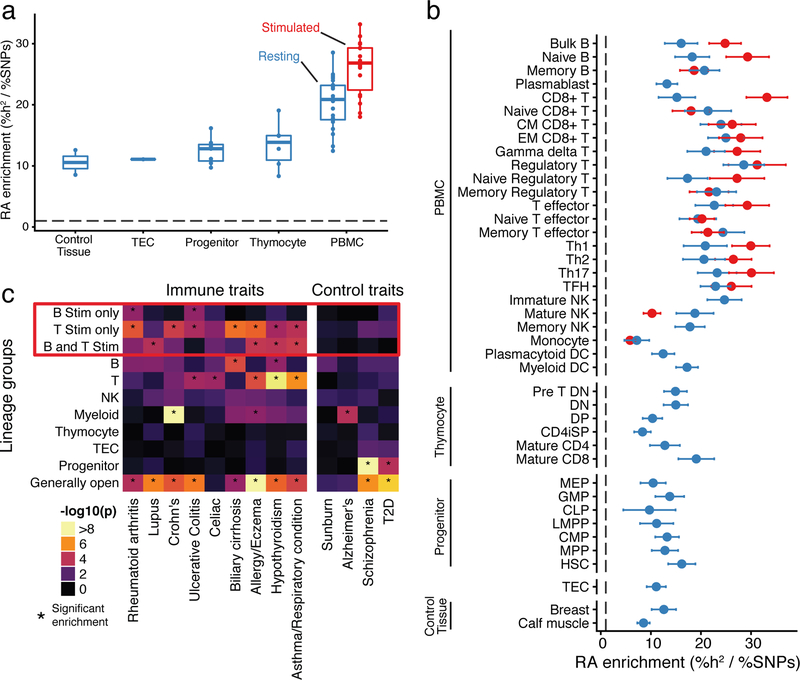
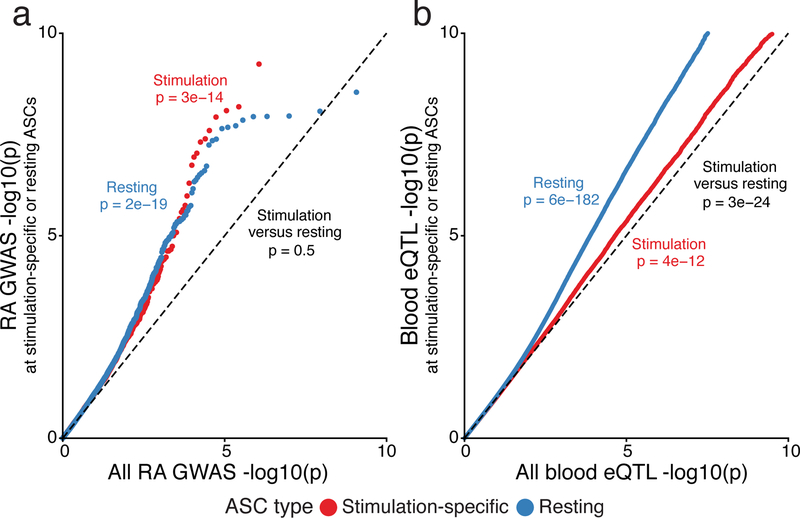
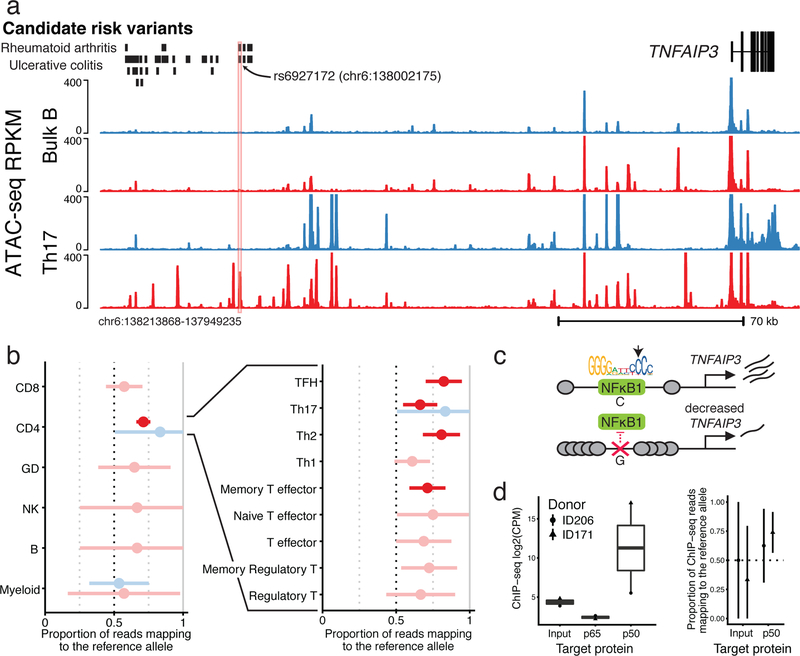
A hallmark of the immune system is the interplay among specialized cell types transitioning between resting and stimulated states. The gene regulatory landscape of this dynamic system has not been fully characterized in human cells. Here we collected assay for transposase-accessible chromatin using sequencing (ATAC-seq) and RNA sequencing data under resting and stimulated conditions for up to 32 immune cell populations. Stimulation caused widespread chromatin remodeling, including response elements shared between stimulated B and T cells. Furthermore, several autoimmune traits showed significant heritability in stimulation-responsive elements from distinct cell types, highlighting the importance of these cell states in autoimmunity. Allele-specific read mapping identified variants that alter chromatin accessibility in particular conditions, allowing us to observe evidence of function for a candidate causal variant that is undetected by existing large-scale studies in resting cells. Our results provide a resource of chromatin dynamics and highlight the need to characterize the effects of genetic variation in stimulated cells.


Figures

Fig. 1:
Fig. 1:. Study workflow and tSNE of ATAC-seq data.
a, Illustration of isolated cell types, which include cell types that were previously published (gray) and resting (colored) and stimulated (red) immune cells obtained from this study. b, Schematic of sample processing pipeline. Immune cells were sorted by flow cytometry from up to four healthy donors, activated and subjected to ATAC-seq and RNA-seq. c, Exploratory tSNE of ATAC-seq chromatin accessibility from all cell types in a resting state. Each sample is colored by broad cell lineage. Samples for each cell type from different donors are plotted separately (counts can be found in Supplementary Table 1). Triangles represent previously published data and circles represent data generated in this study. d, Representative ATAC-seq profiles (y-axis = 0 to 400 RPKM) at several cell type-specific genes (see Methods). Cell type abbreviations listed in Supplementary Table 1.
Fig. 2:
Fig. 2:. Identification of accessible regions associated with memory.
a, Number of differentially accessible regions when comparing cell subtypes to their progenitors. The count of regions that gain versus lose accessibility are labeled green and red, respectively. Edge starting and ending widths are proportional to the number of peaks losing and gaining accessibility. b, Example MA-plots comparing accessibility during the transition from naïve to memory states. Point density is shown as blue shading. The 0.1% of points in the least densely populated regions of the plot are shown as separate points. c, Transcription factor footprints showing genome-wide aggregate accessibility at PWM-predicted binding sites stratified by cell subset and with the distribution of normalized RNA expression of corresponding genes. d, Heatmap displaying Pearson’s R correlation between log2(FC) estimates of memory-associated chromatin changes between cell subsets. e, UpSet plot of the number of shared or unique regions that gain accessibility in memory formation in T cell and B cell lineages. f, ATAC-seq profile highlighting a region that increases in accessibility upon transition to memory that is shared among multiple cell types. g, ATAC-seq profile highlighting a region associated with effector memory CD8+ T cells that contains a GWAS variant linked with either Crohn’s disease, ankylosing spondylitis, or primary biliary cirrhosis. h, Boxplot (see Methods) of the gene expression of the genes highlighted in (f) and (g). All comparisons were performed on cells in a resting state and the number of samples used is listed in Supplementary Table 1.
Fig. 3:
Fig. 3:. Stimulation induces large-scale changes in chromatin and gene expression in B and T cells.
a, Principal component analysis (PCA) of ATAC-seq read counts of B and T cell subsets (excluding plasmablast cells), which were merged from multiple donors. Analysis based on the top 100k most variable peaks. b, Explained proportion of variation in chromatin accessibility of the samples in (a) with at least 3 biological replicates, explained by biological factors of interest (see Methods). The interaction effect for lineage is labeled Stim:Lin and the interaction effect for cell type is labeled Stim:Cell. c, Counts of significant differentially accessible chromatin regions (left) and expressed genes (right) identified for B and T cells during stimulation (see Methods). Naïve regulatory T cells were excluded due to a lack of power because we had too few biological samples passing QC. d, Volcano plots showing stimulation effects for ATAC-seq (top) and RNA-seq (bottom) for memory B (left) and effector CD4+ T (right) cells. e, Displayed is the Pearson’s R correlation between samples from stimulation-response chromatin (top-right triangle) and gene expression (bottom-left triangle) effects, at sites or genes with a significant stimulation response in at least one of the two cell types in the comparison. All estimates are from at least three biological replicates, except the Naïve Regulatory T cells, which had two. Counts of the number of samples included and overlapping significant stimulation-associated peaks between cell subsets can be found in Supplementary Table 1.
Fig. 4:
Fig. 4:. Observed allelic imbalance in chromatin accessibility data.
a, Examples of allele-specific chromatin accessibility imbalance shared across various groups. For each heterozygous site, we display the proportion of reads mapping to the reference allele (x-axis) for cell samples (y-axis). Error bars represent 95% confidence intervals computed from read depth. Samples without significant imbalance are lightly shaded. We excluded samples from the visualization with fewer than four reads at the specific variant. b, Heterozygous sites were grouped into three bins based on the PWM-predicted BATF binding affinity: preference for the alternative, no preference, preference for the reference allele. The y-axis represents the aggregate proportion of reads mapping to the reference allele for these groups in Th1 precursor cells under resting (left) and stimulated (right) conditions. Sites with fewer than four reads were excluded. c, Scenarios of allele-specific chromatin accessibility imbalance in two different cell types or conditions for the same donor. d, Proportion plot displaying the estimated average proportions for each case from (c), stratified by whether the two samples were of the same lineage and condition. Innate cells were excluded from this analysis. All plots are for Donor 1, who had the highest sequencing depth, although similar trends were found in the other donors (Supplementary Fig. 9b,c). Read counts for (a) and sample sizes for (b) and (d) can be found in Supplementary Table 1.
Fig. 5:
Fig. 5:. GWAS analysis of accessible regions.
a, Rheumatoid arthritis heritability enrichment is aggregated by differentiation and condition. Stimulated innate cells were excluded from this visualization. The dashed line represents a baseline proportion of disease heritability across all SNPs. b, Enrichment of rheumatoid arthritis (RA) heritability (x-axis) in open chromatin regions for resting (blue) and stimulated (red) samples (y-axis). Error bars indicate one standard deviation in each direction. The dashed line represents a baseline proportion of disease heritability across all SNPs. c, We grouped peaks into disjoint clusters based on their patterns of accessibility across cell types (x-axis). Then, we used partitioning heritability functionality of LDScore regression to estimate enrichments of trait signal (x-axis) in these peak clusters (y-axis). We highlighted groups of peaks related to stimulation with a red box, and asterisks (*) indicate significant enrichment of trait heritability (Bonferroni adjusted p < 0.05). Sample sizes for panels a, b and c can be found in Supplementary Table 1.
Fig. 6:
Fig. 6:. GWAS and expression quantitative trait loci (eQTL) enrichment in sites of allele-specific chromatin.
a, Comparison of rheumatoid arthritis GWAS enrichment within the set of SNPs that regulate chromatin accessibility, in either B or T cells, under stimulation (red) or resting (blue) conditions. b, Comparison of eQTL signal in the same two sets of variants from (a), using eQTL data from GTEx v7. For both plots the x-axis reflects an empirical distribution of p-values. Sample sizes can be found in Supplementary Table 1. We computed p-values with a two-sided Mann–Whitney U text.
Fig. 7:
Fig. 7:. Identifying rs6927172 as a stimulation-specific chromatin regulator in a complex autoimmune GWAS region.
a, Chromatin accessibility profile for stimulated (red) and resting (blue), bulk B (top) and Th17 (bottom) cells, around variant rs6927172. This region contains significant GWAS signals for ulcerative colitis and rheumatoid arthritis, but the causal variant(s) have not been determined (credible set indicated). We include a trackplot with all samples in Supplementary Fig. 12. b, Allele-specific ATAC-seq reads at rs6927172 in the three heterozygous donors (the fourth was not heterozygous at this site). Displayed is the proportion of reads mapping to the reference allele. Error bars represent 98% confidence intervals and were computed from read depth. Significant (p < 0.01) allelic imbalance associations are colored (see Methods). Exact read counts for these sites can be found in Supplementary Table 1. c, A proposed negative feedback model of gene regulation linking NFKB1 toTFNAIP3. We included the canonical PWM for the p50 subunit of NFKB1, as downloaded from the Jaspar TF motif database. The heterozygous allele disrupts the nucleotide indicated by the arrow. d, ChIP-seq read count for the input genomic DNA control, and p50 and p65 subunits of NFKB1 (left, n = 2, read counts found in Supplementary Table 1). Allelic-imbalance of ChIP-seq reads mapping to rs6927172 (right).

References

    1. Farh KK et al. Genetic and epigenetic fine mapping of causal autoimmune disease variants. Nature 518, 337–43 (2015). - PMC - PubMed
    1. Finucane HK et al. Partitioning heritability by functional annotation using genome-wide association summary statistics. Nat Genet 47, 1228–35 (2015). - PMC - PubMed
    1. Pickrell JK Joint analysis of functional genomic data and genome-wide association studies of 18 human traits. Am J Hum Genet 94, 559–73 (2014). - PMC - PubMed
    1. Hu X et al. Integrating autoimmune risk loci with gene-expression data identifies specific pathogenic immune cell subsets. Am J Hum Genet 89, 496–506 (2011). - PMC - PubMed
    1. Maurano MT et al. Systematic localization of common disease-associated variation in regulatory DNA. Science 337, 1190–5 (2012). - PMC - PubMed

Publication types

MeSH terms