

Quantifying how diagnostic test accuracy depends on threshold in a meta-analysis
- PMID: 31571244
- PMCID: PMC6856843
- DOI: 10.1002/sim.8301
Quantifying how diagnostic test accuracy depends on threshold in a meta-analysis
Erratum in
-
Correction: Quantifying how diagnostic test accuracy depends on threshold in a meta-analysis.Stat Med. 2021 Aug 15;40(18):4166. doi: 10.1002/sim.9103. Epub 2021 Jun 13. Stat Med. 2021. PMID: 34120359 Free PMC article. No abstract available.
Abstract
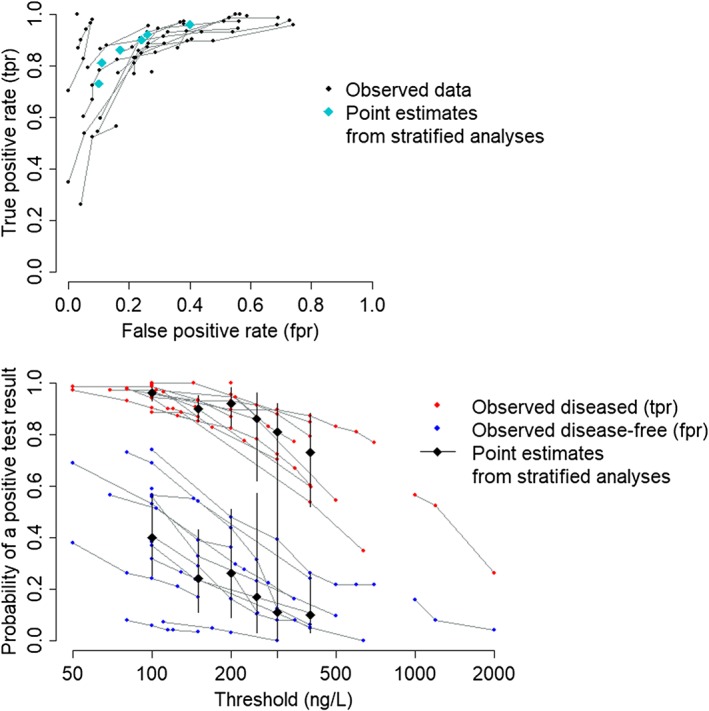
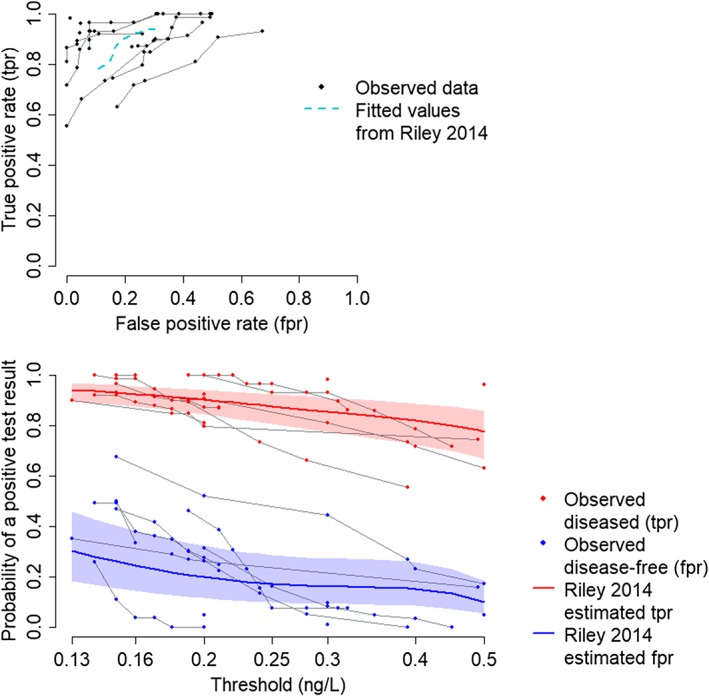
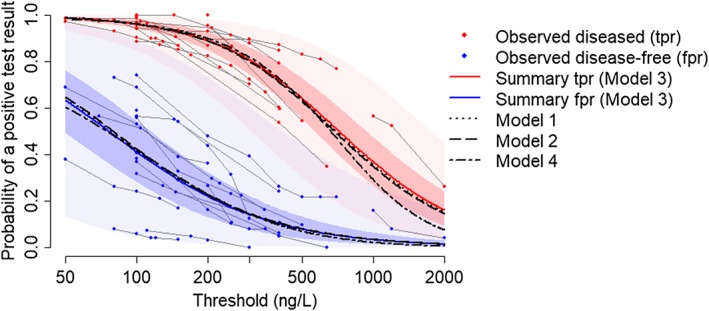
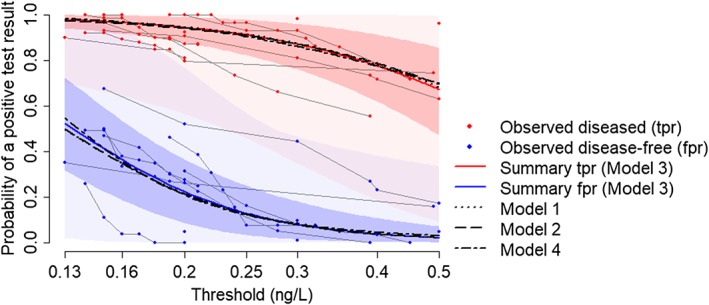
Tests for disease often produce a continuous measure, such as the concentration of some biomarker in a blood sample. In clinical practice, a threshold C is selected such that results, say, greater than C are declared positive and those less than C negative. Measures of test accuracy such as sensitivity and specificity depend crucially on C, and the optimal value of this threshold is usually a key question for clinical practice. Standard methods for meta-analysis of test accuracy (i) do not provide summary estimates of accuracy at each threshold, precluding selection of the optimal threshold, and furthermore, (ii) do not make use of all available data. We describe a multinomial meta-analysis model that can take any number of pairs of sensitivity and specificity from each study and explicitly quantifies how accuracy depends on C. Our model assumes that some prespecified or Box-Cox transformation of test results in the diseased and disease-free populations has a logistic distribution. The Box-Cox transformation parameter can be estimated from the data, allowing for a flexible range of underlying distributions. We parameterise in terms of the means and scale parameters of the two logistic distributions. In addition to credible intervals for the pooled sensitivity and specificity across all thresholds, we produce prediction intervals, allowing for between-study heterogeneity in all parameters. We demonstrate the model using two case study meta-analyses, examining the accuracy of tests for acute heart failure and preeclampsia. We show how the model can be extended to explore reasons for heterogeneity using study-level covariates.
Keywords: Box-Cox transformation; ROC curve; evidence synthesis; sensitivity; specificity; test cutoff.
© 2019 The Authors. Statistics in Medicine Published by John Wiley & Sons Ltd.
Figures

References
-
- Reitsma JB, Glas AS, Rutjes AWS, Scholten RJPM, Bossuyt PM, Zwinderman AH. Bivariate analysis of sensitivity and specificity produces informative summary measures in diagnostic reviews. J Clin Epidemiol. 2005;58(10):982‐990. - PubMed
-
- Chu HT, Cole SR. Bivariate meta‐analysis of sensitivity and specificity with sparse data: a generalized linear mixed model approach. J Clin Epidemiol. 2006;59(12):1331‐1332. - PubMed
-
- Rutter CM, Gatsonis CA. A hierarchical regression approach to meta‐analysis of diagnostic test accuracy evaluations. Statist Med. 2001;20(19):2865‐2884. - PubMed
-
- Macaskill P, Gatsonis C, Deeks J, Harbord R, Takwoingi Y. Chapter 10: analysing and presenting results In: Deeks JJ, Bossuyt PM, Gatsonis C, eds. Cochrane Handbook for Systematic Reviews of Diagnostic Test Accuracy. London, UK: The Cochrane Collaboration; 2010:1‐59.
Publication types
MeSH terms
Substances
Grants and funding
LinkOut - more resources
Full Text Sources
Medical