. 2020 Jan;59(1):5-14.
doi: 10.1002/mc.23123. Epub 2019 Sep 30.

The role of polo-like kinase 3 in the response of BRAF-mutant cells to targeted anticancer therapies

Affiliations

The role of polo-like kinase 3 in the response of BRAF-mutant cells to targeted anticancer therapies

Mahamat Babagana et al. Mol Carcinog. 2020 Jan.

Abstract

The activation of oncogenic mitogen-activated protein kinase cascade via mutations in BRAF is often observed in human melanomas. Targeted inhibitors of BRAF (BRAFi), alone or as a part of a combination therapy, offer a significant benefit to such patients. Unfortunately, some cases are initially nonresponsive to these drugs, while others become refractory in the course of treatment, underscoring the need to understand and mitigate the underlying resistance mechanisms. We report that interference with polo-like kinase 3 (PLK3) reduces the tolerance of BRAF-mutant melanoma cells to BRAFi, while increased PLK3 expression has the opposite effect. Accordingly, PLK3 expression correlates with tolerance to BRAFi in a panel of BRAF-mutant cell lines and is elevated in a subset of recurring BRAFi-resistant melanomas. In PLK3-expressing cells, R406, a kinase inhibitor whose targets include PLK3, recapitulates the sensitizing effects of genetic PLK3 inhibitors. The findings support a role for PLK3 as a predictor of BRAFi efficacy and suggest suppression of PLK3 as a way to improve the efficacy of targeted therapy.

Keywords: BRAF; PLK3; R406; cobimetinib; vemurafenib.


Figures

Figure 1.
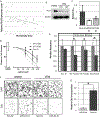
Figure 1.. PLK3 Knockdown Increases the Efficacy of BRAFi in BRAF Mutated Melanoma.
A) PLK3 expression vs PLX4720 activity area (“effectiveness”) was plotted for 37 melanoma cell lines. Expression data was obtained from the Cancer Cell Line Encyclopedia (CCLE) using the Integrative Genomic Viewer. A pharmacological profiling dataset deposited in the CCLE was used to obtain PLX4720 effectiveness. B) A375 cells were treated with vemurafenib (40nM) for 24 and 48 hours and analyzed via immunoblotting with anti-PLK3 and -GAPDH antibodies. C) SK-MEL-28 cells were transduced with a lentiviral vector expressing shRNA#1 or #2 against PLK3 or a non-silencing control “Non-Sil” as described previously . Cells were treated with the indicated doses of vemurafenib for 5 days. Remaining cell numbers were scored by methylene blue staining and extraction method, as described before. IC50 values were calculated using GraphPad Prism software and plotted relative to the vector control. The error bars represent the upper and lower 95% confidence intervals. D) Dose-response curves for the experiment described in panel C. The error bars represent the standard deviation of quadruplicates. E) SK-MEL-28 were transduced with tetracycline-inducible shPLK3 expression constructs (TRE-shPLK3 #1-#3) or a non-silencing control. The cells were cultured with (induced) or without (uninduced) 100ng/ml of doxycycline for 48 hours prior to a 5 day vemurafenib (40nM) or DMSO treatment. The remaining cells were scored by methylene blue staining and extraction method, and the data were normalized to corresponding uninduced controls. Error bars show standard deviations of quadruplicates. F) A375 harboring shPLK3#1 or a non-silencing shRNA were treated with vemurafenib (40nM) for 48 hours and pulsed with EdU (10uM) for 1 hour. The cells were fixed and stained using DAPI and the Click-it Alexa Fluor 488 imaging kit. EdU and DAPI images were converted to binary in ImageJ software. A representative field of view is shown. G) For each culture treated as in F, the fraction of EdU-positive cells was scored in 5 random fields of view. The values for vemurafenib-treated cells are shown relatively to the respective DMSO treated controls. The error bars represent the standard deviation of the 5 fields. “*” indicates a significant difference (p<0.05) between indicated values.
Figure 2.
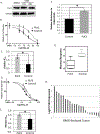
Figure 2.. PLK3 Overexpression Conveys Resistance to Inhibitors of BRAF and MEK.
A) A375 cells expressing wild type PLK3 (“PLK3”) or an empty vector control (“control”) were treated with DMSO or vemurafenib (24 or 48 hours) and analyzed via immunoblotting. The lysates were probed for PLK3 or tubulin. B) SK-MEL-28 cells harboring a PLK3-expression construct (“PLK3”) or the corresponding empty vector control (“control”) were treated with the indicated doses of vemurafenib for 5 days and analyzed as in Fig. 1C. C) IC50 values for cells described in panel B were calculated using GraphPad Prism software and plotted relative to the vector control. The error bars represent the upper and lower 95% confidence intervals. D-E) A375 cells were engineered, treated and analyzed as described for SK-MEL-28 in panels B and C. F) SK-MEL-28 described in panel B were treated with cobimetinib (10nM) or DMSO for 5 days. The remaining cells were scored as in Fig. 1C. Values are plotted relative to those of the vector control populations. G) A375#15 cells harboring either the PLK3-expression construct (“PLK3”) or the corresponding empty vector control (“Control”) were subcutaneously injected into SCID mice. When the tumors reached approximately 100mm3, the mice started receiving daily IP injections of vemurafenib (15mg/ml). The maximal fraction, by which a treated tumor decreased in size relatively to its volume at the start of the treatment, was determined and plotted as a “box and whiskers” graph for each group. H) The Log Fold Change (LogFC) for PLK3 expression in BRAF inhibitor (BRAFi) resistant patient tumors was assessed by comparing PLK3 levels each patient’s tumor before BRAF inhibitor treatment to those in the recurring tumors. The values for individual patients are plotted in a descending order. “*” indicates a significant difference (p<0.05) between indicated values.
Figure 3.
Figure 3.. PLK3 Differentially Affects ERK and MEK Status.
A) SK-MEL-28 cells transduced with PLK3 shRNA#1 (“shPLK3”) or a non-silencing control shRNA (“ns”) were treated with 40nM of vemurafenib (“VEM”) or vehicle alone (“DMSO”) for 48 hours and lysed. Protein extracts were probed via immunoblotting with antibodies for pERKY204, ERK1/2, pMEK1/2S217/221, MEK1/2, and tubulin. B) A375-shPLK3 #1 (“shPLK3”) or -non-silencing control (“ns”) cells were treated as in panel A and probed for pERK Y204, pMEK1/2S217/221, and tubulin. C) A375 harboring tetracycline-regulated shPLK3 #1 (“TRE-shPLK3”) or a non-silencing control (“Control”) were cultured with doxycycline (100ng/ml) for 48 hours prior to vemurafenib (40nM) or DMSO treatment. Drug treatments were continued for 48 hours in the presence of doxycycline. Lysates were probed for pERK Y204, pMEK1/2S217/221, and GAPDH. D) A375 cells transduced with PLK3 (“PLK3”) or the control vector (“control”) were treated with vemurafenib (60nM) for 48 and 24 hours and analyzed via immunoblotting as in panel C. E) In three experiments performed as in panel A, the intensity of pMEK and pERK signals (normalized to that of the loading control) was quantified using ImageJ software. To estimate the remaining fraction of pMEK and pERK in each experiment, the values in treated cells were divided for those in the untreated ones. The ratios of the remaining pERK and pMEK fractions were calculated for each cell line and are shown as averages of three experiments with standard deviations represented by the error bars. F) The ratios of the remaining pERK and pMEK fractions from three experiments performed as in panel C were analyzed and graphed as described for panel E. “*” indicates a significant difference (p<0.05) between indicated values.
Figure 4.
Figure 4.. R406 Synergizes with Vemurafenib in Cancer Cells.
A) A375 cells were treated with 20nM of vemurafenib, 500nM of R406, or a combination of both for 5 days and analyzed as in Fig. 1C. B) B-CPAP cells were treated with vemurafenib (100nM), R406 (250nM), or a combination of both drugs for 5 days and analyzed as in Fig. 1C. C) A375#15 cells transduced with a PLK3 expression construct (“PLK3”) or the corresponding empty vector control (“Vector”) were treated with vemurafenib (40nM), R406 (50nM), or both for 5 days. Cells were analyzed as described in Fig. 1C. D) A375 cells were treated with 40nM of vemurafenib, 50nM of R406, or both for 48 hours. Subsequently, the cells were probed via immunoblotting for pERKY204 and pMEKS217/221. The signals were normalized to the loading control (tubulin) and graphed relatively to those in respected untreated samples. “*” indicates a significant difference (p<0.05) between indicated values.

Similar articles

Cited by

References

    1. Chapman PB, Hauschild A, Robert C, et al. Improved survival with vemurafenib in melanoma with BRAF V600E mutation. The New England journal of medicine. 2011;364(26):2507–2516. - PMC - PubMed
    1. Hauschild A, Grob JJ, Demidov LV, et al. Dabrafenib in BRAF-mutated metastatic melanoma: a multicentre, open-label, phase 3 randomised controlled trial. Lancet. 2012;380(9839):358–365. - PubMed
    1. Ascierto PA, Minor D, Ribas A, et al. Phase II trial (BREAK-2) of the BRAF inhibitor dabrafenib (GSK2118436) in patients with metastatic melanoma. J Clin Oncol. 2013;31(26):3205–3211. - PubMed
    1. Long GV, Stroyakovskiy D, Gogas H, et al. Combined BRAF and MEK inhibition versus BRAF inhibition alone in melanoma. The New England journal of medicine. 2014;371(20):1877–1888. - PubMed
    1. Hyman DM, Puzanov I, Subbiah V, et al. Vemurafenib in Multiple Nonmelanoma Cancers with BRAF V600 Mutations. The New England journal of medicine. 2015;373(8):726–736. - PMC - PubMed

Publication types

MeSH terms