

Intersubject Variability and Normalization Strategies for Spinal Cord Total Cross-Sectional and Gray Matter Areas
- PMID: 31571307
- PMCID: PMC7153493
- DOI: 10.1111/jon.12666
Intersubject Variability and Normalization Strategies for Spinal Cord Total Cross-Sectional and Gray Matter Areas
Abstract
Background and purpose: The quantification of spinal cord (SC) atrophy by MRI has assumed an important role in assessment of neuroinflammatory/neurodegenerative diseases and traumatic SC injury. Recent technical advances make possible the quantification of gray matter (GM) and white matter tissues in clinical settings. However, the goal of a reliable diagnostic, prognostic or predictive marker is still elusive, in part due to large intersubject variability of SC areas. Here, we investigated the sources of this variability and explored effective strategies to reduce it.
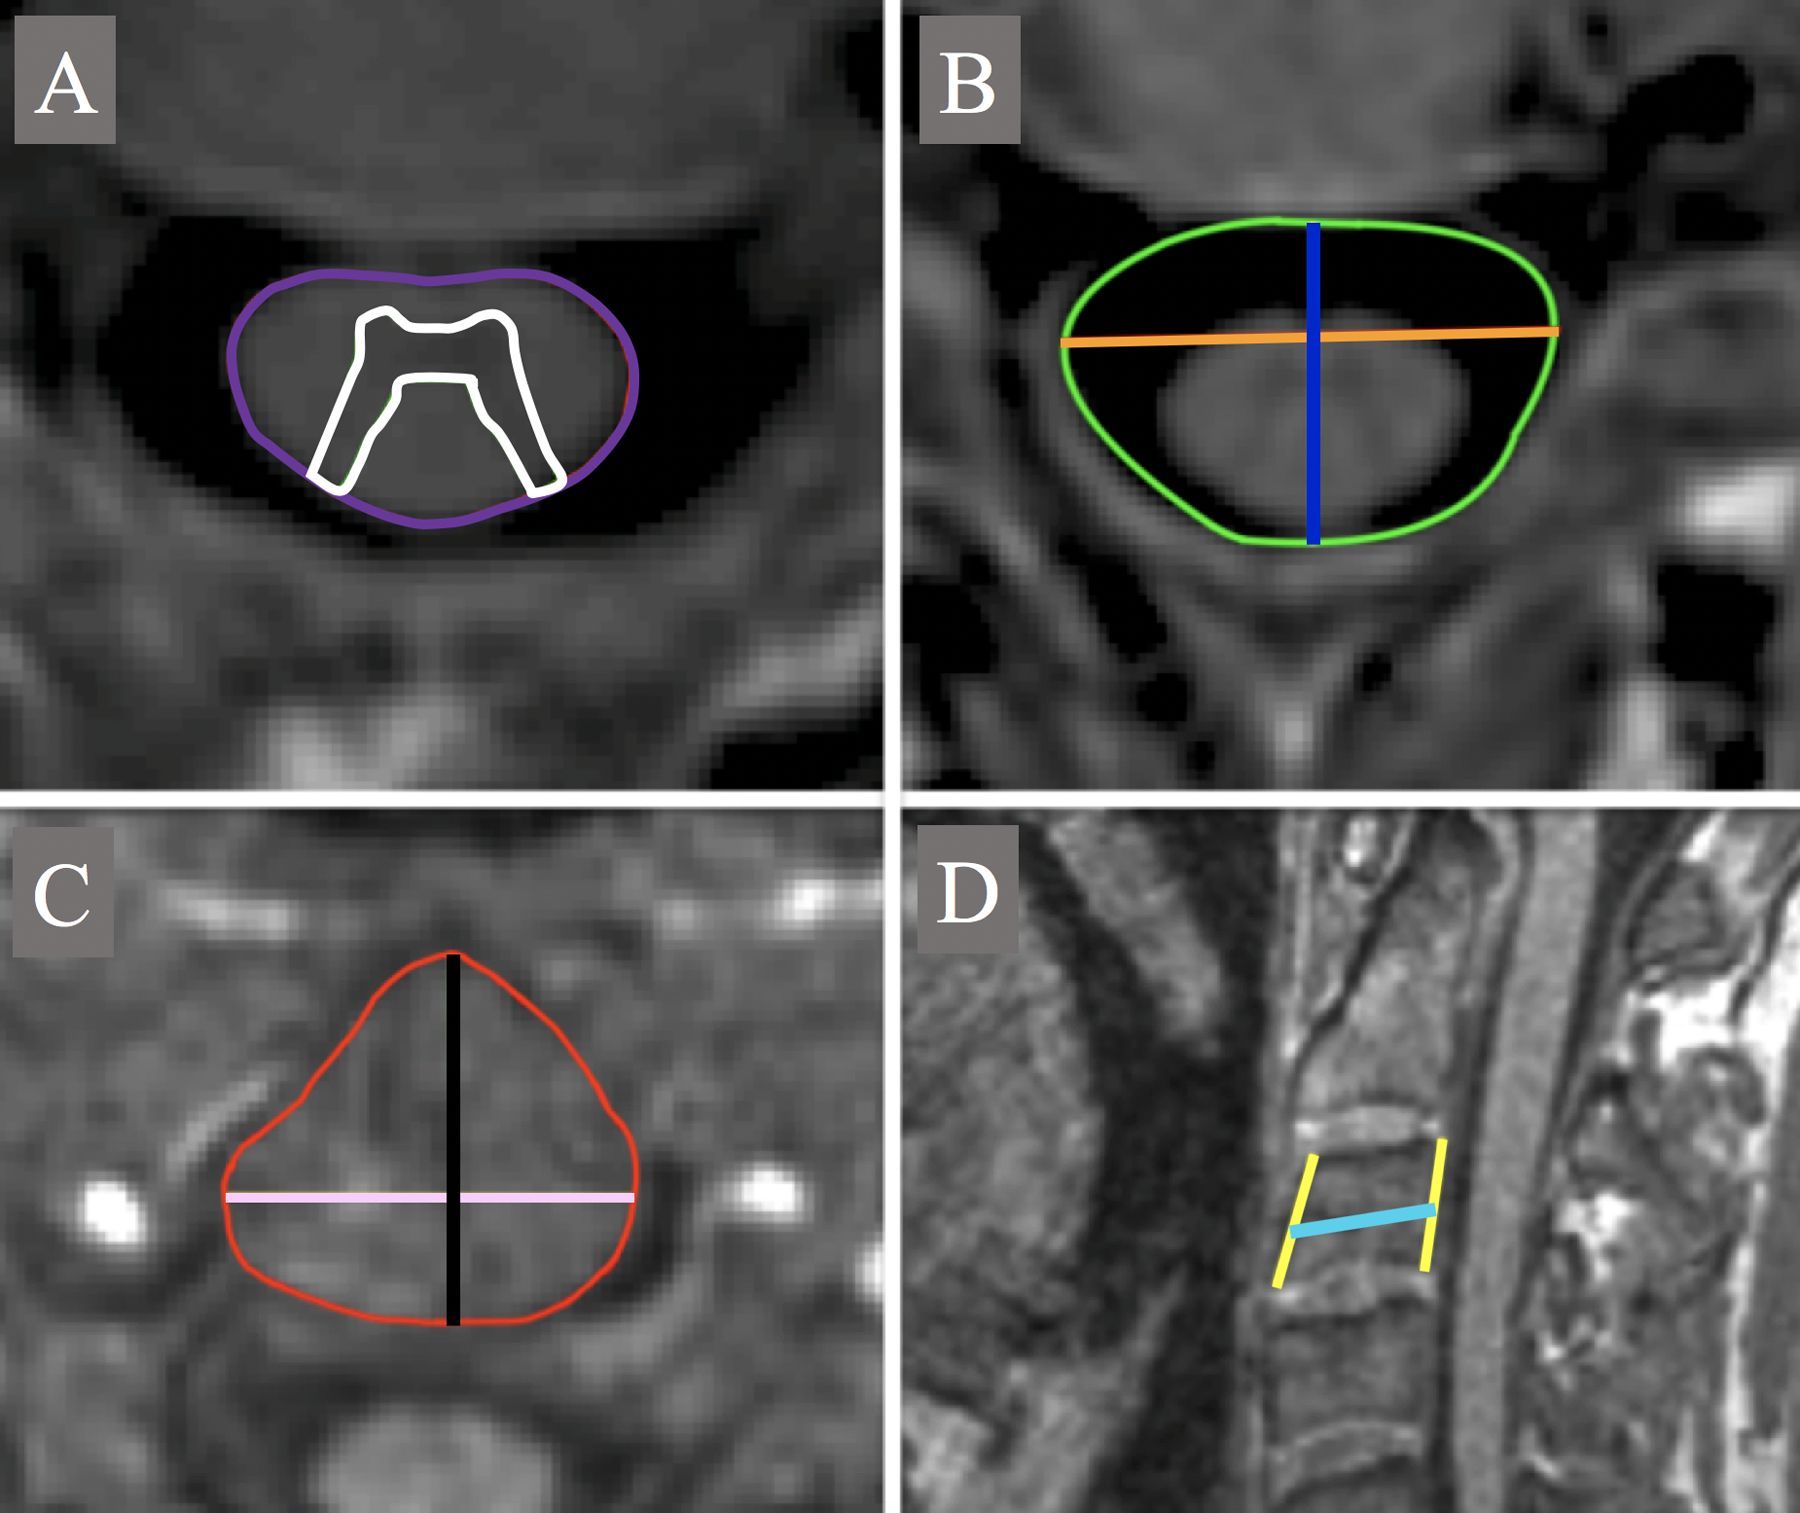
Methods: One hundred twenty-nine healthy subjects (mean age: 41.0 ± 15.9) underwent MRI on a Siemens 3T Skyra scanner. Two-dimensional PSIR at the C2-C3 vertebral level and a sagittal 1 mm3 3D T1-weighted brain acquisition extended to the upper cervical cord were acquired. Total cross-sectional area and GM area were measured at C2-C3, as well as measures of the vertebra, spinal canal and the skull. Correlations between the different metrics were explored using Pearson product-moment coefficients. The most promising metrics were used to normalize cord areas using multiple regression analyses.
Results: The most effective normalization metrics were the V-scale (from SienaX) and the product of the C2-C3 spinal canal diameters. Normalization methods based on these metrics reduced the intersubject variability of cord areas of up to 17.74%. The measured cord areas had a statistically significant sex difference, while the effect of age was moderate.
Conclusions: The present work explored in a large cohort of healthy subjects the source of intersubject variability of SC areas and proposes effective normalization methods for its reduction.
Keywords: Intersubject variability; magnetic resonance imaging; morphometry; normalization strategies; spinal cord.
© 2019 by the American Society of Neuroimaging.
Conflict of interest statement
The other authors have no competing interest related to the study.
Figures


References
-
- Bakshi R, Dandamudi VS, Neema M, De C, Bermel RA. Measurement of brain and spinal cord atrophy by magnetic resonance imaging as a tool to monitor multiple sclerosis. J Neuroimaging 2005;15:30s–45s. - PubMed
-
- Furby J, Hayton T, Anderson V, et al. Magnetic resonance imaging measures of brain and spinal cord atrophy correlate with clinical impairment in secondary progressive multiple sclerosis. Mult Scler 2008;14:1068–75. - PubMed
-
- Kearney H, Miszkiel KA, Yiannakas MC, Ciccarelli O, Miller DH. A pilot MRI study of white and grey matter involvement by multiple sclerosis spinal cord lesions. Mult Scler Relat Disord 2013;2:103–8. - PubMed
-
- Kearney H, Schneider T, Yiannakas MC, et al. Spinal cord grey matter abnormalities are associated with secondary progression and physical disability in multiple sclerosis. J Neurol Neurosurg Psychiatry 2015;86:608–14. - PubMed
Publication types
MeSH terms
Grants and funding
LinkOut - more resources
Full Text Sources
Miscellaneous
