. 2020 Mar;26(3):355-366.
doi: 10.1111/cns.13223. Epub 2019 Sep 30.

Histamine-induced plasticity and gene expression in corticostriatal pathway under hyperammonemia

Affiliations

Histamine-induced plasticity and gene expression in corticostriatal pathway under hyperammonemia

Olga A Sergeeva et al. CNS Neurosci Ther. 2020 Mar.

Abstract

Aims: Histamine H3 receptor (H3R) antagonists/inverse agonists increase vigilance. We studied brain histaminergic pathways under hyperammonemia and the transcriptome of receptors and their signaling cascades to provide a rationale for wake-promoting therapies.

Methods: We analyzed histamine-induced long-lasting depression of corticostriatal synaptic transmission (LLDhist). As the expression of dopamine 1 receptors (D1R) is upregulated in LGS-KO striatum where D1R-H3R dimers may exist, we investigated actions of H3R and D1R agonists and antagonists. We analyzed transcription of selected genes in cortex and dorsal striatum in a mouse model of inborn hyperammonemia (liver-specific glutamine synthetase knockout: LGS-KO) and compared it with human hepatic encephalopathy.

Results: LGS-KO mice showed significant reduction of the direct depression (DD) but not the long-lasting depression (LLD) by histamine. Neither pharmacological activation nor inhibition of D1R significantly affected DDhist and LLDhist in WT striatum, while in LGS-KO mice D1R activation suppressed LLDhist. Histaminergic signaling was found unchanged at the transcriptional level except for the H2R. A study of cAMP-regulated genes indicated a significant reduction in the molecular signature of wakefulness in the diseased cortex.

Conclusions: Our findings provide a rationale for the development of aminergic wake-promoting therapeutics in hyperammonemic disorders.

Keywords: histamine; hyperammonemia; striatum; synaptic plasticity.


Conflict of interest statement

The authors declare that they have no conflict of interest. All applicable international, national, and institutional guidelines for the care and use of animals were followed.

Figures

Figure 1
Figure 1
H3R pharmacology in histaminergic neurons of ventrolateral tuberomamillary nucleus of Tmt‐HDC mice, which express only H3R among 4 known histamine receptors. A, The H3R antagonist clobenpropit (clob) 20 µM abolishes inhibition of firing frequency of histaminergic neurons by 2 µM of RAMH (R‐(alpha)‐methylhistamine). Significant difference between data points is indicated by stars: *P < .05. **P < .01 (MWT). B, The H3R agonist imetit 3 µM inhibits firing frequency of histaminergic neurons to the same extent as RAMH 2 µM
Figure 2
Figure 2
Pharmacological features of histamine‐induced long‐lasting depression (LLDhist) of corticostriatal synaptic transmission in wild‐type mice. A, LLDhist is abolished by the H3R antagonist clobenpropit (20 µM). Difference between data points at period indicated by a line was calculated with MWT, ***P < .005. B, Representative recordings of evoked corticostriatal field potentials in control experiments and in the presence of clobenpropit. Averages of responses collected during 10 min of (each) control period, 10 min of HA (histamine) application, and last 20 min of recording (washout) are shown. C, Averaged time course diagrams show no effect of the D1R antagonist SCH23390 (15 µM) on LLDhist. D, Averages of responses collected during 10 min of control period, 10 min of SCH23390 perfusion, 10 min of HA & SCH23390 application, and last 20 min of recording (washout) in one representative experiment
Figure 3
Figure 3
Pharmacological activation or inhibition of protein kinase A (PKA) does not affect LLDhist A, averaged time course diagrams show that the D1R agonist SKF 38393 (15 µM) has no significant impact on histamine‐induced depression of corticostriatal transmission. Difference between data points at time period indicated by a line was calculated with MWT, n.s.: not significant B, representative recordings of evoked corticostriatal field potentials in control (10 min‐), during coapplication of histamine and SKF 38393 (10 min‐) and last washout period (20 min‐averages). C, The PKA inhibitor KT5720 (1 µM) does not affect LLDhist. D, Averages of responses collected during 10 min of control period, 10min of KT5720 perfusion, 10 min of histamine & KT5720 application and the last 20min of recording (washout) in one representative experiment. E, Analysis of the onset kinetics of histamine (HA) 10 µM response in control and in the presence of KT5720 shows significantly slower development of DDhist in presence of the PKA antagonist (left: averages of two groups, right: bar histograms with number of slices analyzed above it. P < .05, MWT). F, Imetit 3 µM, applied to the corticostriatal slices, is significantly less effective (***P < .005, MWT) than histamine (HA, 10 µM) in the induction of direct depression of corticostriatal transmission and does not differ from histamine in the induction of long‐lasting depression
Figure 4
Figure 4
Histamine‐induced depression (LLDhist) of corticostriatal synaptic transmission in LGS‐KO striatum. A, Initial inhibition of corticostriatal transmission by histamine is significantly smaller in LGS‐KO mice compared to the WT. Sustained inhibition (minutes 75‐90 of recordings) does not differ between genotypes. Difference between data points at time period indicated by a line was calculated with MWT, *P < .05; n.s.: not significant. B, Representative recordings of field potentials and their LLDhist in LGS‐KO mouse. Averages of responses collected during 10 min of control period, 10 min of histamine application, and last 20 min of recording (washout). C, Averaged time course diagrams show that combined application of histamine (10 µM) with the D1R agonist SKF 38393 (10‐15 µM) significantly accelerates recovery from inhibition in LGS‐KO mice (***P < .005, MWT). D, Representative averages of field responses in control (10 min), during histamine & SKF 38393 coapplication (10 min), and 20 last minutes of recording (washout) in LGS‐KO mouse
Figure 5
Figure 5
Modulation of LGS‐KO and WT histaminergic neurons by H3R ligands. Histaminergic neurons of the ventrolateral tuberomammillary nucleus, identified through excitation by the H3R antagonist clobenpropit 20 µM A, and/or inhibition by the H3R agonist RAMH 2 µM B, are similarly modulated in mice. No significant difference between data points (MWT)
Figure 6
Figure 6
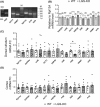
Transcription of histaminergic markers in mouse brain. A, Representative PCR products of expected size visualized after real‐time PCR on gel‐red stained agarose gel. M: DNA size marker (100 b.p. ladder). B, Bar histograms represent average and SEM from all real‐time PCR experiments. All reactions were normalized on the expressional level of Rpl13a followed by calibration on the WT mouse striatum (2−∆∆Ct method). Numbers of animals are given above the bars. C, Fold change (FC) datapoints (2−Ct method), one per mouse, each is an average of 3‐12 experiments. Medians of 18 groups do not differ significantly (P = .428, one‐way ANOVA with Kruskal‐Wallis test). Dunn's multiple comparison test revealed difference between H2R expression in dorsal striatum of LGS‐KO vs WT (*P < .05), whereas expression of the house keeping genes Rpl13a, Hsp90, GAPDH and actB did not differ. D, Fold change (FC) datapoints (2−Ct method) from mouse cortex. Same tests as in (C) reveal no difference between genotypes
Figure 7
Figure 7
Expression changes of genes related to dopamine and histamine signaling in postmortem brain tissue from the cerebral cortex of patients with liver cirrhosis and HE. Gene expression changes were measured by microarray analysis in two independent patient cohorts: one from Europe A, gene expression was analyzed with Student t test30; and another from Australia B, gene expression was analyzed with one‐way ANOVA due to the study design.31 In A and B, gene expression changes are given relative to the respective controls. *P < .05; #P ≤ .01; $P ≤ .001
Figure 8
Figure 8
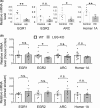
Real‐time PCR analysis of “molecular signature of wakefulness” in human cortex postmortem (A) and mouse (B) cortex and striatum of WT and LGS‐KO mice. A, Same samples as for microarray experiments shown in Figure 5A were amplified and analyzed with the “2−ΔΔCt” method, using beta‐actin expression as a reference. Note that results similar to those from gene array were obtained. *P = .05, **P = .01 (As values in each group fulfilled criteria of normal distribution (Kolmogorov‐Smirnov normality test), the unpaired t test was applied for the group comparison). B, Transcriptional changes in LGS‐KO mouse cortex (upper plot) or dorsal striatum (lower plot) in comparison to WT (significant difference is indicated as *P < .05 (MWT)

References

    1. Haas HL, Sergeeva OA, Selbach O. Histamine in the nervous system. Physiol Rev. 2008;88:1183‐1241. - PubMed
    1. Schwartz JC. The histamine H3 receptor: from discovery to clinical trials with pitolisant. Br J Pharmacol. 2011;163:713‐721. - PMC - PubMed
    1. Anaclet C, Parmentier R, Ouk K, et al. Orexin/hypocretin and histamine: distinct roles in the control of wakefulness demonstrated using knock‐out mouse models. J Neurosci. 2009;29:14423‐14438. - PMC - PubMed
    1. Wilkinson DJ, Smeeton NJ, Watt PW. Ammonia metabolism, the brain and fatigue; revisiting the link. Prog Neurogibol. 2010;91:200‐219. - PubMed
    1. Wilkinson DJ, Smeeton NJ, Castle PC, Watt PW. Absence of neuropsychological impairment in hyperammonaemia in healthy young adults; possible synergism in development of hepatic encephalopathy (HE) symptoms? Metab Brain Dis. 2011;26:203‐212. - PubMed

Publication types

MeSH terms