

The Influence of EEG References on the Analysis of Spatio-Temporal Interrelation Patterns
- PMID: 31572110
- PMCID: PMC6751257
- DOI: 10.3389/fnins.2019.00941
The Influence of EEG References on the Analysis of Spatio-Temporal Interrelation Patterns
Abstract
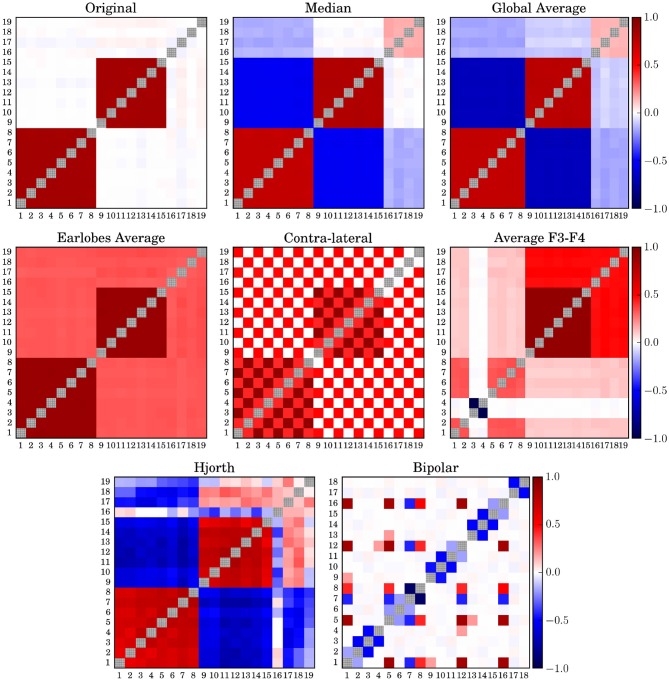
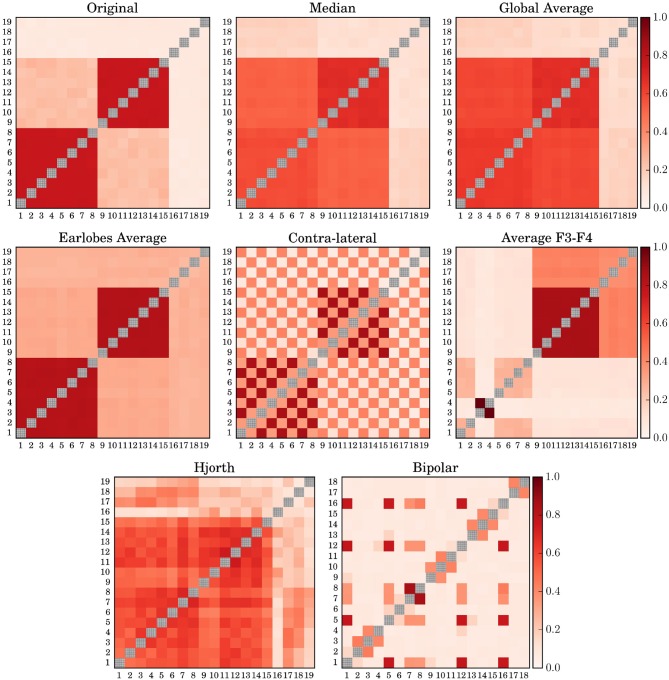
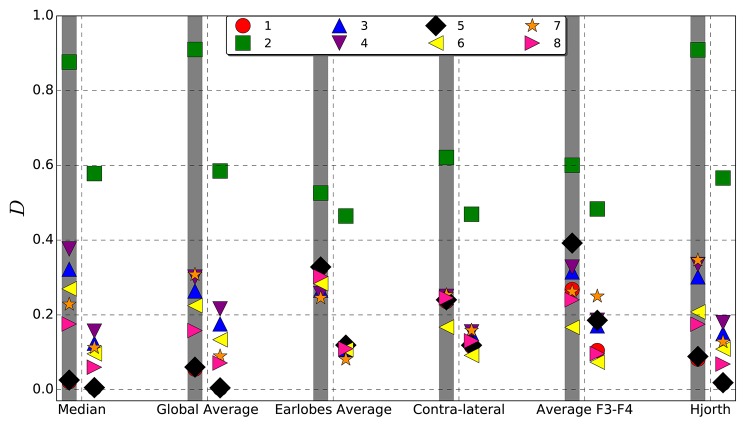
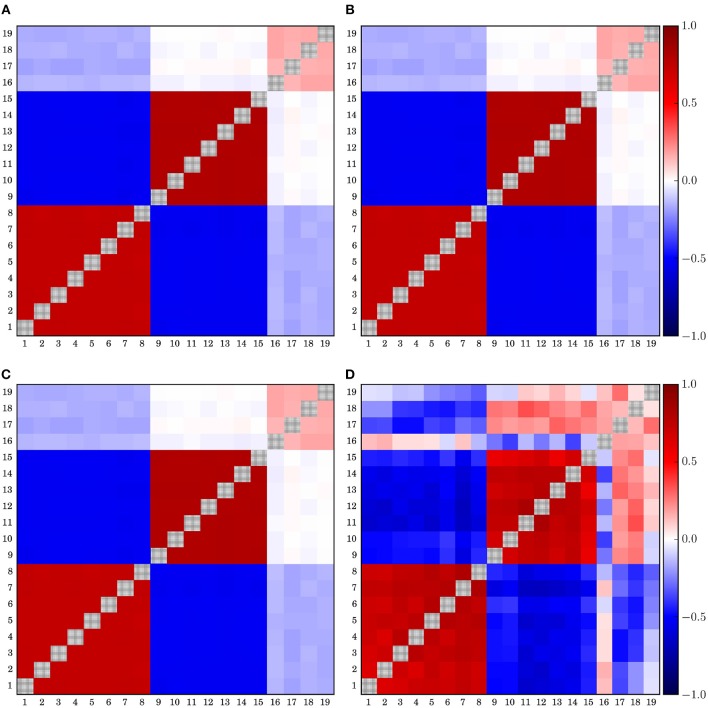
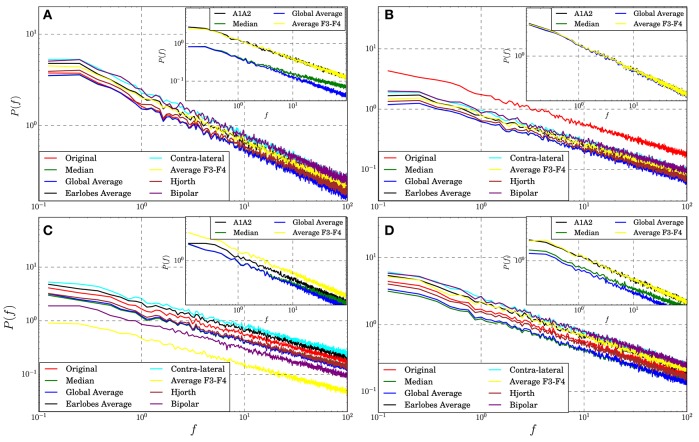
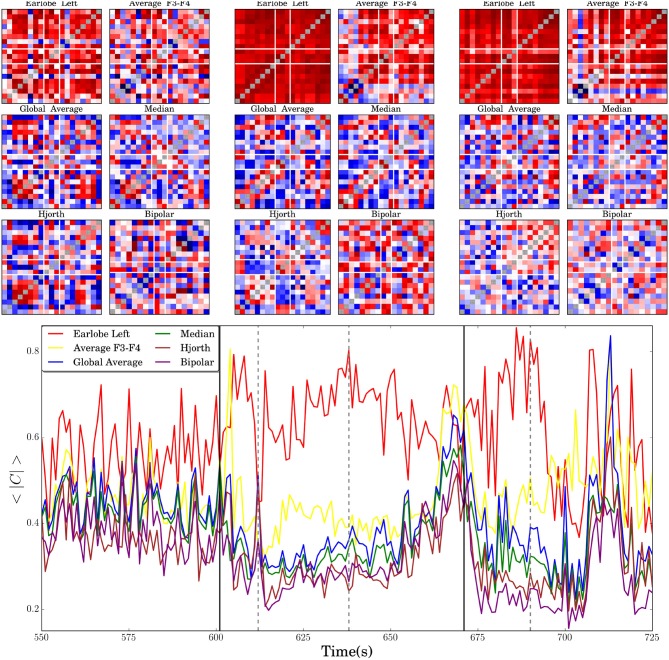
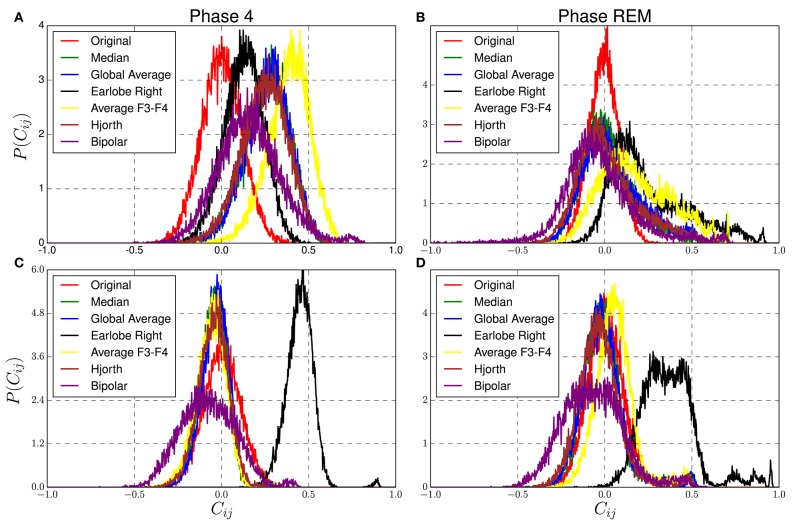
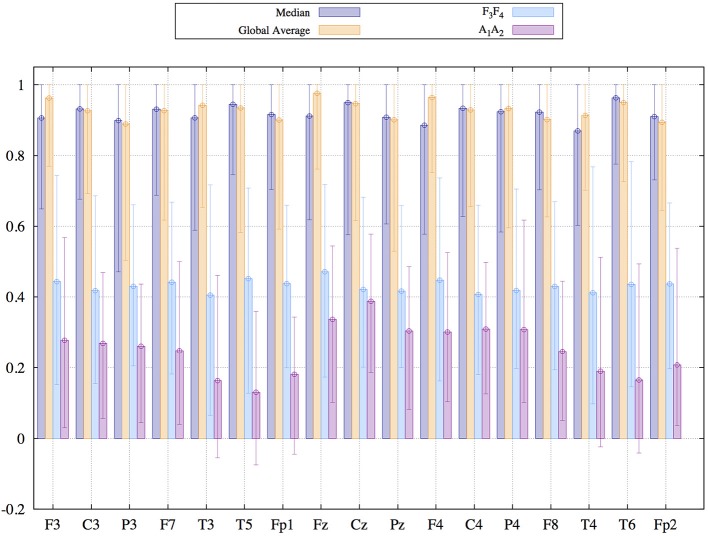
The characterization of the functional network of the brain dynamics has become a prominent tool to illuminate novel aspects of brain functioning. Due to its excellent time resolution, such research is oftentimes based on electroencephalographic recordings (EEG). However, a particular EEG-reference might cause crucial distortions of the spatiotemporal interrelation pattern and may induce spurious correlations as well as diminish genuine interrelations originally present in the dataset. Here we investigate in which manner correlation patterns are affected by a chosen EEG reference. To this end we evaluate the influence of 7 popular reference schemes on artificial recordings derived from well controlled numerical test frameworks. In this respect we are not only interested in the deformation of spatial interrelations, but we test additionally in which way the time evolution of the functional network, estimated via some bi-variate interrelation measures, gets distorted. It turns out that the median reference as well as the global average show the best performance in most situations considered in the present study. However, if a collective brain dynamics is present, where most of the signals get correlated, these schemes may also cause crucial deformations of the functional network, such that the parallel use of different reference schemes seems advisable.
Keywords: EEG reference; electroencephalography; functional network; multivariate analysis; time series analysis.
Copyright © 2019 Ríos-Herrera, Olguín-Rodríguez, Arzate-Mena, Corsi-Cabrera, Escalona, Marín-García, Ramos-Loyo, Rivera, Rivera-López, Zapata-Berruecos and Müller.
Figures
Similar articles
-
Recording human electrocorticographic (ECoG) signals for neuroscientific research and real-time functional cortical mapping.J Vis Exp. 2012 Jun 26;(64):3993. doi: 10.3791/3993. J Vis Exp. 2012. PMID: 22782131 Free PMC article.
-
An End-to-End Multi-Channel Convolutional Bi-LSTM Network for Automatic Sleep Stage Detection.Sensors (Basel). 2023 May 21;23(10):4950. doi: 10.3390/s23104950. Sensors (Basel). 2023. PMID: 37430865 Free PMC article.
-
Impact of the reference choice on scalp EEG connectivity estimation.J Neural Eng. 2016 Jun;13(3):036016. doi: 10.1088/1741-2560/13/3/036016. Epub 2016 May 3. J Neural Eng. 2016. PMID: 27138114
-
Source analysis of EEG oscillations using high-resolution EEG and MEG.Prog Brain Res. 2006;159:29-42. doi: 10.1016/S0079-6123(06)59003-X. Prog Brain Res. 2006. PMID: 17071222 Free PMC article. Review.
-
Spatiotemporal EEG analysis and distributed source estimation in presurgical epilepsy evaluation.J Clin Neurophysiol. 1999 May;16(3):239-66. doi: 10.1097/00004691-199905000-00005. J Clin Neurophysiol. 1999. PMID: 10426407 Review.
Cited by
-
Speech-Brain Frequency Entrainment of Dyslexia with and without Phonological Deficits.Brain Sci. 2020 Nov 28;10(12):920. doi: 10.3390/brainsci10120920. Brain Sci. 2020. PMID: 33260681 Free PMC article.
-
Yijinjing Qigong intervention shows strong evidence on clinical effectiveness and electroencephalography signal features for early poststroke depression: A randomized, controlled trial.Front Aging Neurosci. 2022 Aug 10;14:956316. doi: 10.3389/fnagi.2022.956316. eCollection 2022. Front Aging Neurosci. 2022. PMID: 36034130 Free PMC article.
-
Distinguishing Epileptiform Discharges From Normal Electroencephalograms Using Scale-Dependent Lyapunov Exponent.Front Bioeng Biotechnol. 2020 Sep 8;8:1006. doi: 10.3389/fbioe.2020.01006. eCollection 2020. Front Bioeng Biotechnol. 2020. PMID: 33015003 Free PMC article.
-
Inducing neuroplasticity through intracranial θ-burst stimulation in the human sensorimotor cortex.J Neurophysiol. 2021 Nov 1;126(5):1723-1739. doi: 10.1152/jn.00320.2021. Epub 2021 Oct 13. J Neurophysiol. 2021. PMID: 34644179 Free PMC article.
-
Stationary correlation pattern in highly non-stationary MEG recordings of healthy subjects and its relation to former EEG studies.PLoS One. 2024 Oct 22;19(10):e0307378. doi: 10.1371/journal.pone.0307378. eCollection 2024. PLoS One. 2024. PMID: 39436944 Free PMC article.
References
-
- Bedrosian E. (1962). The analytic signal representation of modulated waveforms. Proc. IRE 50, 2071–2076. 10.1109/JRPROC.1962.288236 - DOI
LinkOut - more resources
Full Text Sources