. 2019 Sep 13:10:2128.
doi: 10.3389/fmicb.2019.02128. eCollection 2019.

Life After Secretion- Yersinia enterocolitica Rapidly Toggles Effector Secretion and Can Resume Cell Division in Response to Changing External Conditions

Affiliations

Life After Secretion- Yersinia enterocolitica Rapidly Toggles Effector Secretion and Can Resume Cell Division in Response to Changing External Conditions

Bailey Milne-Davies et al. Front Microbiol. .

Abstract

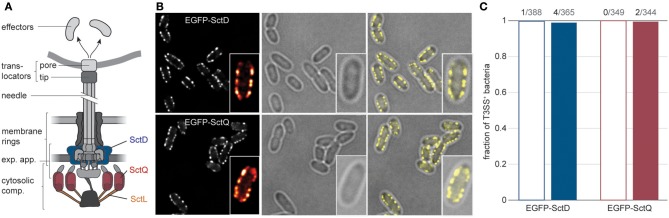
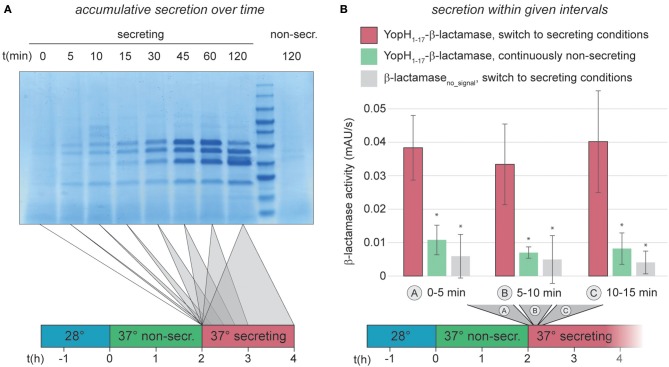
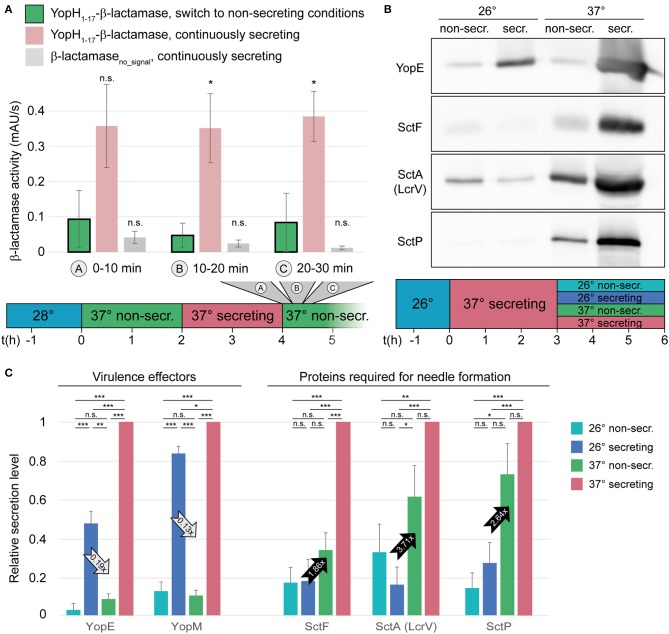
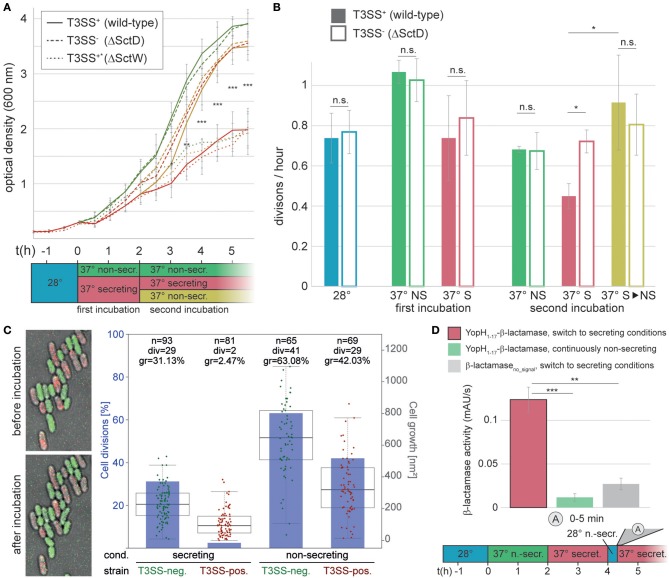
Many pathogenic bacteria use the type III secretion system (T3SS) injectisome to manipulate host cells by injecting virulence-promoting effector proteins into the host cytosol. The T3SS is activated upon host cell contact, and its activation is accompanied by an arrest of cell division; hence, many species maintain a T3SS-inactive sibling population to propagate efficiently within the host. The enteric pathogen Yersinia enterocolitica utilizes the T3SS to prevent phagocytosis and inhibit inflammatory responses. Unlike other species, almost all Y. enterocolitica are T3SS-positive at 37°C, which raises the question, how these bacteria are able to propagate within the host, that is, when and how they stop secretion and restart cell division after a burst of secretion. Using a fast and quantitative in vitro secretion assay, we have examined the initiation and termination of type III secretion. We found that effector secretion begins immediately once the activating signal is present, and instantly stops when this signal is removed. Following effector secretion, the bacteria resume division within minutes after being introduced to a non-secreting environment, and the same bacteria are able to re-initiate effector secretion at later time points. Our results indicate that Y. enterocolitica use their type III secretion system to promote their individual survival when necessary, and are able to quickly switch their behavior toward replication afterwards, possibly gaining an advantage during infection.

Keywords: Yersinia enterocolitica; bacterial protein secretion; enteropathogens; host-pathogen interaction; protein translocation; regulation of virulence mechanisms.


Figures

Figure 1
Figure 1
The type III secretion system is expressed in almost all Y. enterocolitica, both under secreting and non-secreting conditions. (A) Schematic overview of the different substructures of the T3SS (left). Positions of the labeled proteins analyzed in this study are indicated (right). exp. app, export apparatus. (B) Micrographs of Y. enterocolitica ΔHOPEMTasd expressing EGFP-SctD (top) or EGFP-SctQ (bottom) from their native genetic localization. Three hours after induction of T3SS expression by temperature shift to 37°C under non-secreting conditions, bacteria were subjected to secreting conditions, and imaged. Left, EGFP fluorescence (insets show fluorescence intensity for one enlarged bacterium in ImageJ red-hot coloring scale); center, corresponding phase contrast images; right, overlay. Larger fields of view and images of bacteria under non-secreting conditions are shown in Supplementary Figure 1. (C) Fraction of bacteria with standard expression and distribution of T3SS (multiple membrane foci) for the indicated fusion protein, 3 h after induction of expression of the T3SS under non-secreting conditions (empty bars) or secreting conditions (filled bars) n = 344–388. Numbers on top indicate the number of bacteria that do not display multiple visible T3SS, and the number of analyzed bacteria. Secreting and non-secreting conditions refer to incubation in medium with addition of 5 mM EGTA or CaCl2, respectively.
Figure 2
Figure 2
Immediate activation of the T3SS can be measured by an in vitro β-lactamase assay. (A) Accumulative effector secretion into the culture supernatant during a standard in vitro secretion assay using Y. enterocolitica MRS40. At the time points indicated (0 min = activation of T3SS secretion by resuspension of bacteria in secreting medium, see also time line at bottom), the culture supernatant of 3 × 10⁹ bacteria was removed and visualized by Coomassie staining of an SDS-PAGE gel. Control (far right), bacteria resuspended in non-secreting medium. (B) Quantification of effector export in the indicated time ranges after resuspension of Y. enterocolitica ΔHOPEMTasd in secreting medium (see also time line at bottom). Red bars, β-lactamase activity indicative of export of the reporter T3SS substrate YopH1−17-β-lactamase; green bars, non-secreting control; gray bars, β-lactamase lacking a T3SS secretion signal under secreting conditions. Error bars indicate standard deviation of the averages of technical triplicates between three biological replicates. *p < 0.05 vs. the YopH1−17-β-lactamase, switch to secreting conditions, sample (red bars) in a two-tailed homoscedastic t-test. Secreting and non-secreting (non-secr.) conditions refer to incubation in medium with addition of 5 mM EGTA or CaCl2, respectively.
Figure 3
Figure 3
Type III secretion, but not needle formation, is stopped within short time in the absence of activating signal. (A) Quantification of effector export in the indicated time ranges after resuspension of Y. enterocolitica ΔHOPEMTasd in non-secreting medium (see also time line at bottom). Green bars, β-lactamase activity indicative of export of the reporter T3SS substrate YopH1−17-β-lactamase; red bars, secreting control; gray bars, β-lactamase lacking a T3SS secretion signal under secreting conditions. Error bars indicate standard deviation of the averages of technical triplicates between three biological replicates. *p < 0.05 vs. the YopH1−17-β-lactamase, switch to non-secreting conditions, sample in a two-tailed homoscedastic t-test; n.s., difference not statistically significant. (B) The export of different substrate classes is influenced differently by the temperature and the external calcium concentration. Wild-type Y. enterocolitica expressing all effectors (MRS40) were grown at 26°C for 1.5 h, and subsequently at 37°C under secreting conditions for 3 h. Afterwards, they were resuspended in different conditions, as indicated (top and time line at bottom) for another 3 h. Proteins secreted by 3 × 10⁹ bacteria were separated on an SDS-PAGE gel and analyzed by immunoblot using antibodies against the indicated proteins, the effector YopE, the needle subunit SctF, the hydrophilic translocator SctA (LcrV), and the ruler protein SctP (n = 4, image representative). The respective analysis for bacteria directly subjected to the indicated conditions after incubation at 26°C, Coomassie-based analysis of all secreted proteins, and protein expression controls are displayed in Supplementary Figure 6. (C) Relative secretion levels of indicated virulence effectors (left) and proteins required for needle export (right) under the indicated conditions [see time line in (B)]. Secretion levels were quantified by densitometric analysis of the bands for the respective proteins in Coomassie-stained SDS-PAGE gels for YopE and YopM (n = 3) and immunoblots for YopE (one additional analysis), SctF, SctA (LcrV), and SctP (n = 4 in each case), and normalized to the respective secretion level at 37°C under secreting conditions. Error bars display the standard error of the mean; arrows indicate the difference between the influence of the temperature (28°C, secreting conditions) and calcium levels (37°C, non-secreting conditions) and the ratio of secretion under these conditions. Secreting and non-secreting (non-secr.) conditions refer to incubation in medium with addition of 5 mM EGTA or CaCl2, respectively. *p < 0.05, **p < 0.01, ***p < 0.001 in a two-tailed homoscedastic t-test; n.s., difference not statistically significant.
Figure 4
Figure 4
Bacteria can resume division, or engage in another round of secretion after deactivation of secretion. (A) Growth curves (optical culture density at 600 nm) of T3SS-positive Y. enterocolitica wild-type MRS40 expressing all virulence effectors (T3SS+, continuous lines), T3SS-negative bacteria (T3SS, dashed lines), and Ca2+-blind constantly secreting bacteria (T3SS+*, dotted lines) incubated under the conditions indicated in the time line (bottom). (B) Number of bacterial divisions per hour during the different phases, colors as in (A). Filled bars, T3SS-positive bacteria; open bars, T3SS-negative bacteria. Error bars indicate the standard deviation of the averages of technical triplicates between three independent biological replicates. (C) Growth and division of T3SS-positive (mCherry-SctL, red) and T3SS-negative (EGFP-SctL ΔSctD, green) Y. enterocolitica ΔHOPEMTasd on LB-agarose pads under secreting conditions during the first 2 h of the second incubation period [see (A)]. Left, fluorescence micrographs showing growth and division of green (T3SS-negative), but not of red (T3SS-positive) bacteria within the analysis period. Right, quantification of fraction of cell divisions (blue bars and axis on left side) and cell growth (increase in two-dimensional cell area on micrographs) per initial bacterium (box charts and single data points, right axis) for the indicated strains and conditions. Each data point represents a single measurement. The boxes show the median and quartiles (75th and 25th percentile). The whiskers extend 1.5 times the interquartile range until the furthest data point within this range. No standard deviation is displayed. n, number of analyzed bacteria; div, number of bacteria dividing within analysis period; gr, average growth (increase of cell area) within analysis period. Cell growth is statistically significantly different (p < 0.001 in a two-tailed homoscedastic t-test) for all pairwise comparisons of strains and conditions. (D) Quantification of effector export in the indicated time range after resuspension of Y. enterocolitica ΔHOPEMTasd in secreting medium after a 15 min incubation in non-secreting medium at 28°C (see time line at bottom). Red bar, β-lactamase activity indicative of export of the reporter T3SS substrate YopH1−17-β-lactamase; green bar, non-secreting control; gray bar, β-lactamase lacking a T3SS secretion signal under secreting conditions. Error bars indicate standard deviation of the averages of technical triplicates between three biological replicates. Secreting and non-secreting conditions refer to incubation in medium with addition of 5 mM EGTA or CaCl2, respectively. The incubation steps at 28°C (blue bars) are performed in medium with 5 mM CaCl2. *p < 0.05; ** p < 0.01; *** p < 0.001 in a two-tailed homoscedastic t-test; n.s., difference not statistically significant. For (A), this statistical analysis applies to the difference between wild-type and ΔSctD under secreting conditions (continuous and dashed red lines), other time points were not statistically significantly different.

References

    1. Akeda Y., Galán J. E. (2005). Chaperone release and unfolding of substrates in type III secretion. Nature 437, 911–915. 10.1038/nature03992 - DOI - PubMed
    1. Armentrout E. I., Rietsch A. (2016). The type III secretion translocation pore senses host cell contact. PLOS Pathog. 12:e1005530. 10.1371/journal.ppat.1005530 - DOI - PMC - PubMed
    1. Avican K., Fahlgren A., Huss M., Heroven A. K., Beckstette M., Dersch P., et al. . (2015). Reprogramming of yersinia from virulent to persistent mode revealed by complex in vivo RNA-seq analysis. PLoS Pathog. 11:e1004600. 10.1371/journal.ppat.1004600 - DOI - PMC - PubMed
    1. Behnsen J., Jellbauer S., Wong C. P., Edwards R. A., George M. D., Ouyang W., et al. . (2014). The cytokine IL-22 promotes pathogen colonization by suppressing related commensal bacteria. Immunity 40, 262–273. 10.1016/j.immuni.2014.01.003 - DOI - PMC - PubMed
    1. Böhme K., Steinmann R., Kortmann J., Seekircher S., Heroven A. K., Berger E., et al. . (2012). Concerted actions of a thermo-labile regulator and a unique intergenic RNA thermosensor control Yersinia virulence. PLoS Pathog. 8:e1002518. 10.1371/journal.ppat.1002518 - DOI - PMC - PubMed

LinkOut - more resources