

Non-parametric Heat Map Representation of Flow Cytometry Data: Identifying Cellular Changes Associated With Genetic Immunodeficiency Disorders
- PMID: 31572362
- PMCID: PMC6749093
- DOI: 10.3389/fimmu.2019.02134
Non-parametric Heat Map Representation of Flow Cytometry Data: Identifying Cellular Changes Associated With Genetic Immunodeficiency Disorders
Abstract
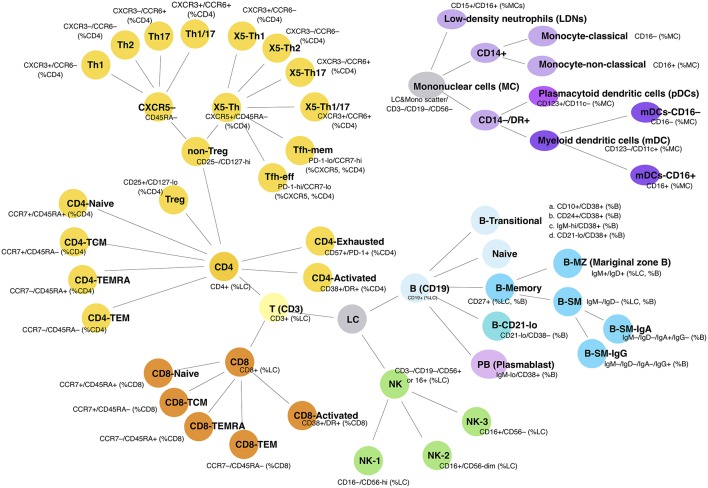
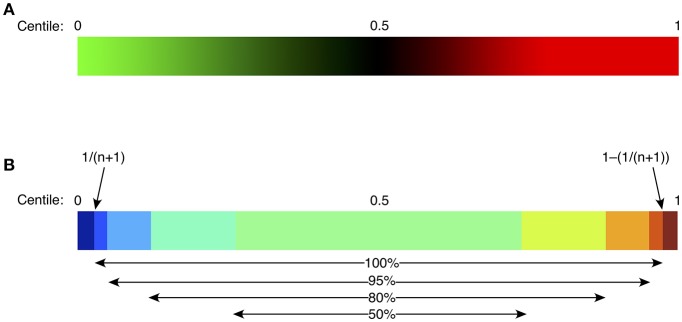
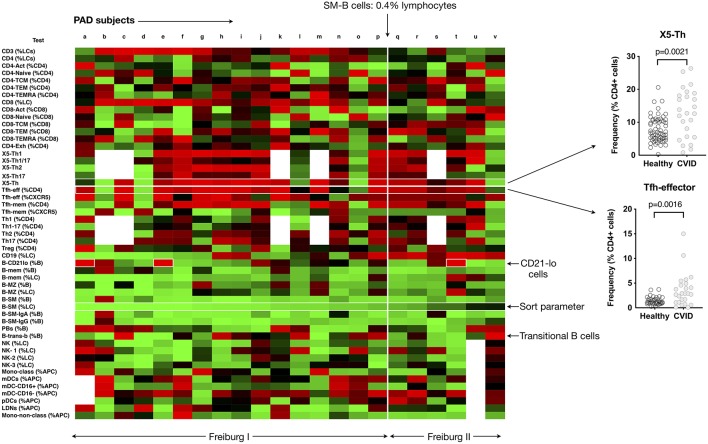
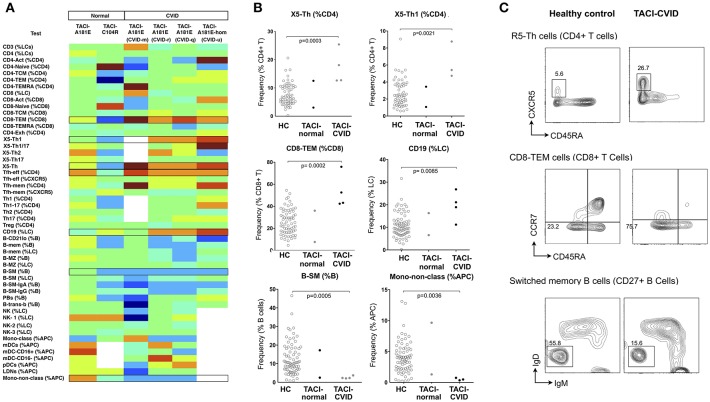
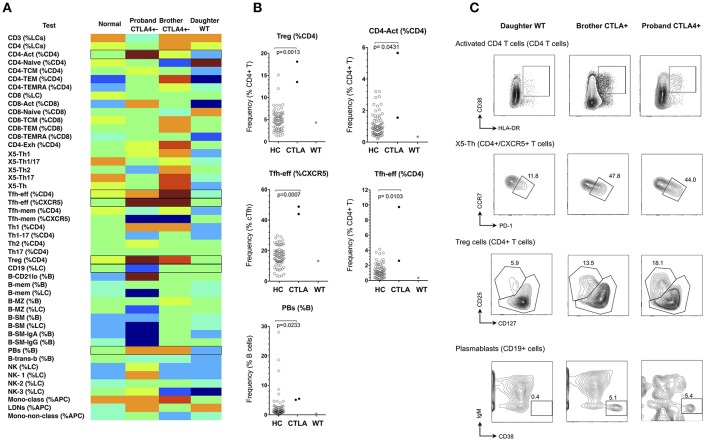
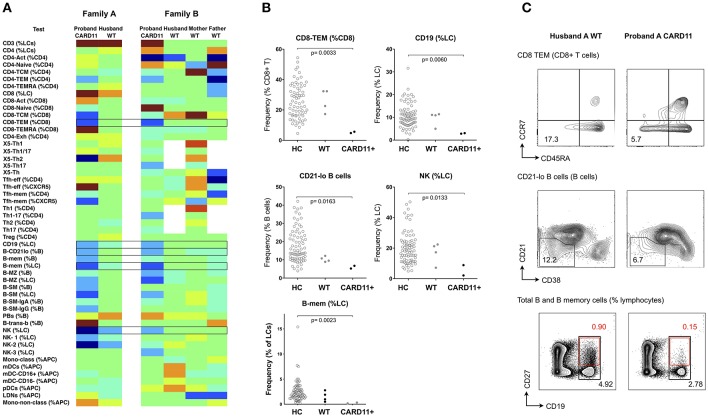
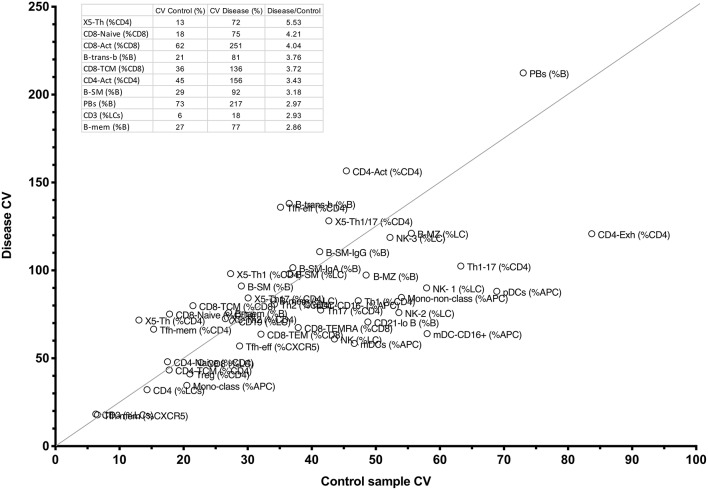
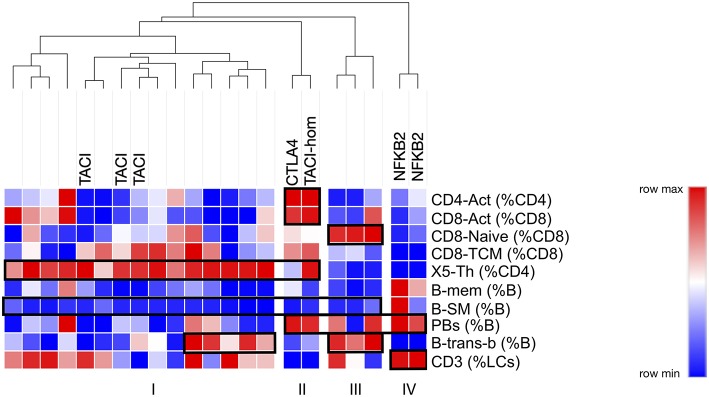
Genetic primary immunodeficiency diseases are increasingly recognized, with pathogenic mutations changing the composition of circulating leukocyte subsets measured by flow cytometry (FCM). Discerning changes in multiple subpopulations is challenging, and subtle trends might be missed if traditional reference ranges derived from a control population are applied. We developed an algorithm where centiles were allocated using non-parametric comparison to controls, generating multiparameter heat maps to simultaneously represent all leukocyte subpopulations for inspection of trends within a cohort or segregation with a putative genetic mutation. To illustrate this method, we analyzed patients with Primary Antibody Deficiency (PAD) and kindreds harboring mutations in TNFRSF13B (encoding TACI), CTLA4, and CARD11. In PAD, loss of switched memory B cells (B-SM) was readily demonstrated, but as a continuous, not dichotomous, variable. Expansion of CXCR5+/CD45RA- CD4+ T cells (X5-Th cells) was a prominent feature in PAD, particularly in TACI mutants, and patients with expansion in CD21-lo B cells or transitional B cells were readily apparent. We observed differences between unaffected and affected TACI mutants (increased B cells and CD8+ T-effector memory cells, loss of B-SM cells and non-classical monocytes), cellular signatures that distinguished CTLA4 haploinsufficiency itself (expansion of plasmablasts, activated CD4+ T cells, regulatory T cells, and X5-Th cells) from its clinical expression (B-cell depletion), and those that were associated with CARD11 gain-of-function mutation (decreased CD8+ T effector memory cells, B cells, CD21-lo B cells, B-SM cells, and NK cells). Co-efficients of variation exceeded 30% for 36/54 FCM parameters, but by comparing inter-assay variation with disease-related variation, we ranked each parameter in terms of laboratory precision vs. disease variability, identifying X5-Th cells (and derivatives), naïve, activated, and central memory CD8+ T cells, transitional B cells, memory and SM-B cells, plasmablasts, activated CD4 cells, and total T cells as the 10 most useful cellular parameters. Applying these to cluster analysis of our PAD cohort, we could detect subgroups with the potential to reflect underlying genotypes. Heat mapping of normalized FCM data reveals cellular trends missed by standard reference ranges, identifies changes associating with a phenotype or genotype, and could inform hypotheses regarding pathogenesis of genetic immunodeficiency.
Keywords: CARD11; CTLA4; TACI; TNFSF13B; common variable immunodeficiency; flow cytometry; immunodeficiency.
Copyright © 2019 Ellyard, Tunningley, Lorenzo, Jiang, Cook, Chand, Talaulikar, Hatch, Wilson, Vinuesa, Cook and Fulcher.
Figures
Similar articles
-
Eight-color immunophenotyping of T-, B-, and NK-cell subpopulations for characterization of chronic immunodeficiencies.Cytometry B Clin Cytom. 2014 May;86(3):191-206. doi: 10.1002/cyto.b.21162. Epub 2014 Jan 31. Cytometry B Clin Cytom. 2014. PMID: 24488780
-
Extended immunophenotyping reference values in a healthy pediatric population.Cytometry B Clin Cytom. 2019 May;96(3):223-233. doi: 10.1002/cyto.b.21728. Epub 2018 Oct 17. Cytometry B Clin Cytom. 2019. PMID: 30334372
-
Evaluation of a simplified dual-platform flow cytometric method for measurement of lymphocyte subsets and T-cell maturation phenotypes in the population of Nouna, Burkina Faso.Clin Vaccine Immunol. 2007 Jun;14(6):775-81. doi: 10.1128/CVI.00043-07. Epub 2007 Apr 18. Clin Vaccine Immunol. 2007. PMID: 17442847 Free PMC article.
-
[Alterations in lymphocyte subsets in variable immunodeficiency syndrome].Immun Infekt. 1992 Jul;20(3):73-5. Immun Infekt. 1992. PMID: 1500075 Review. German.
-
Total threshold cytotoxicity of therapeutic antibodies for selective destruction of pathogenic memory T cells: implications for immunotherapy of autoimmune and allergenic disorders.Expert Rev Clin Immunol. 2019 Jul;15(7):701-706. doi: 10.1080/1744666X.2019.1617698. Epub 2019 May 24. Expert Rev Clin Immunol. 2019. PMID: 31072229 Review.
Cited by
-
Flow Cytometry: From Experimental Design to Its Application in the Diagnosis and Monitoring of Respiratory Diseases.Int J Mol Sci. 2020 Nov 22;21(22):8830. doi: 10.3390/ijms21228830. Int J Mol Sci. 2020. PMID: 33266385 Free PMC article. Review.
-
Rare SH2B3 coding variants in lupus patients impair B cell tolerance and predispose to autoimmunity.J Exp Med. 2024 Apr 1;221(4):e20221080. doi: 10.1084/jem.20221080. Epub 2024 Feb 28. J Exp Med. 2024. PMID: 38417019 Free PMC article.
-
Advanced immunophenotyping of lymphocyte and monocyte subsets in healthy Australian adults using a novel spectral flow cytometry panel.Front Immunol. 2025 Jul 22;16:1577206. doi: 10.3389/fimmu.2025.1577206. eCollection 2025. Front Immunol. 2025. PMID: 40766316 Free PMC article.
-
Immune Monitoring of Patients With Primary Immune Regulation Disorders Unravels Higher Frequencies of Follicular T Cells With Different Profiles That Associate With Alterations in B Cell Subsets.Front Immunol. 2020 Oct 29;11:576724. doi: 10.3389/fimmu.2020.576724. eCollection 2020. Front Immunol. 2020. PMID: 33193371 Free PMC article.
-
Functions of Tfh Cells in Common Variable Immunodeficiency.Front Immunol. 2020 Jan 30;11:6. doi: 10.3389/fimmu.2020.00006. eCollection 2020. Front Immunol. 2020. PMID: 32082308 Free PMC article. Review.
References
-
- Geha RS, Notarangelo LD, Casanova JL, Chapel H, Conley ME, Fischer A, et al. . Primary immunodeficiency diseases: an update from the international union of immunological societies primary immunodeficiency diseases classification committee. J Allergy Clin Immunol. (2007) 120:776–94. 10.1016/j.jaci.2007.08.053 - DOI - PMC - PubMed
-
- Motta-Mena LB, Smith SA, Mallory MJ, Jackson J, Wang J, Lynch KW. A disease-associated polymorphism alters splicing of the human CD45 phosphatase gene by disrupting combinatorial repression by heterogeneous nuclear ribonucleoproteins (hnRNPs). J Biol Chem. (2011) 286:20043–53. 10.1074/jbc.M111.218727 - DOI - PMC - PubMed
Publication types
MeSH terms
LinkOut - more resources
Full Text Sources
Other Literature Sources
Medical
Research Materials