

Tbet Expression in Regulatory T Cells Is Required to Initiate Th1-Mediated Colitis
- PMID: 31572375
- PMCID: PMC6749075
- DOI: 10.3389/fimmu.2019.02158
Tbet Expression in Regulatory T Cells Is Required to Initiate Th1-Mediated Colitis
Abstract
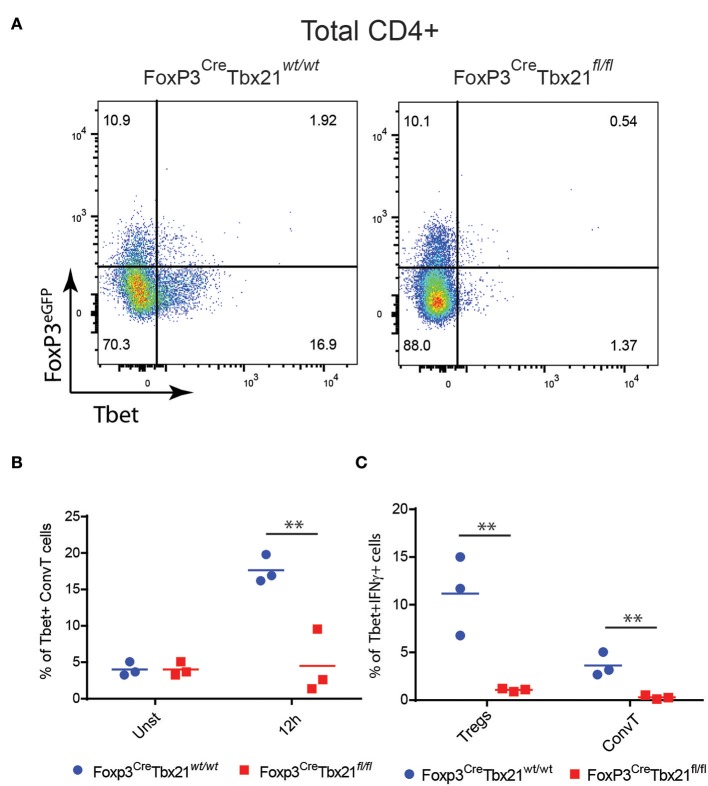
In normal conditions gut homeostasis is maintained by the suppressive activity of regulatory T cells (Tregs), characterized by the expression of the transcription factor FoxP3. In human inflammatory bowel disease, which is believed to be the consequence of the loss of tolerance toward antigens normally contained in the gut lumen, Tregs have been found to be increased and functionally active, thus pointing against their possible role in the pathogenesis of this immune-mediated disease. Though, in inflammatory conditions, Tregs have been shown to upregulate the T helper (Th) type 1-related transcription factor Tbet and to express the pro-inflammatory cytokine IFNγ, thus suggesting that at a certain point of the inflammatory process, Tregs might contribute to inflammation rather than suppress it. Starting from the observation that Tregs isolated from the lamina propria of active but not inactive IBD patients or uninflamed controls express Tbet and IFNγ, we investigated the functional role of Th1-like Tregs in the dextran sulfate model of colitis. As observed in human IBD, Th1-like Tregs were upregulated in the inflamed lamina propria of treated mice and the expression of Tbet and IFNγ in Tregs preceded the accumulation of conventional Th1 cells. By using a Treg-specific Tbet conditional knockout, we demonstrated that Tbet expression in Tregs is required for the development of colitis. Indeed, Tbet knockout mice developed milder colitis and showed an impaired Th1 immune response. In these mice not only the Tbet deficient Tregs but also the Tbet proficient conventional T cells showed reduced IFNγ expression. However, Tbet deficiency did not affect the Tregs suppressive capacity in vitro and in vivo in the adoptive transfer model of colitis. In conclusion here we show that Tbet expression by Tregs sustains the early phase of the Th1-mediated inflammatory response in the gut.
Keywords: Tbet; Th1-like Tregs; Treg cells; inflammation; inflammatory bowel disease.
Copyright © 2019 Di Giovangiulio, Rizzo, Franzè, Caprioli, Facciotti, Onali, Favale, Stolfi, Fehling, Monteleone and Fantini.
Figures


Similar articles
-
RORγt Promotes Foxp3 Expression by Antagonizing the Effector Program in Colonic Regulatory T Cells.J Immunol. 2021 Oct 15;207(8):2027-2038. doi: 10.4049/jimmunol.2100175. Epub 2021 Sep 13. J Immunol. 2021. PMID: 34518282 Free PMC article.
-
Analysis of murine and human Treg subsets in inflammatory bowel disease.Mol Med Rep. 2017 Sep;16(3):2893-2898. doi: 10.3892/mmr.2017.6912. Epub 2017 Jul 4. Mol Med Rep. 2017. PMID: 28677759
-
FTY720 ameliorates Th1-mediated colitis in mice by directly affecting the functional activity of CD4+CD25+ regulatory T cells.J Immunol. 2007 Feb 15;178(4):2458-68. doi: 10.4049/jimmunol.178.4.2458. J Immunol. 2007. PMID: 17277153
-
[Development, competition and plasticity of the T-lymph cells in inflammatory bowel disease].Nihon Rinsho Meneki Gakkai Kaishi. 2012;35(5):399-411. doi: 10.2177/jsci.35.399. Nihon Rinsho Meneki Gakkai Kaishi. 2012. PMID: 23124082 Review. Japanese.
-
Stability of Regulatory T Cells Undermined or Endorsed by Different Type-1 Cytokines.Adv Exp Med Biol. 2015;850:17-30. doi: 10.1007/978-3-319-15774-0_2. Adv Exp Med Biol. 2015. PMID: 26324343 Review.
Cited by
-
Post-Translational Regulations of Foxp3 in Treg Cells and Their Therapeutic Applications.Front Immunol. 2021 Apr 12;12:626172. doi: 10.3389/fimmu.2021.626172. eCollection 2021. Front Immunol. 2021. PMID: 33912156 Free PMC article. Review.
-
Interplay between Cytokine Circuitry and Transcriptional Regulation Shaping Helper T Cell Pathogenicity and Plasticity in Inflammatory Bowel Disease.Int J Mol Sci. 2020 May 11;21(9):3379. doi: 10.3390/ijms21093379. Int J Mol Sci. 2020. PMID: 32403220 Free PMC article. Review.
-
Translating Treg Therapy for Inflammatory Bowel Disease in Humanized Mice.Cells. 2021 Jul 21;10(8):1847. doi: 10.3390/cells10081847. Cells. 2021. PMID: 34440615 Free PMC article. Review.
-
Heterogeneity of T Cells in Atherosclerosis Defined by Single-Cell RNA-Sequencing and Cytometry by Time of Flight.Arterioscler Thromb Vasc Biol. 2021 Feb;41(2):549-563. doi: 10.1161/ATVBAHA.120.312137. Epub 2020 Dec 3. Arterioscler Thromb Vasc Biol. 2021. PMID: 33267666 Free PMC article. Review.
-
Psoriasis: A Multidimensional Review of Onset, Progression, Treatment, and the Evolution of Disease Models.Mol Diagn Ther. 2025 May;29(3):345-366. doi: 10.1007/s40291-025-00776-8. Epub 2025 Apr 1. Mol Diagn Ther. 2025. PMID: 40167939 Review.
References
Publication types
MeSH terms
Substances
LinkOut - more resources
Full Text Sources
Molecular Biology Databases
Research Materials