. 2019 Sep 12:10:2161.
doi: 10.3389/fimmu.2019.02161. eCollection 2019.

A Single-Stranded Oligonucleotide Inhibits Toll-Like Receptor 3 Activation and Reduces Influenza A (H1N1) Infection

Affiliations

A Single-Stranded Oligonucleotide Inhibits Toll-Like Receptor 3 Activation and Reduces Influenza A (H1N1) Infection

Candice Poux et al. Front Immunol. .

Abstract

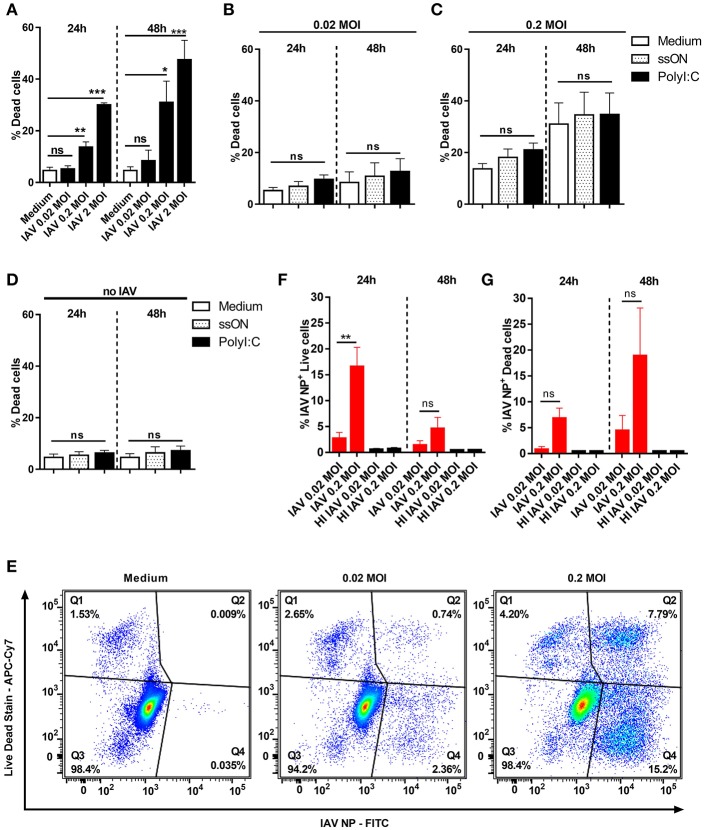
The initiation of an immune response is dependent on the activation and maturation of dendritic cells after sensing pathogen associated molecular patterns by pattern recognition receptors. However, the response needs to be balanced as excessive pro-inflammatory cytokine production in response to viral or stress-induced pattern recognition receptor signaling has been associated with severe influenza A virus (IAV) infection. Here, we use an inhibitor of Toll-like receptor (TLR)3, a single-stranded oligonucleotide (ssON) with the capacity to inhibit certain endocytic routes, or a TLR3 agonist (synthetic double-stranded RNA PolyI:C), to evaluate modulation of innate responses during H1N1 IAV infection. Since IAV utilizes cellular endocytic machinery for viral entry, we also assessed ssON's capacity to affect IAV infection. We first show that IAV infected human monocyte-derived dendritic cells (MoDC) were unable to up-regulate the co-stimulatory molecules CD80 and CD86 required for T cell activation. Exogenous TLR3 stimulation did not overcome the IAV-mediated inhibition of co-stimulatory molecule expression in MoDC. However, TLR3 stimulation using PolyI:C led to an augmented pro-inflammatory cytokine response. We reveal that ssON effectively inhibited PolyI:C-mediated pro-inflammatory cytokine production in MoDC, notably, ssON treatment maintained an interferon response induced by IAV infection. Accordingly, RNAseq analyses revealed robust up-regulation of interferon-stimulated genes in IAV cultures treated with ssON. We next measured reduced IAV production in MoDC treated with ssON and found a length requirement for its anti-viral activity, which overlapped with its capacity to inhibit uptake of PolyI:C. Hence, in cases wherein an overreacting TLR3 activation contributes to IAV pathogenesis, ssON can reduce this signaling pathway. Furthermore, concomitant treatment with ssON and IAV infection in mice resulted in maintained weight and reduced viral load in the lungs. Therefore, extracellular ssON provides a mechanism for immune regulation of TLR3-mediated responses and suppression of IAV infection in vitro and in vivo in mice.

Keywords: TLR3; clathrin-mediated endocytosis; co-stimulatory molecules; cytokines; human monocyte-derived dendritic cells (MoDC); influenza A; mice; single-stranded oligonucleotides.


Figures

Figure 1
Figure 1
Cell death in IAV-infected and non-infected MoDC. MoDC were mock or IAV-infected at indicated MOI for 4 h and the viability was measured by flow cytometry after culture in medium or stimulation with ssON or PolyI:C. (A–D) The frequency of dead MoDC was measured 24 and 48 h p.i. by flow cytometry. Graphs represent mean ± SEM with n = 8–12 (24 h) and n = 5–8 (48 h) except for MOI of 2 (n = 2 in triplicates for both time points). In (A), statistical comparisons were made between mock infection (“Medium”) and IAV infections. In (B–D), the different treatments with ligands were compared with IAV infection without any ligands (white bars). Statistics were calculated using Kruskal-Wallis one-way ANOVA test with Dunns multiple comparisons test and alpha set to 0.05. (E) Representative flow cytometry plots showing the gating strategy to determine dead non-infected (Q1), dead IAV-infected NP+ (Q2), live non-infected (Q3), and live IAVinfected NP+ (Q4) MoDC. (F,G) Bar graphs showing percentages of live (F) and dead (G) IAV-infected NP+ MoDC over time (red bars). Mean ±SEM with n = 9 for 24 h and n = 5 for 48 h except for the control HI IAV (HI 0.02, n = 3 and 1, HI 0.2, n = 4 and 2, 24, and 48 h respectively). P-value: not significant (ns) P > 0.05; *P ≤ 0.05; **P ≤ 0.01; ***P ≤ 0.001.
Figure 2
Figure 2
Expression of CD80 and CD86 in IAV-infected and non-infected MoDC. MoDC were mock or IAV-infected at indicated MOI for 4 h Statistical analysis were performed in comparison with mock infection (Medium) using one-way ANOVA with Dunn's multiple comparison test (alpha 0.05) and indicated with a line. Calculations made between two groups using two-tailed Mann-Whitney test were depicted with a bar. P-value: not significant (ns) P > 0.05; *P ≤ 0.05; **P ≤ 0.01; ***P ≤ 0.001. Frequencies of CD80 (A) and CD86 (B) expressing cells were measured by flow cytometry after gating on live non-infected (blue striped bar) and live IAV-infected NP+ (red bar) MoDC kept in medium alone after IAV infection (gating shown in Figure 1E and Supplementary Figure 2). Mean ± SEM with n = 8 (24 h) and n = 5 (48 h). Graphs representing CD80 (C) and CD86 (D) expression in live non-infected MoDC 24 h post mock or viral infection, at indicated MOI, for each donor (n = 9). MoDC were IAV-infected followed by addition of PolyI:C (chess bars) or kept in Medium alone. Graphs showing CD80 (E,G) and CD86 (F,H) expression on gated live non-infected (blue striped bar Medium) (blue chess bar PolyI:C) or live IAV-infected NP+ (red bar Medium) (red chess bar PolyI:C) MoDC exposed to IAV at 0.02 MOI (E,F) or 0.2 MOI (G,H) and indicated treatment 24 h p.i. Control cultures without PolyI:C are indicated as medium. Error bars show mean ± SEM with n = 8.
Figure 3
Figure 3
IAV infected MoDC display up-regulation of ISGs. MA-plots after RNA sequencing of MoDC samples. Each comparison includes a total of four samples. Genes with adjusted p-value below 0.05 are fully colored (ISG, green; inflammasome, purple; rest, black). (A) Medium control vs. IAV 0.02 MOI. (B) Medium control vs. IAV 0.2 MOI. (C) Medium control vs. PolyI:C stimulation. (D) Medium control vs. ssON. (E) Medium control vs. IAV 0.2 MOI with PolyI:C stimulation. (F) Medium control vs. IAV 0.2 MOI with ssON stimulation.
Figure 4
Figure 4
Transcriptional changes after TLR3 activation of IAV infected MoDC. (A–D): MA-plots after RNA sequencing of MoDC samples. Each comparison includes a total of four samples. Genes with adjusted p-value below 0.05 are fully colored (ISG = green, inflammasome = purple, rest = black). (A) IAV 0.02 MOI vs. IAV 0.02 MOI/PolyI:C. (B) IAV 0.02 MOI vs. IAV 0.02 MOI/ssON. (C) IAV 0.2 MOI vs. IAV 0.2 MOI/PolyI:C. (D) IAV 0.2 MOI vs. IAV 0.2 MOI/ssON. (E,F): Volcano-plots after RNA sequencing of MoDC samples. Each comparison includes a total of four samples. The horizontal line is drawn at -log10(p-value) = 0.05 and the vertical lines are drawn at absolute log2foldchange = 1. Genes included in the ISG and flu lists and that pass these thresholds are fully colored (ISG = green, flu = red). (E) IAV 0.2 MOI vs. IAV 0.2 MOI with PolyI:C stimulation. (F) IAV 0.2 MOI vs. IAV 0.2 MOI with ssON stimulation.
Figure 5
Figure 5
Cytokines and IFN secretion in IAV infected MoDC cultures. Culture supernatants were collected 24 h p.i and subjected to ELISA. Statistical analyses performed in comparison with mock infection (Medium) are indicated with a line and calculations made between two groups are depicted with a bar. Mean ±SEM. (A) IL-6 data were from at least seven independent donors. (B) IL-12/23(p40), (C) IL-12(p70), (D) IFN-α, and (E) IL-29 are representative data from at least seven independent donors for the IAV 0.2 MOI-infected and non-infected cultures and from at least three donors analyzed independently for the 0.02 MOI cultures. P-value: not significant (ns) P > 0.05; *P ≤ 0.05; **P ≤ 0.01; ***P ≤ 0.001.
Figure 6
Figure 6
Decreased IAV content in supernatants of ssON treated MoDC cultures. (A) MoDC were treated with or without ssON during 2 h followed by IAV-infection at MOI of 0.2 for 2 h. IAV content was determined by qRT-PCR for the HA gene. Four individual donors were evaluated in triplicates. Wilcoxon paired two-tailed rank test was used ***P < 0.0005. (B) Treatment with ssON added 4 h after infection with IAV also showed a significant impact on the viral content detected in the supernatants. Data from 16 donors analyzed in triplicates. Wilcoxon paired two-tailed rank test was used ****P < 0.0001. (C) IAV content in supernatants at 24 h after infection with MOI of 1 in the absence (white bar) or presence of indicated ssON (sequences in M&M) with PO backbone or different lengths of PS ssON. Data from at least six samples **P ≤ 0.001. (D) MoDC were treated for 45 min at +37°C or +4°C with endocytic uptake markers PolyI:C-Alexa488 in the absence (white bar) or presence of indicated ssON with PO backbone or different lengths of PS ssON. Flow cytometry was used to quantify the fluorescent signal. Data from two donors run in duplicate. (E–H) Confocal microscopy of MoDC stained with a membrane marker, wheat germ agglutinin-Alexa633 (blue) and incubated for 45 min and kept (E) untreated, (F) with PolyI:C-Cy3 at 4°C, (G) PolyI:C-Cy3 at 37°C, and (H) PolyI:C-Cy3 at 37°C in the presence of ssON. Arrow points at uptake of PolyI:C-Cy3 (orange). Data representative of two donors. Scale bar 10 μM.
Figure 7
Figure 7
Reduced IAV load in the lungs of mice after treatment with ssON. BALB/c mice were infected intranasally with IAV. One group were untreated (red circles), a second group received 25 μg of ssON (blue squares) intranasally at the same time as the viral challenge and a third group received an intranasal treatment of 25 μg ssON 3 days post-infection (green triangles). (A) The mice were weighed daily and subsequently sacrificed day 4 after infection. The (B) viral load was measured in the lungs and (C) the TNF-α levels present in the bronchoalveolar lavage (BAL) were measured by ELISA. Statistical calculations were made using one-way ANOVA. Data represent one experiment out of two and data for individual mice are shown in (B,C). P-value: not significant (ns) P > 0.05; *P ≤ 0.05; **P ≤ 0.01; ***P ≤ 0.001.

Similar articles

Cited by

References

    1. Ruuskanen O, Lahti E, Jennings LC, Murdoch DR. Viral pneumonia. Lancet. (2011) 377:1264–75. 10.1016/S0140-6736(10)61459-6 - DOI - PMC - PubMed
    1. Tscherne DM, Garcia-Sastre A. Virulence determinants of pandemic influenza viruses. J Clin Invest. (2011) 121:6–13. 10.1172/JCI44947 - DOI - PMC - PubMed
    1. van de Wakker SI, Fischer MJE, Oosting RS. New drug-strategies to tackle viral-host interactions for the treatment of influenza virus infections. Eur J Pharmacol. (2017) 809:178–90. 10.1016/j.ejphar.2017.05.038 - DOI - PubMed
    1. Jarver P, Dondalska A, Poux C, Sandberg A, Bergenstrahle J, Skold AE, et al. . Single-stranded nucleic acids regulate TLR3/4/7 activation through interference with clathrin-mediated endocytosis. Sci Rep. (2018) 8:15841. 10.1038/s41598-018-33960-4 - DOI - PMC - PubMed
    1. Short KR, Kasper J, van der Aa S, Andeweg AC, Zaaraoui-Boutahar F, Goeijenbier M, et al. . Influenza virus damages the alveolar barrier by disrupting epithelial cell tight junctions. Eur Respir J. (2016) 47:954–66. 10.1183/13993003.01282-2015 - DOI - PubMed

Publication types