. 2019 Sep 13:10:2181.
doi: 10.3389/fimmu.2019.02181. eCollection 2019.

Bacterial RNA Contributes to the Down-Modulation of MHC-II Expression on Monocytes/Macrophages Diminishing CD4+ T Cell Responses

Affiliations

Bacterial RNA Contributes to the Down-Modulation of MHC-II Expression on Monocytes/Macrophages Diminishing CD4+ T Cell Responses

M Ayelén Milillo et al. Front Immunol. .

Abstract

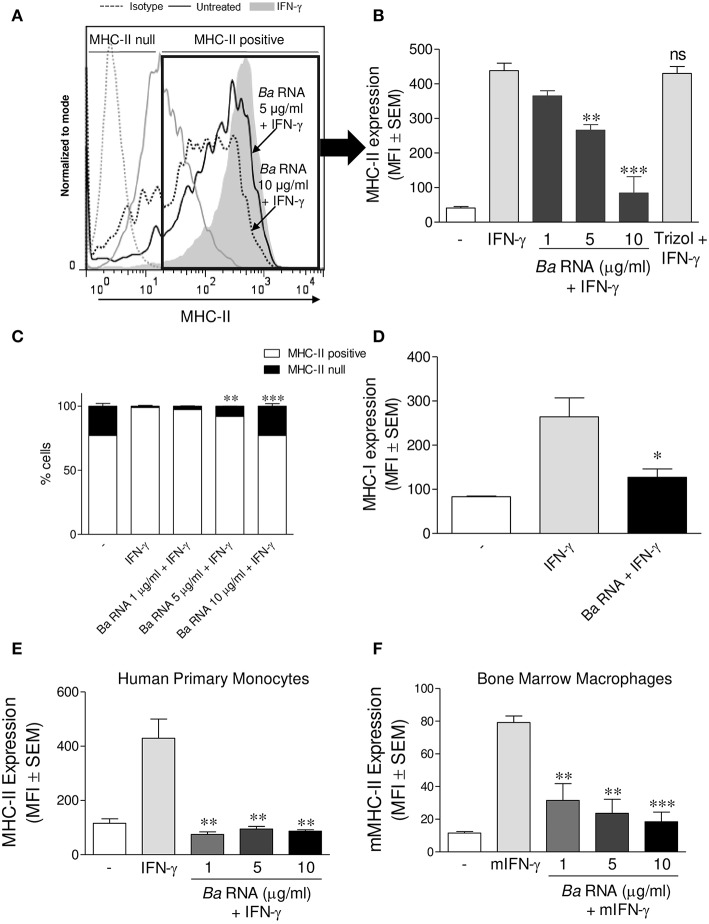
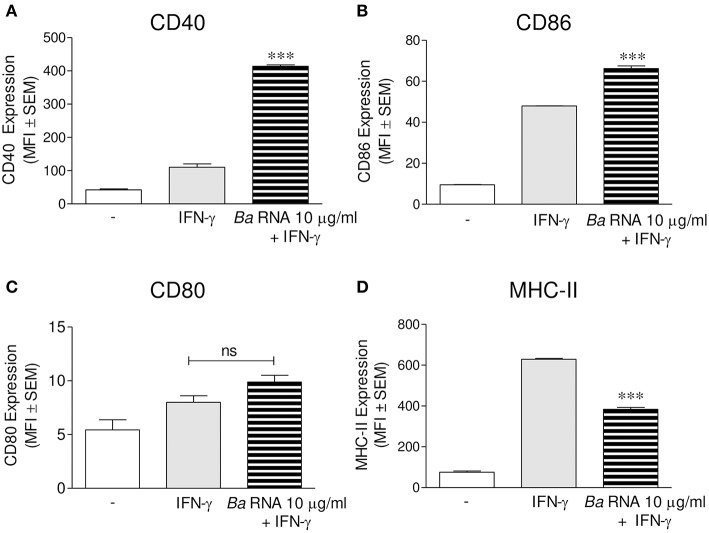
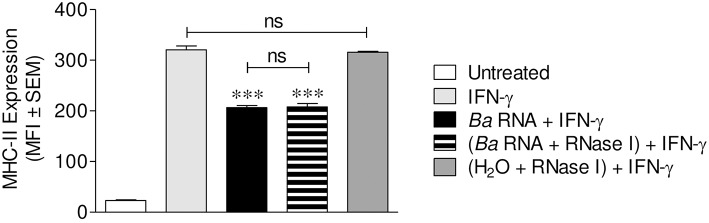
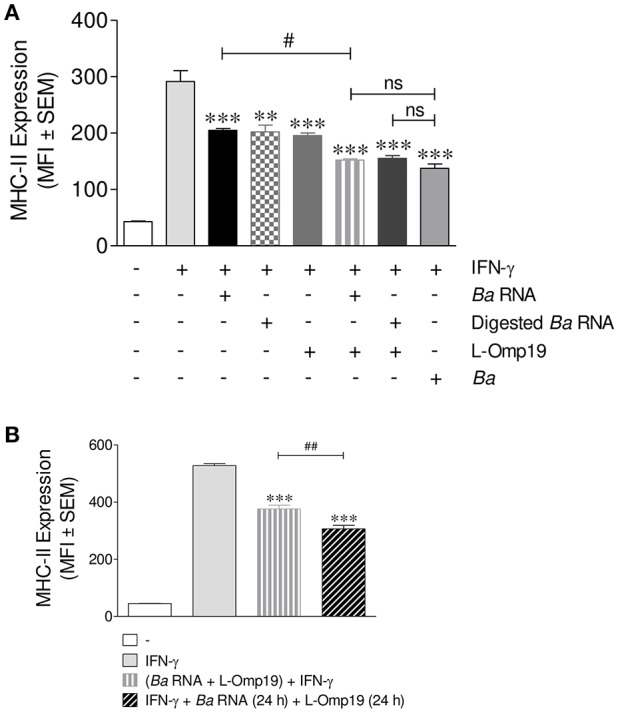
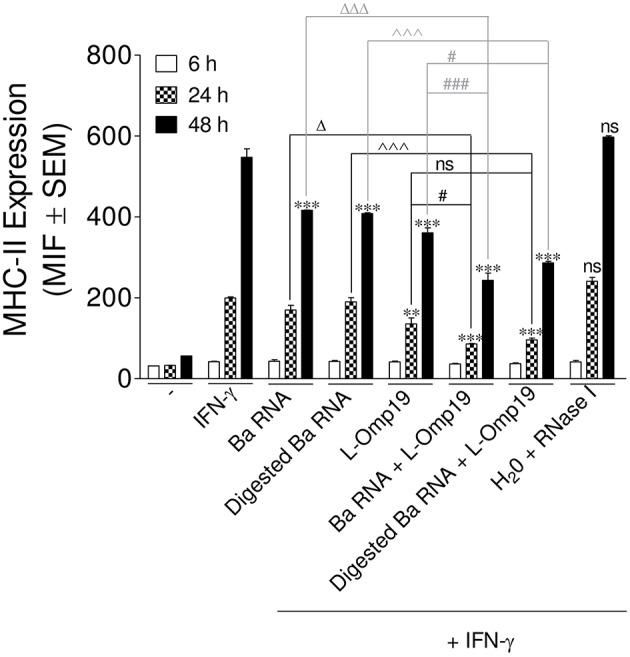
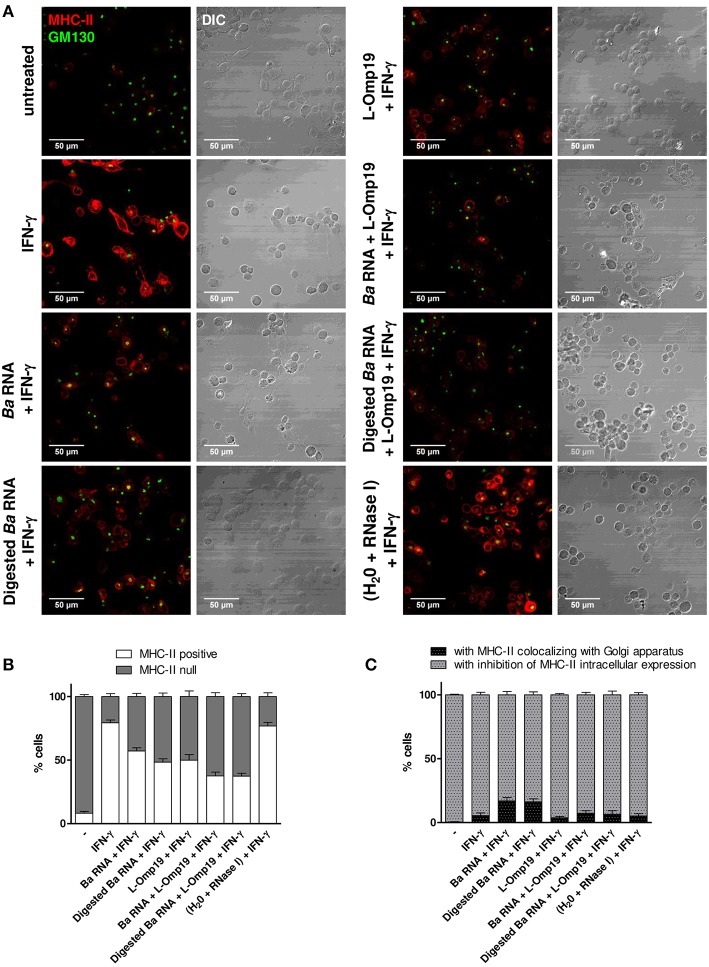
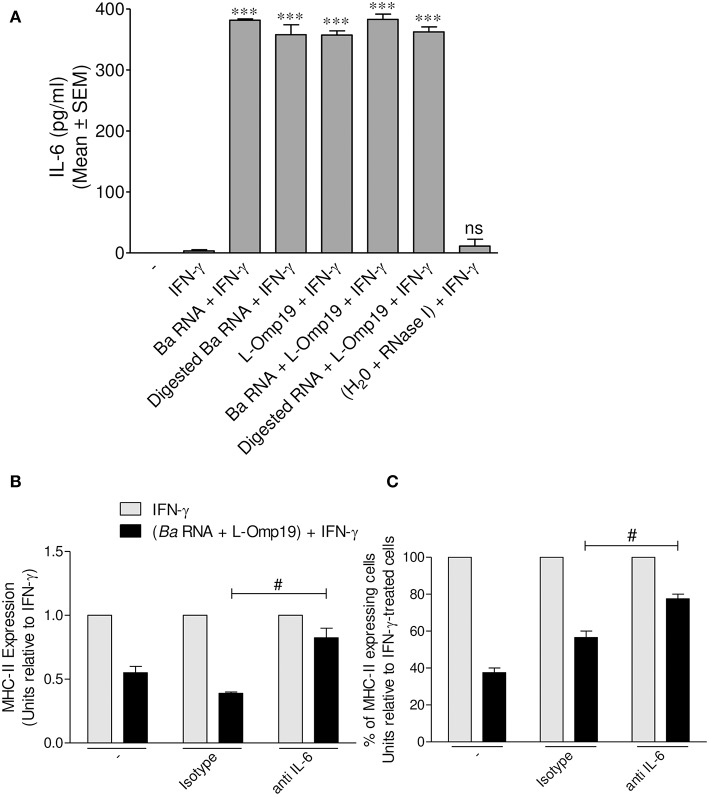
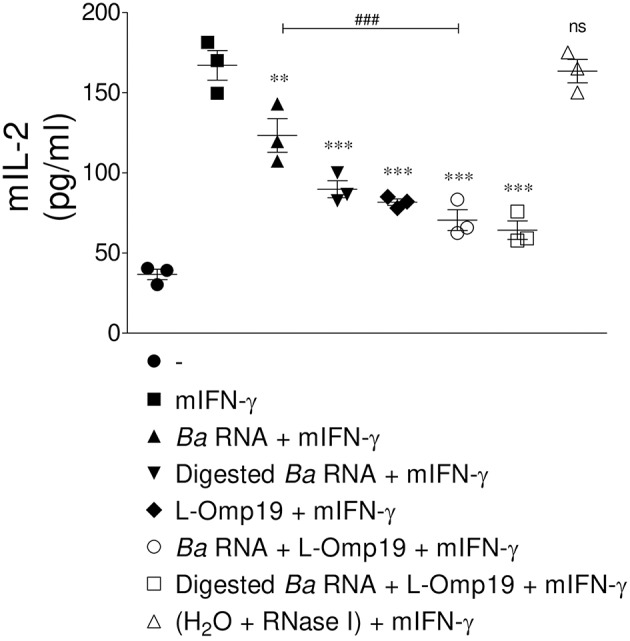
Brucella abortus, the causative agent of brucellosis, displays many resources to evade T cell responses conducive to persist inside the host. Our laboratory has previously showed that infection of human monocytes with B. abortus down-modulates the IFN-γ-induced MHC-II expression. Brucella outer membrane lipoproteins are structural components involved in this phenomenon. Moreover, IL-6 is the soluble factor that mediated MHC-II down-regulation. Yet, the MHC-II down-regulation exerted by lipoproteins was less marked than the one observed as consequence of infection. This led us to postulate that there should be other components associated with viable bacteria that may act together with lipoproteins in order to diminish MHC-II. Our group has recently demonstrated that B. abortus RNA (PAMP related to pathogens' viability or vita-PAMP) is involved in MHC-I down-regulation. Therefore, in this study we investigated if B. abortus RNA could be contributing to the down-regulation of MHC-II. This PAMP significantly down-modulated the IFN-γ-induced MHC-II surface expression on THP-1 cells as well as in primary human monocytes and murine bone marrow macrophages. The expression of other molecules up-regulated by IFN-γ (such as co-stimulatory molecules) was stimulated on monocytes treated with B. abortus RNA. This result shows that this PAMP does not alter all IFN-γ-induced molecules globally. We also showed that other bacterial and parasitic RNAs caused MHC-II surface expression down-modulation indicating that this phenomenon is not restricted to B. abortus. Moreover, completely degraded RNA was also able to reproduce the phenomenon. MHC-II down-regulation on monocytes treated with RNA and L-Omp19 (a prototypical lipoprotein of B. abortus) was more pronounced than in monocytes stimulated with both components separately. We also demonstrated that B. abortus RNA along with its lipoproteins decrease MHC-II surface expression predominantly by a mechanism of inhibition of MHC-II expression. Regarding the signaling pathway, we demonstrated that IL-6 is a soluble factor implicated in B. abortus RNA and lipoproteins-triggered MHC-II surface down-regulation. Finally, CD4+ T cells functionality was affected as macrophages treated with these components showed lower antigen presentation capacity. Therefore, B. abortus RNA and lipoproteins are two PAMPs that contribute to MHC-II down-regulation on monocytes/macrophages diminishing CD4+ T cell responses.

Keywords: Brucella abortus; MHC; antigen presentation/processing; bacterial RNA; monocytes/macrophages.


Figures

Figure 1
Figure 1
B. abortus RNA down-modulates MHC-II on monocytes/macrophages. (A,B) THP-1 cells were treated with different doses of B. abortus RNA in the presence of IFN-γ for 48 h. MHC-II expression was evaluated by flow cytometry. (A) Flow cytometry histograms (showing MHC-II positive and null cells) representative of bars showed in (B). (B) Bars represent the arithmetic means ± SEM of MHC-II positive cells corresponding to five independent experiments. Trizol extracted products in the absence of bacteria were used as a control. (C) Quantification of cells expressing MHC-II (MHC-II positive cells) or not (MHC-II null). Data is expressed as the percentage of cells ± SEM of three independent experiments. (D) THP-1 cells were treated with B. abortus RNA (10 μg/ml) in the presence of IFN-γ for 48 h. MHC-I expression was evaluated by flow cytometry. (E,F) Peripheral blood-purified monocytes (E) and bone marrow macrophages (F) were stimulated with different doses of B. abortus RNA in the presence of IFN-γ for 48 h. MHC-II expression was assessed by flow cytometry. Bars represent the arithmetic means ± SEM of five independent experiments. MFI, mean fluorescence intensity; mIFN-γ, murine IFN-γ. ns, non-significant. *P < 0.05; **P < 0.01; ***P < 0.001 vs. IFN-γ-treated cells.
Figure 2
Figure 2
B. abortus RNA does not down-modulate co-stimulatory molecules. (A–D) THP-1 cells were treated with B. abortus RNA (10 μg/ml) in the presence of IFN-γ for 48 h. CD40 (A), CD86 (B), and CD80 (C) expressions were assessed by flow cytometry. MHC-II expression was determined as a control (D). Bars represent the arithmetic means ± SEM of five independent experiments. MFI, mean fluorescence intensity; ns, non-significant. ***P < 0.001 vs. IFN-γ-treated cells.
Figure 3
Figure 3
MHC-II down-modulation could be extended to RNAs from different microorganisms. (A) THP-1 cells were treated with RNAs from K. pneumoniae, S. aureus, E. coli, and T. cruzi (10 μg/ml) in the presence of IFN-γ for 48 h. (B) THP-1 cells were treated with different doses of PBMCs RNA in the presence of IFN-γ for 48 h. B. abortus RNA (10 μg/ml)-treated cells were used as a control. MHC-II expression was assessed by flow cytometry. Bars represent the arithmetic means ± SEM of five independent experiments. MFI, mean fluorescence intensity. **P < 0.01; ***P < 0.001 vs. IFN-γ-treated cells.
Figure 4
Figure 4
Digested-B. abortus RNA is also able to down-modulate MHC-II. THP-1 cells were treated with B. abortus RNA (10 μg/ml) or RNase I-treated B. abortus RNA in the presence of IFN-γ for 48 h. Cells treated with RNase I were used as a control. MHC-II expression was assessed by flow cytometry. Bars represent the arithmetic means ± SEM of five independent experiments. MFI, mean fluorescence intensity; ns, non-significant. ***P < 0.001 vs. IFN-γ-treated cells.
Figure 5
Figure 5
B. abortus RNA and B. abortus L-Omp19 act synergistically in MHC-II inhibition. (A) THP-1 cells were infected with B. abortus (MOI 100:1) or treated with B. abortus RNA (10 μg/ml), digested B. abortus RNA, L-Omp19 (1 μg/ml) or their combination in the presence of IFN-γ for 48 h. (B) THP-1 cells were treated with IFN-γ and B. abortus RNA (5 μg/ml) for 24 h. Afterwards, L-Omp19 (1 μg/ml) was added for other 24 h. THP-1 cells treated with both stimuli simultaneously were used as control. MHC-II expression was assessed by flow cytometry. Bars represent the arithmetic means ± SEM of five independent experiments. MFI, mean fluorescence intensity; ns, non-significant. **P < 0.05; ***P < 0.001 vs. IFN-γ-treated cells; #P < 0.05 vs. Ba RNA + IFN-γ; ##P < 0.01 vs. (Ba RNA + L-Omp19) + IFN-γ.
Figure 6
Figure 6
MHC-II down-modulation begins after 24 h post-stimuli. THP-1 cells were treated with B. abortus RNA (10 μg/ml), digested B. abortus RNA, L-Omp19 (1 μg/ml) or their combination in the presence of IFN-γ for 6, 24, and 48 h. Cells treated with RNase I were used as a control. MHC-II expression was assessed by flow cytometry. Bars represent the arithmetic means ± SEM of five independent experiments. MFI, mean fluorescence intensity; ns, non-significant. **P < 0.01; ***P < 0.001 vs. IFN-γ-treated cells; ΔP < 0.05; ΔΔΔP < 0.001 vs. Ba RNA; ∧∧∧P < 0.001 vs. Digested Ba RNA; #P < 0.05; ###P < 0.001 vs. L-Omp19.
Figure 7
Figure 7
B. abortus RNA and digested B. abortus RNA inhibit MHC-II expression on and inside the cells. (A) Confocal micrographs of THP-1 cells treated with B. abortus RNA (10 μg/ml), digested B. abortus RNA, L-Omp19 (1 μg/ml) or their combination in the presence of IFN-γ for 48 h. Cells treated with RNase I were used as a control. MHC-II was detected with a primary anti-human MHC-II Ab (L243) followed by Alexa 546-labeled secondary Ab (red). Golgi apparatus was detected using a mAb specific for GM130 followed by Alexa 488-labeled secondary Ab (green). Results are representative of three independent experiments. (B) Quantification of cells expressing MHC-II (MHC-II positive cells) or not (MHC-II null). Data is expressed as the percentage of cells ± SEM of three independent experiments. (C) Quantification of null cells with MHC-II colocalizing with Golgi apparatus or with inhibition of intracellular MHC-II expression. Data is expressed as the percentage of cells ± SEM of three independent experiments. The number of cells counted per experimental group was 200. DIC, differential interference contrast.
Figure 8
Figure 8
IL-6 is a soluble mediator involved in B. abortus RNA and L-Omp19-mediated MHC-II down-modulation. (A) THP-1 cells were treated with B. abortus RNA (10 μg/ml), digested B. abortus RNA, L-Omp19 (1 μg/ml) or their combination in the presence of IFN-γ for 48 h. Then, supernatants were harvested and IL-6 secretion was quantified by ELISA sandwich. (B,C) THP-1 cells were treated with B. abortus RNA (10 μg/ml) and L-Omp19 (1 μg/ml) in the presence of IFN-γ and in the presence of neutralizing anti-IL-6 or its isotype control for 48 h. MHC-II expression was assessed by flow cytometry. (B) Bars represent the arithmetic means ± SEM of MHC-II positive cells corresponding to three independent experiments. (C) Quantification of cells expressing MHC-II (MHC-II positive cells). Data is expressed as the percentage of cells relative to IFN-γ ± SEM of three independent experiments. MFI, mean fluorescence intensity; ns, non-significant. ***P < 0.001 vs. IFN-γ-treated cells; #P < 0.05 vs. isotype control.
Figure 9
Figure 9
MHC-II down-modulation correlates with diminished antigen presentation to CD4+ T cells. BMM were treated with B. abortus RNA (10 μg/ml), digested B. abortus RNA, L-Omp19 (1 μg/ml) or their combination in the presence of mIFN-γ for 48 h. Then, cells were washed and incubated with 100 μg/ml of OVA peptide for 3 h at 37°C. Afterwards, cells were washed and co-cultured for 20 h at 37°C with BO97.10 cells, a T cell hybridoma specific for OVA peptide. T cell activation was measured by quantifying mIL-2 secretion in culture supernatants. **P < 0.01; ***P < 0.001 vs. mIFN-γ-treated cells; ns, non-significant; ###P < 0.001 vs. Ba RNA.

Similar articles

Cited by

References

    1. Celli J, de Chastellier C, Franchini DM, Pizarro-Cerda J, Moreno E, Gorvel JP. Brucella evades macrophage killing via VirB-dependent sustained interactions with the endoplasmic reticulum. J Exp Med. (2003) 198:545–56. 10.1084/jem.20030088 - DOI - PMC - PubMed
    1. Starr T, Ng TW, Wehrly TD, Knodler LA, Celli J. Brucella intracellular replication requires trafficking through the late endosomal/lysosomal compartment. Traffic. (2008) 9:678–94. 10.1111/j.1600-0854.2008.00718.x - DOI - PubMed
    1. Gorvel JP, Moreno E. Brucella intracellular life: from invasion to intracellular replication. Vet Microbiol. (2002) 90:281–97. 10.1016/S0378-1135(02)00214-6 - DOI - PubMed
    1. Roop RM, II, Bellaire BH, Valderas MW, Cardelli JA. Adaptation of the brucellae to their intracellular niche. Mol Microbiol. (2004) 52:621–30. 10.1111/j.1365-2958.2004.04017.x - DOI - PubMed
    1. Starr T, Child R, Wehrly TD, Hansen B, Hwang S, Lopez-Otin C, et al. . Selective subversion of autophagy complexes facilitates completion of the Brucella intracellular cycle. Cell Host Microbe. (2012) 11:33–45. 10.1016/j.chom.2011.12.002 - DOI - PMC - PubMed

Publication types

MeSH terms