Light Modulates Ethylene Synthesis, Signaling, and Downstream Transcriptional Networks to Control Plant Development
- PMID: 31572414
- PMCID: PMC6751313
- DOI: 10.3389/fpls.2019.01094
Light Modulates Ethylene Synthesis, Signaling, and Downstream Transcriptional Networks to Control Plant Development
Abstract
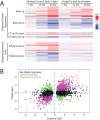
The inhibition of hypocotyl elongation by ethylene in dark-grown seedlings was the basis of elegant screens that identified ethylene-insensitive Arabidopsis mutants, which remained tall even when treated with high concentrations of ethylene. This simple approach proved invaluable for identification and molecular characterization of major players in the ethylene signaling and response pathway, including receptors and downstream signaling proteins, as well as transcription factors that mediate the extensive transcriptional remodeling observed in response to elevated ethylene. However, the dark-adapted early developmental stage used in these experiments represents only a small segment of a plant's life cycle. After a seedling's emergence from the soil, light signaling pathways elicit a switch in developmental programming and the hormonal circuitry that controls it. Accordingly, ethylene levels and responses diverge under these different environmental conditions. In this review, we compare and contrast ethylene synthesis, perception, and response in light and dark contexts, including the molecular mechanisms linking light responses to ethylene biology. One powerful method to identify similarities and differences in these important regulatory processes is through comparison of transcriptomic datasets resulting from manipulation of ethylene levels or signaling under varying light conditions. We performed a meta-analysis of multiple transcriptomic datasets to uncover transcriptional responses to ethylene that are both light-dependent and light-independent. We identified a core set of 139 transcripts with robust and consistent responses to elevated ethylene across three root-specific datasets. This "gold standard" group of ethylene-regulated transcripts includes mRNAs encoding numerous proteins that function in ethylene signaling and synthesis, but also reveals a number of previously uncharacterized gene products that may contribute to ethylene response phenotypes. Understanding these light-dependent differences in ethylene signaling and synthesis will provide greater insight into the roles of ethylene in growth and development across the entire plant life cycle.
Keywords: ethylene; ethylene biosynthesis; ethylene response; hypocotyl; light; root; transcriptomic meta-analysis.
Copyright © 2019 Harkey, Yoon, Seo, DeLong and Muday.
Figures


Similar articles
-
Integration of Ethylene and Light Signaling Affects Hypocotyl Growth in Arabidopsis.Front Plant Sci. 2017 Jan 24;8:57. doi: 10.3389/fpls.2017.00057. eCollection 2017. Front Plant Sci. 2017. PMID: 28174592 Free PMC article. Review.
-
Light-induced stabilization of ACS contributes to hypocotyl elongation during the dark-to-light transition in Arabidopsis seedlings.Plant J. 2019 Jun;98(5):898-911. doi: 10.1111/tpj.14289. Epub 2019 Mar 27. Plant J. 2019. PMID: 30776167
-
The Effects of Cytokinin and Light on Hypocotyl Elongation in Arabidopsis Seedlings Are Independent and Additive.Plant Physiol. 1995 Aug;108(4):1423-1430. doi: 10.1104/pp.108.4.1423. Plant Physiol. 1995. PMID: 12228552 Free PMC article.
-
RCN1-regulated phosphatase activity and EIN2 modulate hypocotyl gravitropism by a mechanism that does not require ethylene signaling.Plant Physiol. 2006 Aug;141(4):1617-29. doi: 10.1104/pp.106.083212. Epub 2006 Jun 23. Plant Physiol. 2006. PMID: 16798939 Free PMC article.
-
Recent advances in ethylene research.J Exp Bot. 2009;60(12):3311-36. doi: 10.1093/jxb/erp204. Epub 2009 Jun 30. J Exp Bot. 2009. PMID: 19567479 Review.
Cited by
-
Supplemental Blue Light Frequencies Improve Ripening and Nutritional Qualities of Tomato Fruits.Front Plant Sci. 2022 Jun 9;13:888976. doi: 10.3389/fpls.2022.888976. eCollection 2022. Front Plant Sci. 2022. PMID: 35755648 Free PMC article.
-
Editorial: Physiological, Molecular and Genetic Perspectives of Chilling Tolerance in Horticultural Crops.Front Plant Sci. 2020 Dec 10;11:602144. doi: 10.3389/fpls.2020.602144. eCollection 2020. Front Plant Sci. 2020. PMID: 33362833 Free PMC article. No abstract available.
-
Light regulates seed dormancy through FHY3-mediated activation of ACC OXIDASE 1 in Arabidopsis.Plant Mol Biol. 2025 Mar 13;115(2):44. doi: 10.1007/s11103-025-01559-9. Plant Mol Biol. 2025. PMID: 40082285
-
Activation of Local and Systemic Defence Responses by Flg22 Is Dependent on Daytime and Ethylene in Intact Tomato Plants.Int J Mol Sci. 2021 Aug 3;22(15):8354. doi: 10.3390/ijms22158354. Int J Mol Sci. 2021. PMID: 34361121 Free PMC article.
-
To Fight or to Grow: The Balancing Role of Ethylene in Plant Abiotic Stress Responses.Plants (Basel). 2021 Dec 23;11(1):33. doi: 10.3390/plants11010033. Plants (Basel). 2021. PMID: 35009037 Free PMC article. Review.
References
Publication types
LinkOut - more resources
Full Text Sources

