Review
. 2019 Sep 12:7:217.
doi: 10.3389/fbioe.2019.00217. eCollection 2019.

Addressing Patient Specificity in the Engineering of Tumor Models

Affiliations
Review

Addressing Patient Specificity in the Engineering of Tumor Models

Laura J Bray et al. Front Bioeng Biotechnol. .

Abstract

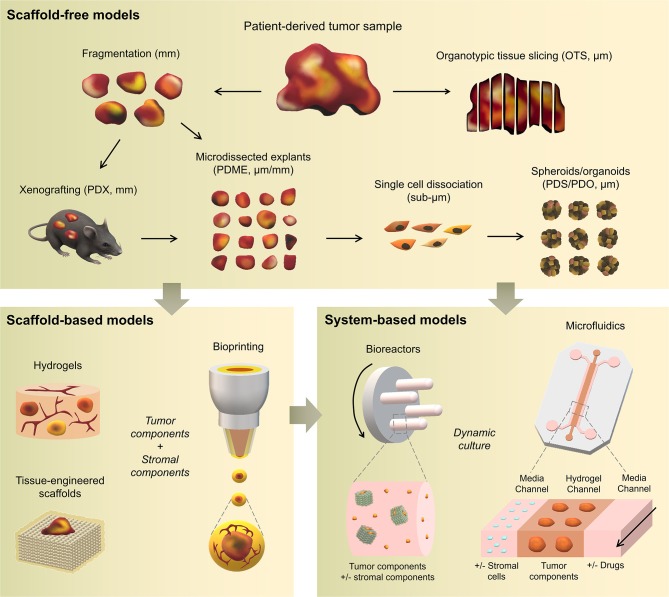
Cancer treatment is challenged by the heterogeneous nature of cancer, where prognosis depends on tumor type and disease stage, as well as previous treatments. Optimal patient stratification is critical for the development and validation of effective treatments, yet pre-clinical model systems are lacking in the delivery of effective individualized platforms that reflect distinct patient-specific clinical situations. Advances in cancer cell biology, biofabrication, and microengineering technologies have led to the development of more complex in vitro three-dimensional (3D) models to act as drug testing platforms and to elucidate novel cancer mechanisms. Mostly, these strategies have enabled researchers to account for the tumor microenvironment context including tumor-stroma interactions, a key factor of heterogeneity that affects both progression and therapeutic resistance. This is aided by state-of-the-art biomaterials and tissue engineering technologies, coupled with reproducible and high-throughput platforms that enable modeling of relevant physical and chemical factors. Yet, the translation of these models and technologies has been impaired by neglecting to incorporate patient-derived cells or tissues, and largely focusing on immortalized cell lines instead, contributing to drug failure rates. While this is a necessary step to establish and validate new models, a paradigm shift is needed to enable the systematic inclusion of patient-derived materials in the design and use of such models. In this review, we first present an overview of the components responsible for heterogeneity in different tumor microenvironments. Next, we introduce the state-of-the-art of current in vitro 3D cancer models employing patient-derived materials in traditional scaffold-free approaches, followed by novel bioengineered scaffold-based approaches, and further supported by dynamic systems such as bioreactors, microfluidics, and tumor-on-a-chip devices. We critically discuss the challenges and clinical prospects of models that have succeeded in providing clinical relevance and impact, and present emerging concepts of novel cancer model systems that are addressing patient specificity, the next frontier to be tackled by the field.

Keywords: 3D tumor models; hydrogels; microfluidics; patient-derived; primary cells; tissue engineering; tumor heterogeneity; tumor microenvironment.


Figures

Figure 1
Figure 1
Overview of cancer heterogeneity types. (A) Tumors vary according to the characteristics of patients and location in the body, along with time and treatments. (B) Local heterogeneity arises from genetic/epigenetic intrinsic factors, stromal extrinsic factors, and chemical/physical factors, which, combined, contribute to the complexity of tumor microenvironments.
Figure 2
Figure 2
Overview of patient-specific tumor models. Traditionally used with no matrix or simple natural matrices, and mainly for drug testing purposes, patient-derived materials are now used in combination with scaffold-based biomaterials, allowing the incorporation of stromal components to better mimic the native microenvironment or to study a specific process (angiogenesis, metastasis). Both approaches are also being used with dynamic systems to; further mimic/test physical and chemical gradients, better control the addition of stromal components, increase viability, and enable multiple drug testing.
Figure 3
Figure 3
Patient-derived organoids/spheroids (PDO/PDS). (A) Schematic diagram displaying the key techniques utilized in current literature for the culture of PDO and PDS. Left, ultra-low attachment (ULA) plates; Center, hanging drop method; Right, natural hydrogels. (B) Primary head and neck cancer cells can form consistent spheroids in ULA plates (left), but are not as reproducible in hanging drop culture (right) as visualized using phase contrast microscopy. (C) Phase contrast image of a colorectal cancer PDO cultured in Matrigel, and (D) hematoxylin and eosin staining comparing PDOs to their matching patient biopsy sample. (E–H) PDOs recapitulate intra- and interpatient heterogeneity in response to chemotherapeutics (TAS-102). (E) Spheroids were established from a patient with mixed response to TAS-102 with multiple metastases. (F) While the segment 2 metastasis rapidly progressed, the segment 5 metastasis remained stable upon TAS-102 treatment. (G) Thymidine kinase 1 (TK1) IHC expression is stronger in TAS-102-, compared to sensitive (segment 5) PDOs TAS-102-refractory (segment 2). BL, Core biopsy (baseline); PD, post-treatment (progressive disease). (H) There was no significant decrease in cell viability in PDOs in response to TAS-102 in resistant patients. (I,J) Diversity of sensitivities for drugs among colorectal cancer tissue-PDX spheroids assessed via high throughput screening. (I) Morphological changes after treatment with 100 nmol/L of carfilzomib. (J) Heat map and clustering analysis of the average IC50 of 15 drugs in the panel. (B,C–J) reproduced with permission from Hagemann et al. (2017), Vlachogiannis et al. (2018), and Kondo et al. (2018), respectively.
Figure 4
Figure 4
Hydrogel culture approaches. (A–C) Rationally designed 3D hydrogels model normal and malignant lung tissue. (A) Schematic of potential cell invasion mechanisms. (B) Schematic of the composition of biomimetic stimuli-responsive 3D hyaluronan (HA) hydrogels. (C) Lung cancer cells express CD44 and show varying invasiveness into 3D HA hydrogels. (A–I) Primary cells isolated and cultured from three separate lung carcinoma biopsies identified as (A–C) adenocarcinoma, (D–F) squamous cell carcinoma, and (G–I) neuroendocrine tumor. (J–L) Non-small cell lung cancer and (M–O) small cell lung cancer cells. (P–R) Healthy human bronchial epithelial control cells do not invade into 3D hydrogels. (A,D,G,J,M) Lung cancer cells express CD44, while (P) healthy bronchial epithelial cells do not. (D–H) Combination approach to mimicking glioblastoma using PDX derived cell lines. (D) Schematic of hydrogel/microfiber structure and cellular combinations. (E) Cross-sectional views of encapsulated alginate microfibers in 3D hydrogels. Left = side view. Right = top view. Red = hydrogel edge. Scale bar = 2 mm. (F) Live (green) and dead (red) staining of endothelial cells after 7 days in cultures. (G) Co-culture with mouse endothelial cells increased glioblastoma proliferation via Ki67 staining (n = 150) (left), and increased expression of CXCR4 in glioblastoma tumor cells (right). *p < 0.05. (H) Confocal image demonstrating CD31 expression from HUVECs within alginate microfibres. (I–K) 3D culture of acute myeloid leukemia using starPEG-heparin hydrogels. (I) AML cells from a patient with AML untreated (left) or treated with 2.5 μg/mL AMD3100 (right), co-cultured with HUVECs and MSCs. (J) Percentage of AML contact with HUVECs and MSCs decreased after AMD3100 treatment in two out of three donors, compared with the untreated control sample. Means ± SD (variability within experiment, n = 1). (K) A biohybrid starPEG-heparin hydrogel for the culture of AML mono-cultures and tri-cultures with HUVECs and bone marrow-derived MSCs. Scale bar = 5 mm. (A–K) reproduced with permission from Tam et al. (2018), Wang et al. (2019), and Bray et al. (2017), respectively.
Figure 5
Figure 5
Tissue-engineered model approaches combining scaffolds, patient-derived materials, and primary cells. (A–I) prostate cancer (PCa) PDX osteomimicry when co-cultured with a patient-derived mineralized microtissue scaffold. (A) Schematic of melt electrowriting of medical grade polycaprolactone (mPCL) into a porous tubular microfiber scaffold. (B) SEM images of mPCL scaffold after calcium phosphate treatment to induce osteogenic properties. (C) Scaffold seeding with patient-derived osteoprogenitor cells, cultured for 12 weeks under osteogenic differentiation leading to a human osteoblast-derived tissue engineered construct (hOTEC), followed by co-culture with PDX for 3 weeks. (D) Mineralization differences in hOTECs according to patients. (E) Micro-computed tomography image of bone metastasis-derived PCa PDX (BM18) in co-culture with hOTEC shows high mineralization of both hOTEC and PDX mass after 3 weeks (Mean ± SE). (F) Photographs of BM18 PDX, cultured either alone or co-cultured with hOTEC at day 0 and after 3 weeks of culture. (G) Mineralization quantification from von Kossa staining inside PDX, shows that BM18 became more mineralized than lymph node-derived PCa PDX (LuCaP35) and endometrial cancer metastasis-derived PDX (20REC), in the presence of hOTEC. (H) Von Kossa staining shows strong mineralization in PCa PDXs (BM18 and LuCaP35) but no mineralization in the control endometrial PDX (20REC). (I) NuMA staining in BM18 PDX shows a majority of human cells (>75%, red arrows = human, yellow arrows = mouse). (J–M) PCa PDX-derived cells growth in a bone mimetic environment (BME). (J) Process schematic; PCa PDX (MDA PCa 118b and 183) were extracted from mice, dissociated in single cells, and transfected with mCherry lentivirus prior to co-culture on an osteoblast-derived microtissue made from melt electrowritten mPCL porous scaffolds populated with immortalized human MSCs differentiated into osteoblasts (dhMSCs) for 30 days prior to co-culture. (K) Multiphoton microscopy of tumor cells co-cultured with dhMSC scaffolds. (L) Growth areas of tumor cells on scaffolds ± dhMSCs shows no survival without dhMSCs and increase in the presence of dhMSCs. (M) Histology of MDA PCa 118b and MDA PCa 183 in bone and BME. Yellow and black dashed lines outline the tumor areas. (A–M) reproduced with permission from Shokoohmand et al. (2019) and Paindelli et al. (2019), respectively. ****P < 0.0001.
Figure 6
Figure 6
Bioprinting with patient-derived materials and primary cells. (A–G) Bioprinted tissues from pancreatic patient-derived xenograft PDX-derived materials surrounding by a mixture of primary stellate cells (PSCs) and human umbilical vein endothelial cells (HUVECs) and comparison with original tissue. (A) Schematic of bioprint structure and photographs of bioprints in normal tissue culture plates. (B) Photograph of individual bioprint. (C,D) Low and high magnification of immunofluorescence (IF) images of bioprints from PDX-derived cell line after 7 days in culture, showing KRT8/18 (cancer cells) in green, vimentin (VIM, stroma) in red and CD31 (vasculature) in yellow, and DAPI (nuclei) in blue. (E) IF for KRT8/18 (green), pS6 (red), and DAPI (blue) of OPTR3099-PDX-Bioprint tissue (PSCs and HUVECs in the stromal compartment with disassociated PDX tumor tissue generated from OPTR3099 in the cancer compartment), primary patient tissue from OPTR3099, and PDX tumor tissue generated from OPTR3099 (OPTR3099-PDX). (F) Similar tissue to (E), except that IF is for KRT8/18 (green), VIM (red), Ki67 (blue), and DAPI (gray). (G) Ki67+ quantification of the percentage of Ki67+/KRT8/18+ dual positive cells shown in (F), n = 3 random fields of view, N = 1 PDX bioprint. (H,I) Bioprinted breast cancer bone metastasis model. (H) Schematic of primary mesenchymal or osteoblast cell line-laden GelMa-based 3D bioprint from stereolithography and further co-culture with breast cancer cell lines. Four groups were used, containing either 10 or 15% GelMA ± nanohydroxyapatite powder (nHA). Insert shows CAD model of the 3D matrix (gray) and 3D surface plot of the bioprinted matrix (colored image). (I) Confocal micrographs of mesenchymal stem cells (MSCs)-laden 3D bioprints 1 day post printing (cross-sectional views) for each bioprint group. Live (green) and dead (red) cells. Over 75% of cells were dead after bioprinting. (J,K) Bioprinted primary breast cancer model. (J) 21PT breast cancer line cells were first bioprinted in a photocrosslinkable gel followed by printing hydrogels of primary adipose derived MSCs (ADMSCs) around the cancer cell gel, with various thicknesses. ADMSCs in the edge region were labeled by cell tracker red, and 21PT in the middle region were labeled by cell tracker green (fluorescence images). (K) qPCR analysis of adenosine triphosphate (ATP)-binding cassette transporter gene expression of the bioprinted constructs with and without the lysyl oxidase (LOX) inhibitor, n = 3. (L–P) Glioblastoma tumor-initiating cells (TICs) culture in alginate hydrogel tubes (AlgTubes). (L) Images of extrusion system. (M) Schematic of AlgTubes production. (N) TIC growth in AlgTubes. Scale bar: 200 μm. (O) Live/dead staining of day 7 cells in AlgTubes. Scale bar: 400 μm. (P) In vitro differentiation of TICs after 10 passages. Scale bar: 100 μm. (A–P) reproduced with permission from Zhou et al. (2016), Wang et al. (2018b), Langer et al. (2019) and Li et al. (2018b), respectively.
Figure 7
Figure 7
Bioreactor systems with patient-derived materials and/or primary cells. (A) Generation of a 3D multiple myeloma (MM) microenvironment in a rotary cell culture system (RCCSTM) bioreactor; scaffold is pre-seeded in vitro with bone marrow stromal cells (BM-MSCs)/endothelial cells (HUVECs) and transferred to the RCCS bioreactor. MM cells are then added and cultured dynamically up to 7 days. IHC shows uniform distribution of CD138+ MM cells and CD73+ stroma. Scale = 100 μm. (B) Schematic representation of the experimental design. For perfused cultures, colorectal cancer specimens (n = 3/bioreactor) were placed between two collagen type I discs within a ring-shaped holder, restrained by two grids on the top and bottom. The holder was then inserted in the bioreactor chamber and subjected to continuous alternate perfusion. (C) Immunostaining shows architectures and protein expression in perfused tissues similar to fresh tissues [EpCAM (red), vimentin (green), DAPI (blue)]. (D) Percentages of proliferative (Ki67+) and apoptotic (cC3+) cells in perfused cultures supplemented with 5-FU relative to untreated tissues for tissues from 6 individual patients, showing high heterogeneity in response. (E–G) A prototype bioreactor for scalable glioblastoma tumor-initiating cells (TIC) production in alginate tubes (AlgTubes). (E) The bioreactor contains a cylindrical container and a plastic bellow bottle, which are separated by a nylon mesh. AlgTubes with TICs are suspended in the cylindrical container and the medium is stored in the plastic bellow bottle that can be pressed to flow the medium into, or released to withdraw the medium from the container. The mechanic stage is used to press and release the bellow bottle. The controller can be programmed for the pressing and releasing speed, as well as the duration of the interval between the pressing and releasing. (F) Fold-expansion of glioblastoma TICs cultured in AlgTubes, 2D, static 3D, and dynamic 3D suspension. (G) Image of glioblastoma TICs harvested from the bioreactor on day 10. (A–G) reproduced with permission from Belloni et al. (2018), Manfredonia et al. (2019) and Li et al. (2018b), respectively. #P < 0.05.
Figure 8
Figure 8
Microfluidic systems using patient-derived materials for chemotherapy (A–G) and immunotherapy (H,I). (A) Top: schematic of a patient-derived tumor explant, microdissected, loaded in a microfluidic device and injected with various drugs. Results are then interpreted to identify non-responders to treatment for a personalized treatment strategy. Bottom: photograph of tumor prior and after microdissection in 500 μm-PDMEs and design of the microfluidic device containing up to 5 chambers for PDME entrapment and drug testing. (B) PDMEs from various patients and different cancers are analyzed by live/dead cell assay using confocal microscopy (green = live, red = dead), showing various PDME architectures and viability patterns. (C) PDMEs from an ovarian tumor treated with carboplatin shows high heterogeneity in PDME structure and viability response for PDME originating from the same tumor. (D) Corresponding graphs of viability data from (B) (top) and (C) (bottom) compared to non-treated controls show inter-cancer tumor heterogeneity and drug efficacy on PDMEs from one tumor, despite intra-tumor heterogeneity observed in (C). (E) Microfluidic device enabling in situ spheroid patterning technique: a microfluidic chamber (i) is filled with a mixture (blue) containing hydrogel precursors, photoinitiator, and patient-derived tumor cells (ii) and then illuminated with UV light through a photomask (gray) (iii). Exposed precursor is crosslinked into a hydrogel (dark blue), detaining cells within the region (iv), and non-crosslinked gel is flushed form the chamber with clean saline from the chamber (v). Finally, saline is replaced with media (red) (vi) for incubation. (F) Schematic of system that offers low volumes and closed loop fluidic circuit controlled by a computer-controlled peristatic pump to treated individual organoids. (G) In vitro chemotherapy assessment of organoids derived from two patients with mesothelioma treated with various drug doses and combinations shows different response between patients, although treatment occurred at different times between patients (viability measured from live/dead confocal microscopy on organoids). (H) Schematic of PDMEs obtained after dissection and sieving. Fraction 2 (40–100 μm) is usually used in microfluidic devices such as the 3D cell culture chip from AIM Biotech shown, which contains a center gel region. Gel loading port and media ports labeled (B), along with center and side channels (C). (I) The AIM Biotech microfluidic device was used by Wang et al. to test a selective RIP1 inhibitor on pancreatic ductal adenocarcinoma PDMEs. After RIP1i treatment (n = 5 patients shown), PDME live/dead ratio, and size decreased. (A–I) reproduced with permission from Astolfi et al. (2016), Aref et al. (2018), Mazzocchi et al. (2018), and Wang et al. (2018a), respectively. (D) Top: **Result for PDMEs stained and imaged a second time; Bottom: *p-value = 0.014. (G) *p < 0.05, **p < 0.01. (I) *p < 0.05.
Figure 9
Figure 9
Tumor-on-chip systems. (A) Diagram illustrating the processing steps involved in the preparation of patient-derived tumor cells and tumor-infiltrating lymphocytes (TILs) from the same tumor sample, and live imaging by confocal microscope. (B) 12-channel multiplexed cyclic-olefin-copolymer (COC)-based microfluidic device with V-trap design for capturing tumor sample in flow stream and dual port entry for TILs. (C) A 3D multicellular tumor microenvironment microfluidic model consisting of a middle hydrogel channel (2) surrounded by two media channels (1, 3) for the mechanistic study of the effect of monocytes on T cell receptor-redirected T cell (TCR T cell) killing of tumor cell aggregates. Human monocytes were inserted together with target HepG2-preS1-GFP cell organoids in collagen gel in the central hydrogel region (2), while hepatitis B virus (HBV)-specific TCR T cells were added into one fluidic channel (1) to mimic the intrahepatic carcinoma environment. (D) Representative confocal image of a target cell organoid (in green) surrounded by monocytes (in blue) and HBV-specific TCR T cells (in white), in which the presence of dead target cells is DRAQ7+. (E) Left: Representative target cell HepG2 cell organoids (Hep) cultured with monocytes (Mo) and/or HBV-specific T cell (Ts), in which the presence of dead target cells is DRAQ7+(in red). HBV-specific TCR T cells are labeled with Cell tracker violet dye (in white), while monocytes are unlabeled. Right: Box plot of the percentage of dead target volume after 24 h of co-culture with retrovirally transduced (Tdx) HBV-specific TCR T cells (Tc = control T cell). (F) Metastasis-on-a-chip device and in situ tumor and tissue construct biofabrication. Arrows show fluid flow (E, endothelium; Lu, Lung; C, colorectal cancer organoids made of RFP tagged HCT116 cells; Li, liver; blank, control). Constructs comprised of cells in ECM hydrogels exist under fluid flow and have the capability to experience circulating cells either interact or pass by. (G) Metastasis tracking at day 1 and day 15 showing HCT116 cells colonizing other organs, using phase and epifluorescence microscopy (A–G) reproduced with permission from Lee et al. (2018), Moore et al. (2018), and Aleman and Skardal (2019), respectively. *P ≤ 0.05, ***P ≤ 0.001.
Figure 10
Figure 10
Advantages and disadvantages of current patient-specific tumor models.

References

    1. Acerbi I., Cassereau L., Dean I., Shi Q., Au A., Park C., et al. (2015). Human breast cancer invasion and aggression correlates with ECM stiffening and immune cell infiltration. Integr. Biol. 7, 1120–1134. 10.1039/c5ib00040h - DOI - PMC - PubMed
    1. Akay M., Hite J., Avci N. G., Fan Y., Akay Y., Lu G., et al. (2018). Drug screening of human GBM spheroids in brain cancer chip. Sci. Rep. 8:15423. 10.1038/s41598-018-33641-2 - DOI - PMC - PubMed
    1. Albritton J. L., Miller J. S. (2017). 3D bioprinting: improving in vitro models of metastasis with heterogeneous tumor microenvironments. Dis. Model. Mech. 10, 3–14. 10.1242/dmm.025049 - DOI - PMC - PubMed
    1. Aleman J., Skardal A. (2019). A multi-site metastasis-on-a-chip microphysiological system for assessing metastatic preference of cancer cells. Biotechnol. Bioeng. 116, 936–944. 10.1002/bit.26871 - DOI - PMC - PubMed
    1. Alizadeh A. A., Aranda V., Bardelli A., Blanpain C., Bock C., Borowski C., et al. (2015). Toward understanding and exploiting tumor heterogeneity. Nat. Med. 21, 846–853. 10.1038/nm.3915 - DOI - PMC - PubMed

LinkOut - more resources