. 2019 Sep;1(9):912-926.
doi: 10.1038/s42255-019-0102-3. Epub 2019 Aug 26.

Endothelial TGF-β signalling drives vascular inflammation and atherosclerosis

Affiliations

Endothelial TGF-β signalling drives vascular inflammation and atherosclerosis

Pei-Yu Chen et al. Nat Metab. 2019 Sep.

Abstract

Atherosclerosis is a progressive vascular disease triggered by interplay between abnormal shear stress and endothelial lipid retention. A combination of these and, potentially, other factors leads to a chronic inflammatory response in the vessel wall, which is thought to be responsible for disease progression characterized by a buildup of atherosclerotic plaques. Yet molecular events responsible for maintenance of plaque inflammation and plaque growth have not been fully defined. Here we show that endothelial TGFβ signaling is one of the primary drivers of atherosclerosis-associated vascular inflammation. Inhibition of endothelial TGFβ signaling in hyperlipidemic mice reduces vessel wall inflammation and vascular permeability and leads to arrest of disease progression and regression of established lesions. These pro-inflammatory effects of endothelial TGFβ signaling are in stark contrast with its effects in other cell types and identify it as an important driver of atherosclerotic plaque growth and show the potential of cell-type specific therapeutic intervention aimed at control of this disease.


Figures
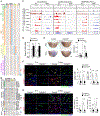
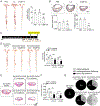
Figure 1.
Figure 1.. TGFβ endothelial-specific induction of inflammatory response.
(A, B) Bulk RNA-seq analysis of HUVEC (EC), HASMC (SMC), CD4+ effector memory T cells (T) and macrophages (M) gene expression before and after stimulation with TGFβ1 (A) and inflammatory gene expression (B). Each lane is an average of two biologically independent samples. (C) ChIP-seq analysis of canonical TGFβ signaling in EC and SMCs. Note increased SMAD2/3 binding to regulatory elements of CCL2, CLDN5 and SERPINE1 in ECs but not SMCs. Pol II S2 and Pol II S5 ChIP in combination with bulk RNA-seq indicate increased expression of CCL2 and SERPINE1 and decreased expression of CLDN5 after TGFβ1 stimulation. N=1 per experimental condition. (D) Relative CLDN5 expression in primary ECs isolated from control (Cdh5-CreERT2; Tgfbr1fl/fl-Tgfbr2fl/fl-mT/mG) and TGFβRiEC mice treated with corn oil. Bars: mean ± SEM. 0 hr P=0.004, 6 hr P=0.001. Two-tailed Student’s t tests (N=3 animals per group for 0 hr, N=6 animals per group for 6 hr). (E) i.v. Evans blue dye administration following a subcutaneous TNFα injection into mouse ear. Scale bar: 2 mm; mean ± SEM. 0 min P=0.56, 15 min P=0.000066, Two-tailed Student’s t tests (N=6 animals per group for 0 min, N=7 animals per group for 15 min). (F,G) Mouse ear sections were stained with anti-ICAM, VCAM-1, CD45 and Ly6G antibodies 6 hrs and 3 days following a s.c. TNFα injection. Note a strong reduction in expression of both adhesion molecules (F) and reduced presence of inflammatory cells (G) in TGFβRiEC mice. Scale bar: 16 μm. N=7 animals per group. Bars: mean ± SEM. ICAM1+ area 6 hrs P=0.001, ICAM1+ area 3 days P=0.0002, VCAM1+ area 6 hrs P=0.0001, VCAM1+ area 3 days P=0.00001, Ly6G+ cells 6 hrs P=0.0499, Ly6G+ cells a 3 days P=0.0004, CD45+ cells 6 hrs P=0.051, CD45+ cells a 3 days P=0.00004. Two-tailed Student’s t tests.
Figure 2:
Figure 2:. Endothelial cell Tgfbr1/Tgfbr2 knockout inhibits atherosclerosis plaque development.
(A) Microphotographs of en face aortas from Apoe−/− and TGFβRiEC-Apoe mice treated with corn oil or Tamoxifen after 0, 0.5, 1, 2, 3, and 4 months of HCHFD stained with Oil-Red-O. (B) Lesion area quantification: % lesion area refers to ORO stained as a % of the total aortic surface. All data shown as mean ± SEM. Ø: not detected. P=0.000000007 for Apoe−/− 0.5 month of HCHFD compared to TGFβRiEC-Apoe 0.5 month of HCHFD, P=0.0000058 for Apoe−/− 1 month of HCHFD compared to TGFβRiEC-Apoe 1 month of HCHFD, P=0.00000000002 for Apoe−/− 2 month of HCHFD compared to TGFβRiEC-Apoe 2 month of HCHFD, P=0.0000051 for Apoe−/− 3 month of HCHFD compared to TGFβRiEC-Apoe 3 month of HCHFD, P=0.0000000000094 for Apoe−/− 4 month of HCHFD compared to TGFβRiEC-Apoe 4 month of HCHFD.Two-tailed Student’s t tests. 0M N=3 animals per group, 0.5M-4M N=11 animals per group. (C) Representative photomicrographs of Oil-Red-O stained atherosclerotic lesions in aortic arches of Apoe−/− and TGFβRiEC-Apoe mice treated with corn oil or Tamoxifen after 0, 0.5, 1, 2, 3, and 4 months of HCHFD. Scale bar: 5 mm. (N=3 animals per group) (D) (Left) Representative examples of cross-sections from the aortic root after 4 months of HCHFD stained with Oil-Red-O. Scale bar: 200 μm. (Right) Quantification of aortic root lesion areas. Bars indicate the mean ± SEM. P=0.000011, Two-tailed Student’s t tests (N=11 animals per group). (E) Representative images of brachiocephalic artery from Apoe−/− and TGFβRiEC-Apoe mice treated with corn oil or tamoxifen (Movat staining). Scale bar: 100 μm. (F) Measurement of lesion area. Bars: mean ± SEM. P=0.000000136 for for Apoe−/− 1 month of HCHFD compared to TGFβRiEC-Apoe 1 month of HCHFD, P=0.0000006 for Apoe−/− 2 month of HCHFD compared to TGFβRiEC-Apoe 2 month of HCHFD, P=0.0000000019 for Apoe−/− 3 month of HCHFD compared to TGFβRiEC-Apoe 3 month of HCHFD, P=0.000000022 for Apoe−/− 4 month of HCHFD compared to TGFβRiEC-Apoe 4 month of HCHFD. Two-tailed Student’s t tests. (N=11 animals per group). (G) Quantifications of the extent of necrotic areas in brachiocephalic artery of Apoe−/− and TGFβRiEC-Apoe mice. Bars: mean ± SEM. P=0.000000023 for Apoe−/− 1 month of HCHFD compared to TGFβRiEC-Apoe 1 month of HCHFD, P=0.000000000014 for Apoe−/− 2 month of HCHFD compared to TGFβRiEC-Apoe 2 month of HCHFD, P=0.000000000029 for Apoe−/− 3 month of HCHFD compared to TGFβRiEC-Apoe 3 month of HCHFD, P=0.00000000000013 for Apoe−/− 4 month of HCHFD compared to TGFβRiEC-Apoe 4 month of HCHFD. Two-tailed Student’s t tests. (N=11 animals per group). (H) Morphologic classification of brachiocephalic artery lesion severity in Apoe−/− and TGFβRiEC-Apoe mice.
Figure 3:
Figure 3:. Endothelial cell Tgfbr1/Tgfbr2 knockout facilitates regression of advanced murine atherosclerotic plaques.
(A) Experiment timeline: mice were fed HCHFD for 3 months to induce advanced atherosclerotic lesions. At that point, tamoxifen or vehicle control were administered and the diet was changed to ND for additional 1–2 months. (B) Representative images of aortic root cross-sections stained with Movat (scale bar: 200 μm). (C) Root lesion area quantification. Data are means ± SEM. NS: not significant, P=0.53 for Apoe−/− 3M HCHFD + 1M ND compared to Apoe−/− 3M HCHFD, P=0.00000097 for TGFβRiEC-Apoe 3M HCHFD + 1M ND compared to Apoe−/− 3M HCHFD, P=0.125 for Apoe−/− 3M HCHFD + 2M ND compared to Apoe−/− 3M HCHFD, P=0.000000079 for TGFβRiEC-Apoe 3M HCHFD + 2M ND compared to Apoe−/− 3M HCHFD, P=0.00033 for TGFβRiEC-Apoe 3M HCHFD + 1M ND compared to Apoe−/− 3M HCHFD + 1M ND, P=0.0000079 for TGFβRiEC-Apoe 3M HCHFD + 2M ND compared to Apoe−/− 3M HCHFD + 2M ND. Two-tailed Student’s t tests. 3M Apoe−/− baseline N=12 animals per group, 3M HFD + 1M ND Apoe−/− N=6 animals per group, 3M HFD + 2M ND Apoe−/− N=6 animals per group, 3M HFD + 1M ND TGFβRiEC-Apoe N=5 animals per group, 3M HFD + 2M ND TGFβRiEC-Apoe N=4 animals per group. (D) Morphologic classification of aortic root lesions severity in Apoe−/− and TGFβRiEC-Apoe mice. (3M Apoe−/− baseline N=10 animals per group, 3M HFD + 1M ND Apoe−/− N=10 animals per group, 3M HFD + 2M ND Apoe−/− N=10 animals per group, 3M HFD + 1M ND TGFβRiEC-Apoe N=10 animals per group, 3M HFD + 2M ND TGFβRiEC-Apoe N=10 animals per group) (E) Representative images of cross-sections of brachiocephalic artery stained with Movat (scale bar: 200 μm). (F) Lesion area quantification. All data shown as mean ± SEM. NS: not significant, P=0.58 for Apoe−/− 3M HCHFD + 1M ND compared to Apoe−/− 3M HCHFD, P=0.00086 for TGFβRiEC-Apoe 3M HCHFD + 1M ND compared to Apoe−/− 3M HCHFD, P=0.047 for Apoe−/− 3M HCHFD + 2M ND compared to Apoe−/− 3M HCHFD, P=0.00039 for TGFβRiEC-Apoe 3M HCHFD + 2M ND compared to Apoe−/− 3M HCHFD, P=0.021 for TGFβRiEC-Apoe 3M HCHFD + 1M ND compared to Apoe−/− 3M HCHFD + 1M ND, P=0.0000075 for TGFβRiEC-Apoe 3M HCHFD + 2M ND compared to Apoe−/− 3M HCHFD + 2M ND. Two-tailed Student’s t tests. 3M Apoe−/− baseline N=4 animals per group, 3M HFD + 1M ND Apoe−/− N=5 animals per group , 3M HFD + 2M ND Apoe−/− N=8 animals per group, 3M HFD + 1M ND TGFβRiEC-Apoe N=7 animals per group, 3M HFD + 2M ND TGFβRiEC-Apoe N=7 animals per group. Two-tailed Student’s t tests. (G) Morphologic classification of brachiocephalic artery lesion severity in Apoe−/− and TGFβRiEC-Apoe mice. (3M Apoe−/− baseline N=4 animals per group, 3M HFD + 1M ND Apoe−/− N=5 animals per group, 3M HFD + 2M ND Apoe−/− N=7 animals per group, 3M HFD + 1M ND TGFβRiEC-Apoe N=8 animals per group, 3M HFD + 2M ND TGFβRiEC-Apoe N=7 animals per group).
Figure 4.
Figure 4.. Single cell RNA-sequencing (scRNA-seq) analysis of endothelial gene expression in atherosclerosis.
(A) tSNE representation of single-cell transcriptomes of ECs from Apoe−/− (Cdh5-CreERT2; Tgfbr1fl/fl-Tgfbr2fl/fl-Apoe−/−mT/mG mice treated with corn oil) and TGFβRiEC-Apoe (Cdh5-CreERT2; Tgfbr1fl/fl-Tgfbr2fl/fl-Apoe−/−mT/mG mice treated with Tamoxifen) mice on ND or HCHFD. (B) Bar graph showing the cell distributions by genotype across cell clusters. Total number of cells in the cluster is at the top of the bar. (C) Heat map representation of gene expression from scRNA-seq data arranged by mouse genotype. (D) The z-score of the first principal component of the nGO pathway
Figure 5:
Figure 5:. Endothelial cell Tgfbr1/Tgfbr2 deletion decreases inflammation.
(A,B) Brachiocephalic artery atherosclerotic plaques after 4 months (A) and 2 months (B) of HCHFD in Apoe−/− and TGFβRiEC-Apoe mice. (A) Top: immunocytochemistry. Nuclei are counterstained with DAPI (blue). L: lumen. Scale bar: 62 μm. (4M Apoe−/− N=7 animals per group and 4M TGFβRiEC-Apoe N=8 animals per group). Bottom: Image quantification. Bars: mean ± SEM. P=0.000016 for Mac3, P=0.0083 for CD3 Two-tailed Student’s t tests. (B) Top: immunocytochemistry. Nuclei are counterstained with DAPI (blue). L: lumen. Scale bar: 62 μm. (4M Apoe−/− N=6 animals per group and 4M TGFβRiEC-Apoe N=6 animals per group). Bottom: Image quantification. Bars: mean ± SEM. P=0.000011 for ICAM-1, P=0.025 for Mac-2, P=0.02 for CD45, P=0.044 for CD3. Two-tailed Student’s t tests. (C) qPCR analysis of cytokines and cytokine receptors in Apoe−/− and TGFβRiEC-Apoe mice heart endothelial cells. β-actin was used for sample loading normalization. Bars: mean ± SEM. P=0.000036 for CCL2, P=0.00023 for CCL7, P=0.000058 for TNFRSFLA, P=0.00000021 for TNFRSFLB, P=0.0000042 for TLR4, P=0.000032 for MyD88. Two-tailed Student’s t test. Histogram is representative of six biologically independent samples. (D) (Left) THP-1 cell attachment to TNFα-treated (10 ng/ml for 5hrs) HUVEC monolayer in the presence or absence of TGFβR1/2 knockdown. (Right) Quantification of attached THP-1 cells per field. Bars: mean ± SEM. P=0.00053 for PBS treated groups, P=0.0000000033 for TNFα-treated groups. Two-tailed Student’s t test. N=8 biologically independent samples for PBS treated groups, N=7 for TNFα-treated groups. (E-F) Mice were fed the HCHFD for 3 months to induce advanced atherosclerotic lesions then treated with tamoxifen or vehicle control and switched to ND for additional 2 weeks. Top: Immunocytochemistry of brachiocephalic artery plaques from Apoe−/− and TGFβRiEC-Apoe mice stained with indicated antibodies. Nuclei counterstained with DAPI (blue). L: lumen. Bottom: Quantification of ICAM-1 area, Mac-2+/Ki67+, Mac-2+/TUNEL+, and VCAM-1+ EC. Bars: mean ± SEM. P=0.03 for Mac2+/Ki67+ cells, P=0.002 for Mac2+/TUNEL+ cells, P=0.0019 for ICAM-1 area, P=0.0002 for VCAM-1+ EC. Two-tailed Student’s t test. Scale bar: 16 μm. (Apoe−/− N=4 animals per group, TGFβRiEC-Apoe N=7 animals per group).
Figure 6:
Figure 6:. 7C1-siTgfbr1/2 therapy suppress atherosclerosis lesion development and facilitates regression of advanced atherosclerotic plaques.
Apoe−/− mice treated with PBS, 7C1-siLuc or 7C1-siTgfbr1/2. (A) Representative images of the Oil-Red-O (ORO)-stained atherosclerotic lesions in the aorta (left) and their quantification (right). All data: mean ± SEM. P=0.00018 for siTgfbr12 compared to Luc. Two-tailed Student’s t tests. (PBS Apoe−/− N=4 animals per group, Luc Apoe−/− N=4 animals per group, siTgfbr1/2 Apoe−/− N=8 animals per group). (B). Movat-stained brachiocephalic artery plaques Scale bar: 200 μm. Lesion area quantification (bottom). Bars: mean ± SEM. Lesion area: P=0.065 for siTgfbr12 compared to Luc. Necrotic core area: P=0. 00015 for siTgfbr12 compared to Luc. Two-tailed Student’s t tests. PBS Apoe−/− N=4 animals per group, Luc Apoe−/− N=4 animals per group, siTgfbr1/2 Apoe−/− N=8 animals per group for lesion area; PBS Apoe−/− N=4 animals per group, Luc Apoe−/− N=4 animals per group, siTgfbr1/2 Apoe−/− N=5 animals per group for necrotic core area. (C) Experiment timeline. (D) (Left) Representative images of the ORO-stained atherosclerotic aorta lesions in Apoe−/− mice treated with 7C1-siLuciferase or 7C1-siTgfbr1/2. (Right) Lesion area quantification; data: mean ± SEM. NS: not significant, P=0.41 for Apoe−/− 3M HCHFD + 1M ND compared to Apoe−/− 3M HCHFD, P=0.0015 for TGFβRiEC-Apoe 3M HCHFD + 1M ND compared to Apoe−/− 3M HCHFD, P=0.17 for Apoe−/− 3M HCHFD + 2M ND compared to Apoe−/− 3M HCHFD, P=0.000019 for TGFβRiEC-Apoe 3M HCHFD + 2M ND compared to Apoe−/− 3M HCHFD, P=0.0015 for TGFβRiEC-Apoe 3M HCHFD + 1M ND compared to Apoe−/− 3M HCHFD + 1M ND, P=0.00022 for TGFβRiEC-Apoe 3M HCHFD + 2M ND compared to Apoe−/− 3M HCHFD + 2M ND. Two-tailed Student’s t tests. 3M Apoe−/− baseline N=7 animals per group, 3M HCHFD + 1M ND 7C1-Luciferase Apoe−/− N=6 animals per group, 3M HCHFD + 1M ND 7C1-siTgfbr1/2 Apoe−/− N=6 animals per group, 3M HCHFD + 2M ND 7C1-Luciferase Apoe−/− N=6 animals per group, 3M HCHFD + 2M ND 7C1-siTgfbr1/2 Apoe−/− N=6 animals per group). (E-G) Representative images of brachiocephalic artery from 7C1-siLuciferase or 7C1-siTgfbr1/2 treated mice stained with H&E (scale bar: 200 μm) (E) and their histological (F) and morphological (G) quantification. NS: not significant, P=0.57 for Apoe−/− 3M HCHFD + 1M ND compared to Apoe−/− 3M HCHFD, P=0.0027 for TGFβRiEC-Apoe 3M HCHFD + 1M ND compared to Apoe−/− 3M HCHFD, P=0.036 for Apoe−/− 3M HCHFD + 2M ND compared to Apoe−/− 3M HCHFD, P=0.00065 for TGFβRiEC-Apoe 3M HCHFD + 2M ND compared to Apoe−/− 3M HCHFD, P=0.0012 for TGFβRiEC-Apoe 3M HCHFD + 1M ND compared to Apoe−/− 3M HCHFD + 1M ND, P=0.00038 for TGFβRiEC-Apoe 3M HCHFD + 2M ND compared to Apoe−/− 3M HCHFD + 2M ND. Two-tailed Student’s t tests. 3M Apoe−/− baseline N=6, 3M HCHFD + 1M ND 7C1-Luciferase Apoe−/− N=6 animals per group, 3M HCHFD + 1M ND 7C1-siTgfbr1/2 Apoe−/− N=6 animals per group, 3M HCHFD + 2M ND 7C1-Luciferase Apoe−/− N=6 animals per group, 3M HCHFD + 2M ND 7C1-siTgfbr1/2 Apoe−/− N=6 animals per group).

Comment in

References

    1. Baeyens N & Schwartz MA Biomechanics of vascular mechanosensation and remodeling. Mol Biol Cell 27, 7–11, doi:10.1091/mbc.E14-11-1522 (2016). - DOI - PMC - PubMed
    1. Tabas I, Garcia-Cardena G & Owens GK Recent insights into the cellular biology of atherosclerosis. J Cell Biol 209, 13–22, doi:10.1083/jcb.201412052 (2015). - DOI - PMC - PubMed
    1. Schwartz MA, Vestweber D & Simons M A unifying concept in vascular health and disease. Science 360, 270–271, doi:10.1126/science.aat3470 (2018). - DOI - PMC - PubMed
    1. Chen P-Y et al. Endothelial-to-mesenchymal transition drives atherosclerosis progression. The Journal of clinical investigation 125, 4529–4543, doi:10.1172/JCI82719 (2015). - DOI - PMC - PubMed
    1. Evrard SM et al. Endothelial to mesenchymal transition is common in atherosclerotic lesions and is associated with plaque instability. Nature communications 7, 11853, doi:10.1038/ncomms11853 (2016). - DOI - PMC - PubMed

Publication types

Substances