. 2019;53(4):656-686.
doi: 10.33594/000000164.

A Novel Probe for Spliceosomal Proteins that Induces Autophagy and Death of Melanoma Cells Reveals New Targets for Melanoma Drug Discovery

Affiliations

A Novel Probe for Spliceosomal Proteins that Induces Autophagy and Death of Melanoma Cells Reveals New Targets for Melanoma Drug Discovery

Manikandan Palrasu et al. Cell Physiol Biochem. 2019.

Abstract

Background/aims: Despite recent advances in melanoma drug discovery, the average overall survival of patients with late stage metastatic melanoma is approximately 3 years, suggesting a need for approaches that identify new melanoma targets. We have previously reported a discovery of novel anti-melanoma compound 2155-14 (Onwuha-Ekpete et al., J Med Chem. 2014 Feb 27; 57(4):1599-608). In the report presented herein we aim to identify its target(s) and mechanism of action.

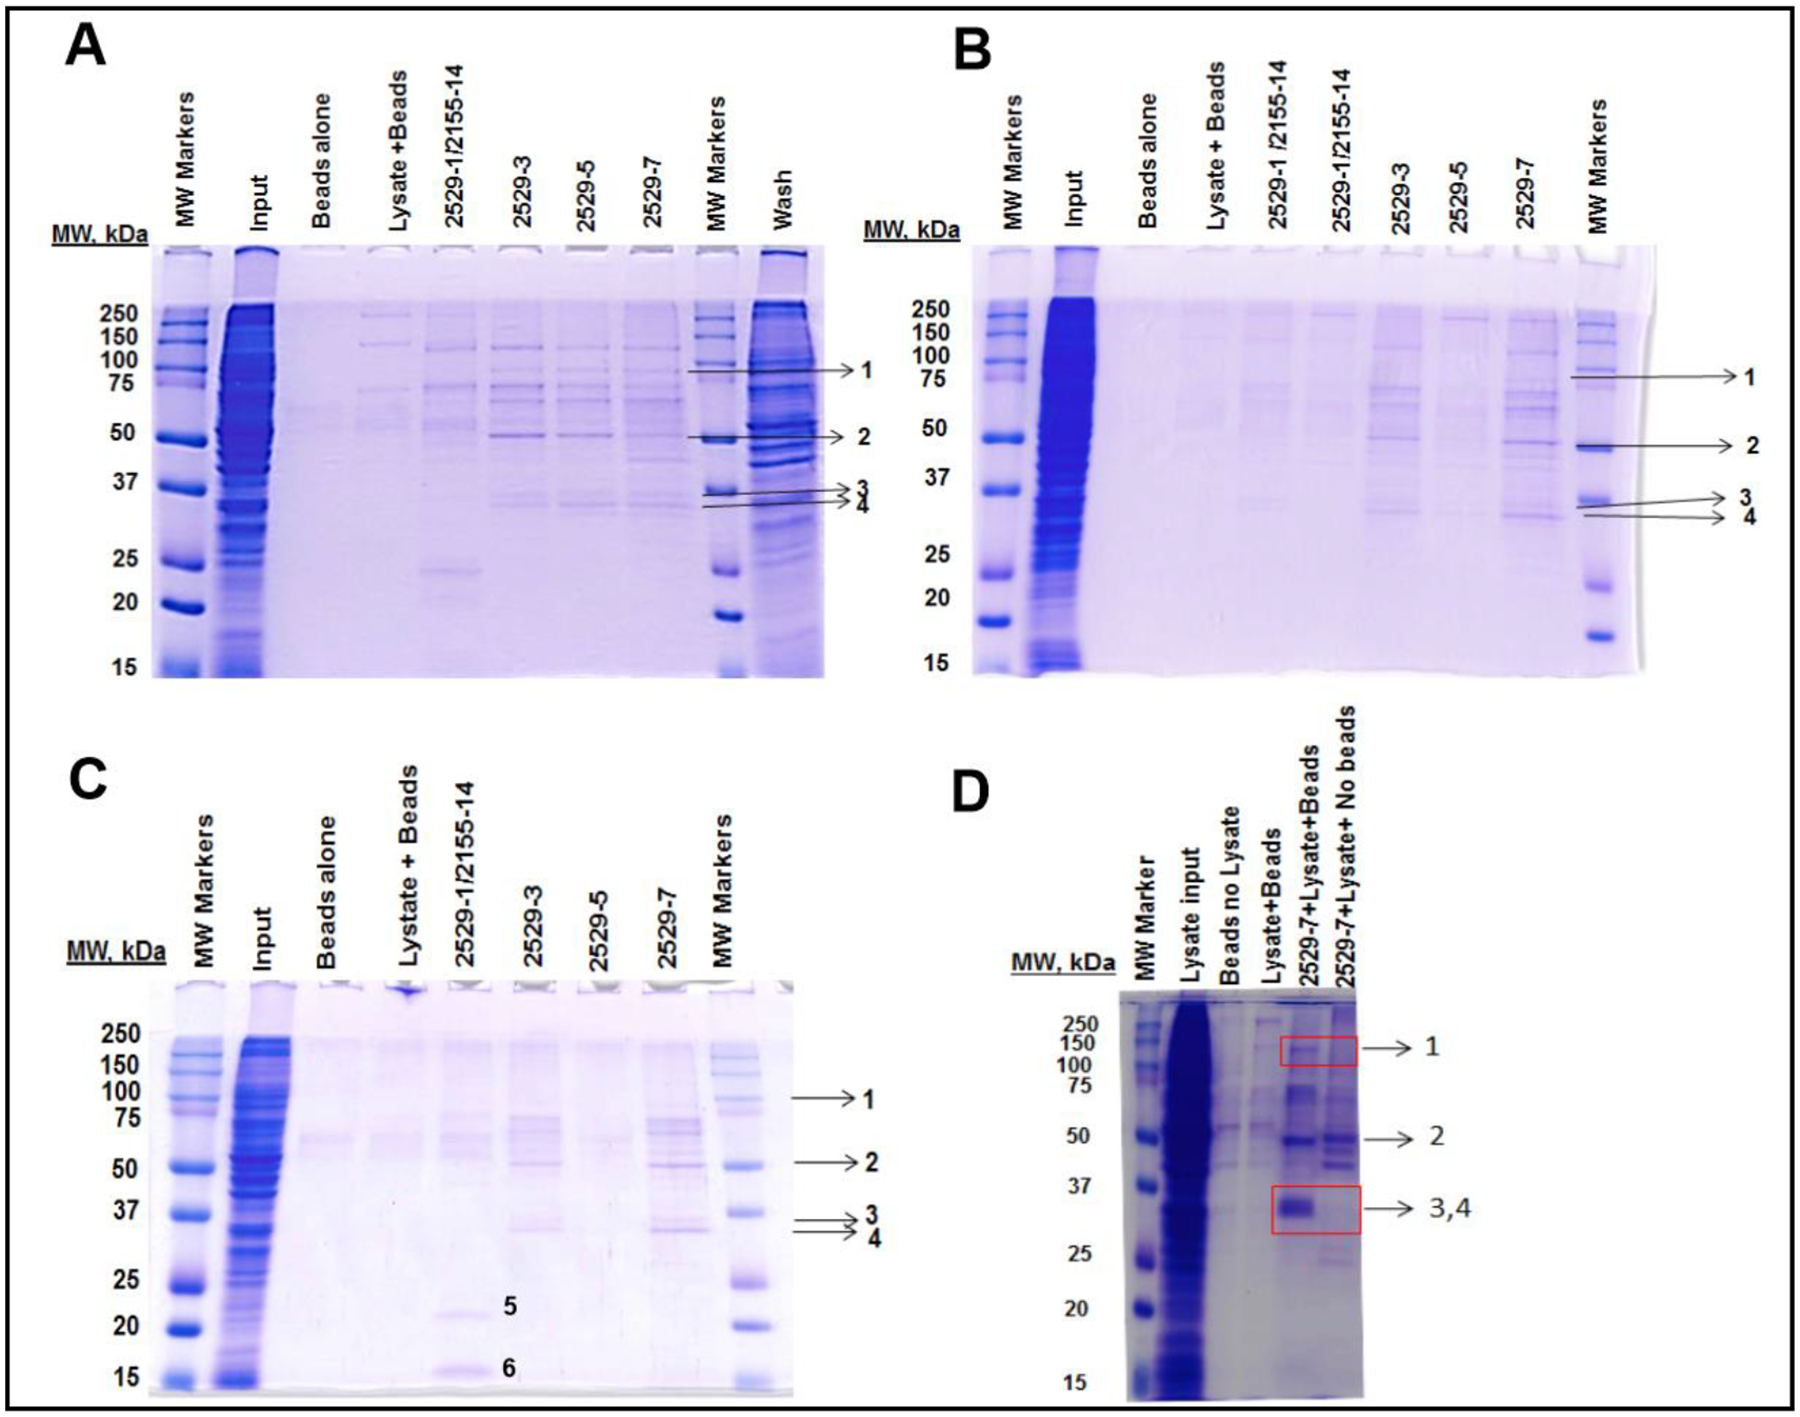
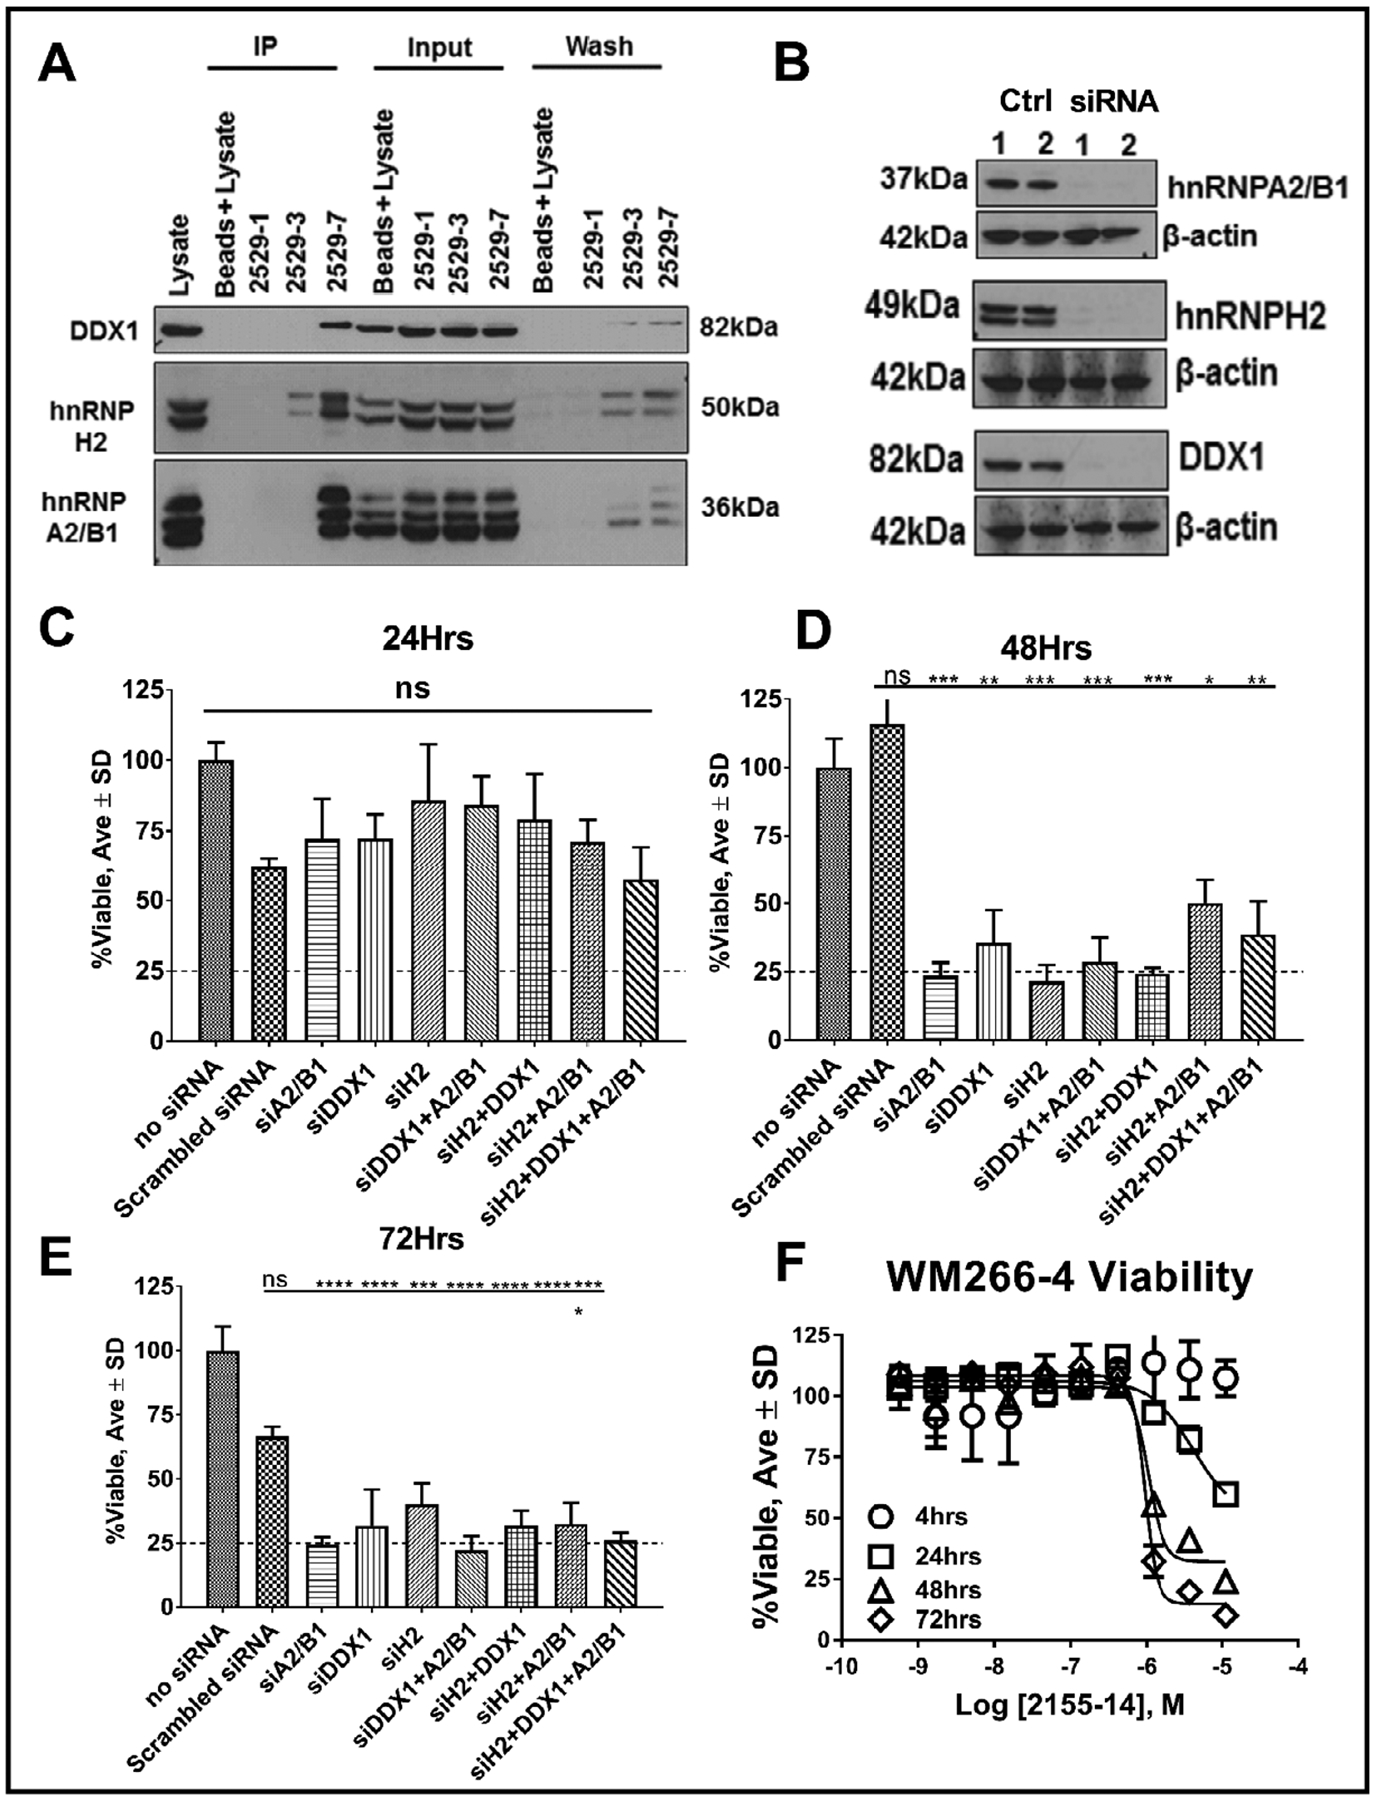
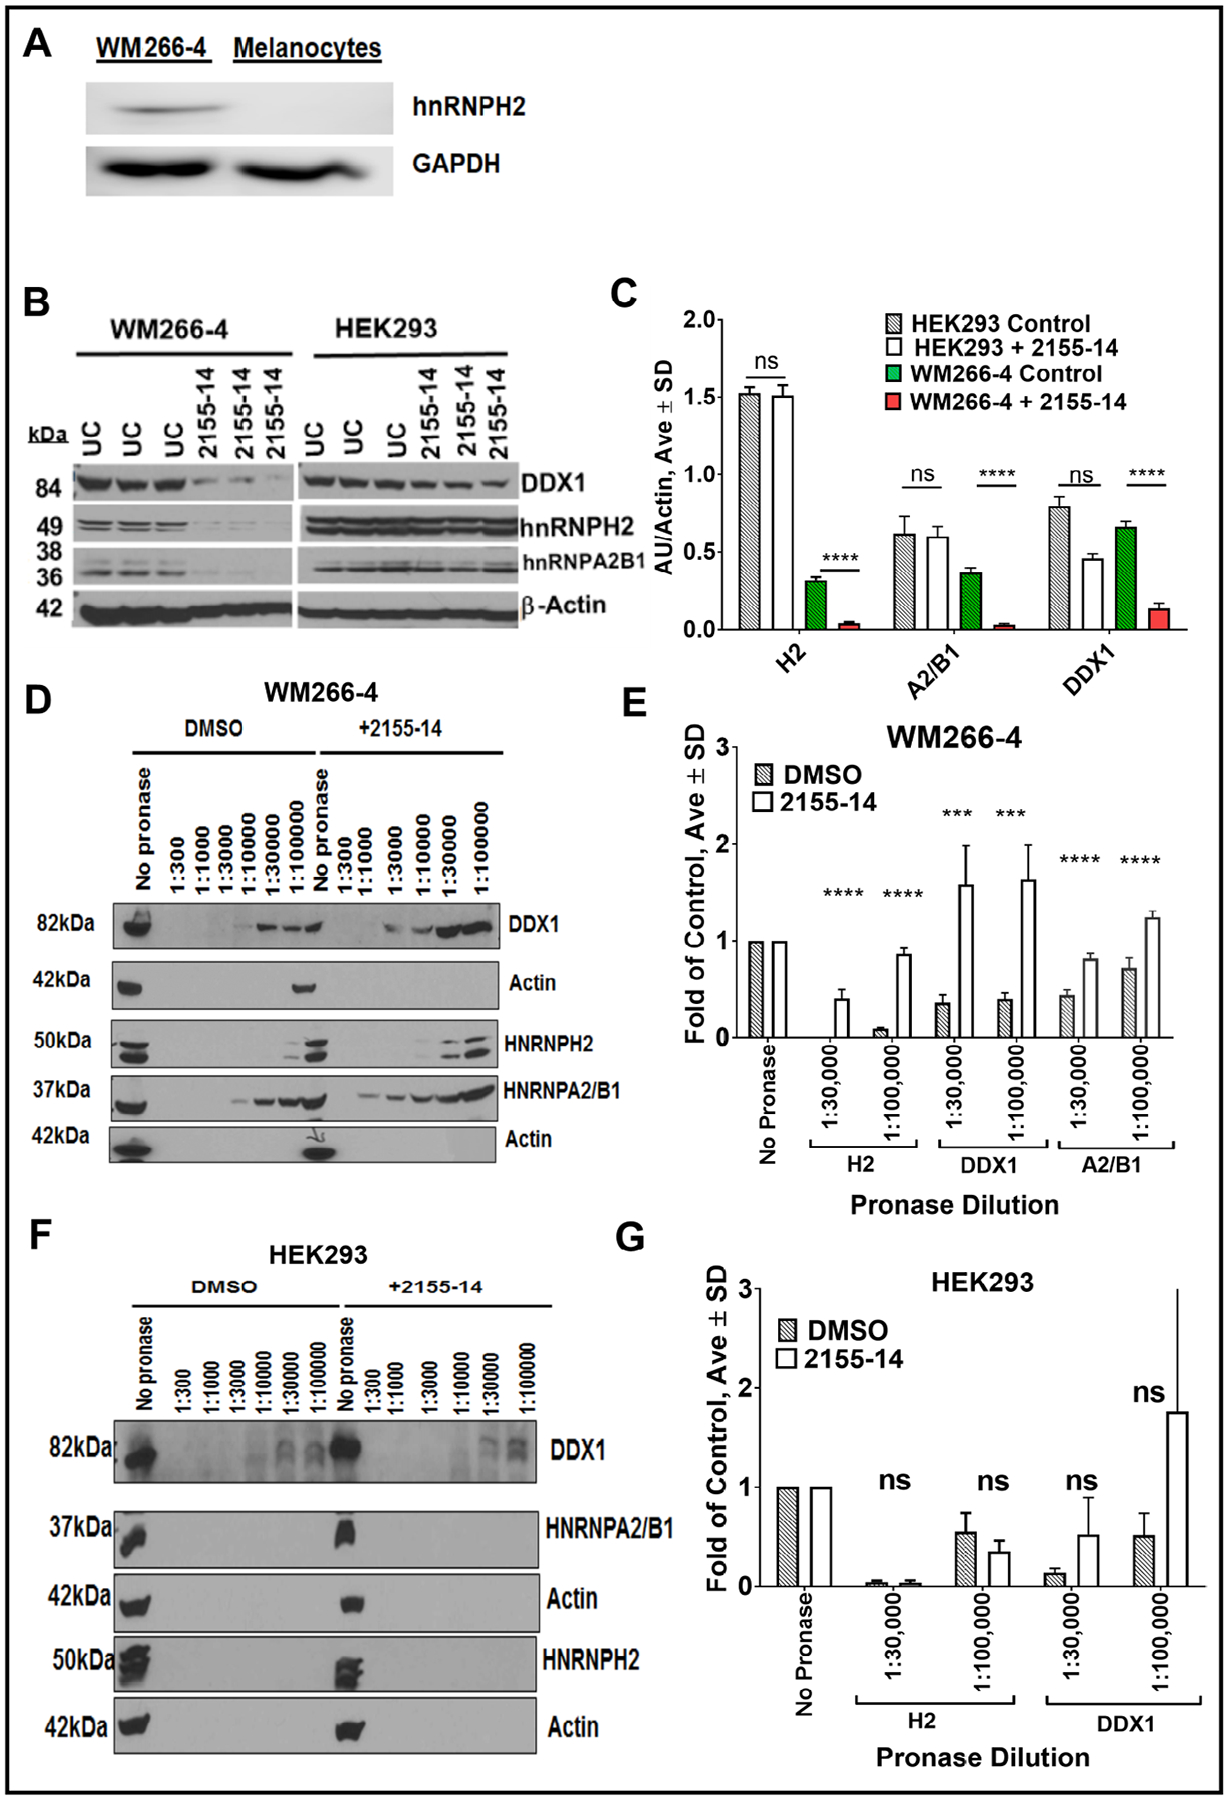
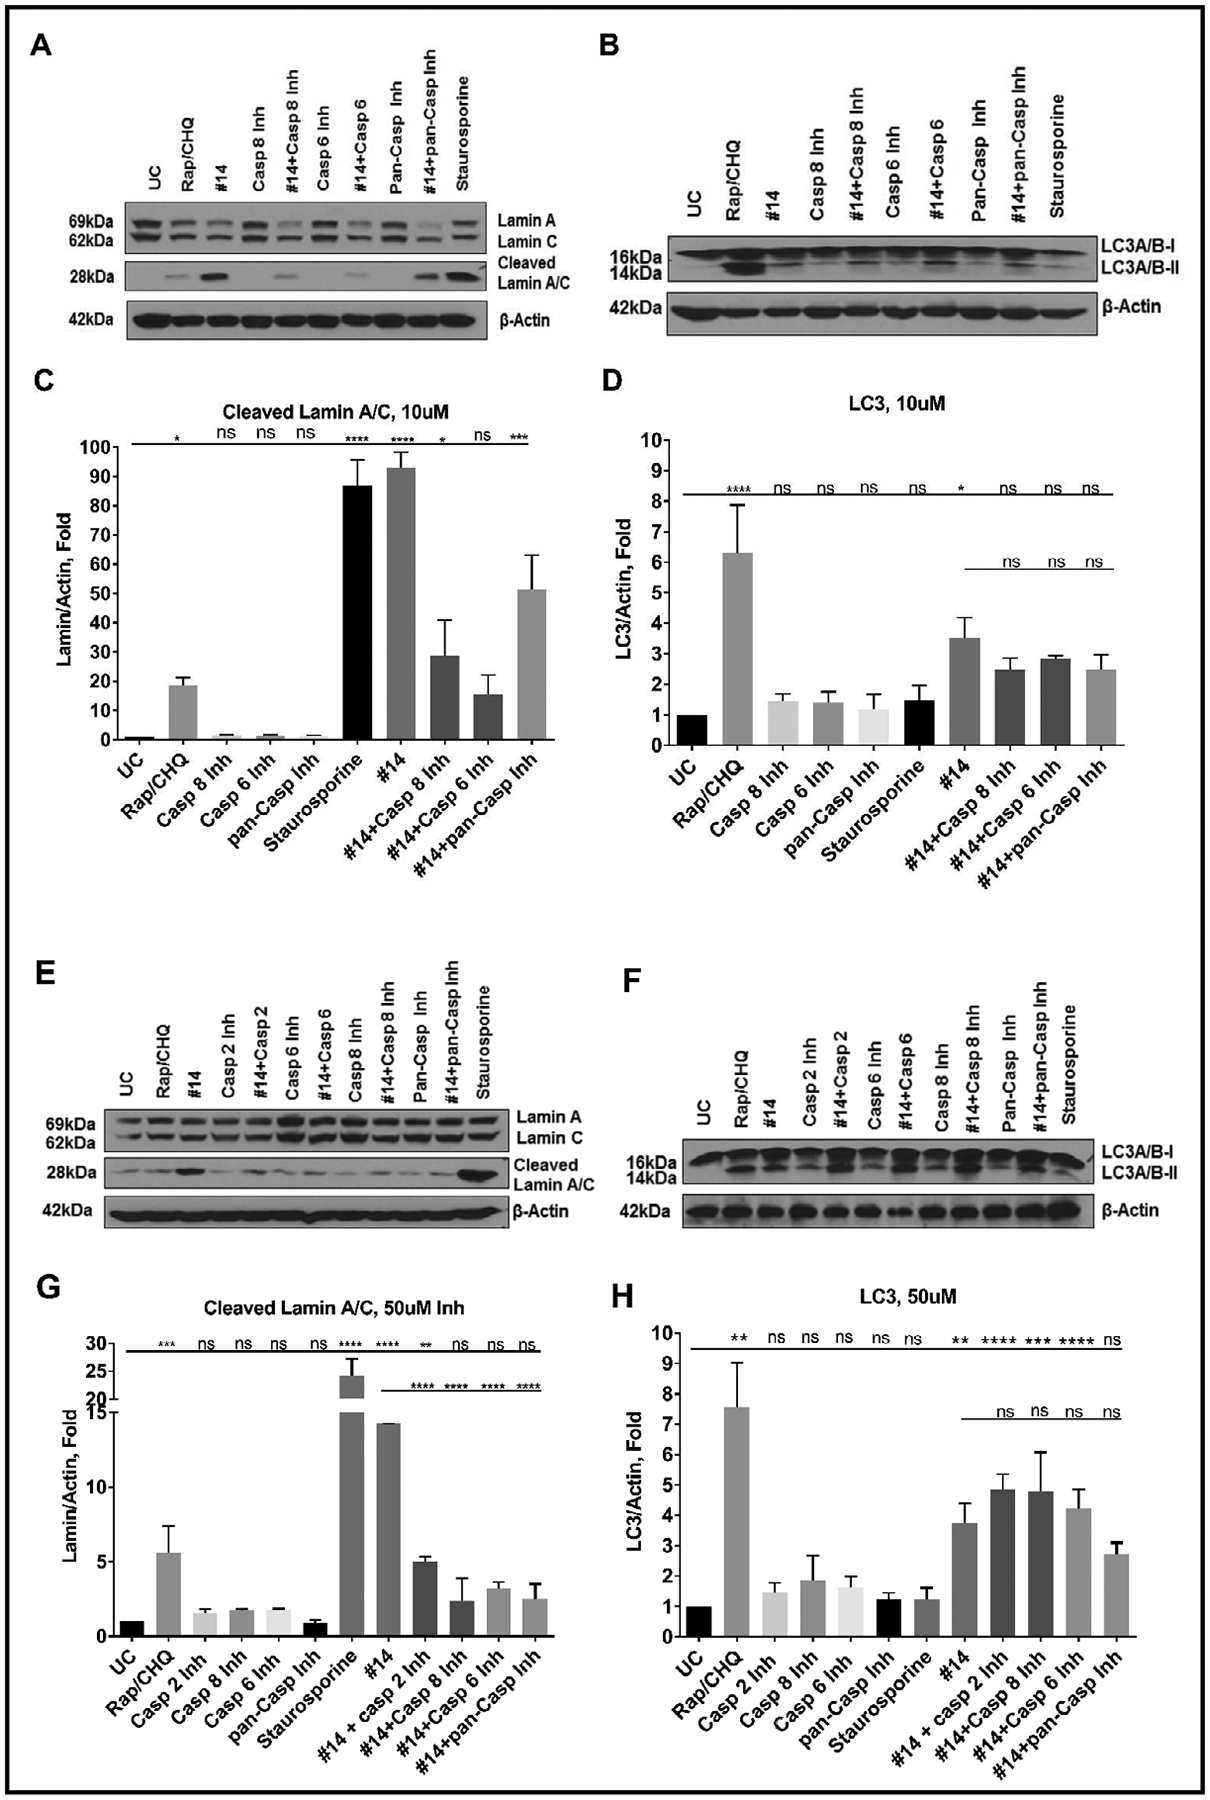
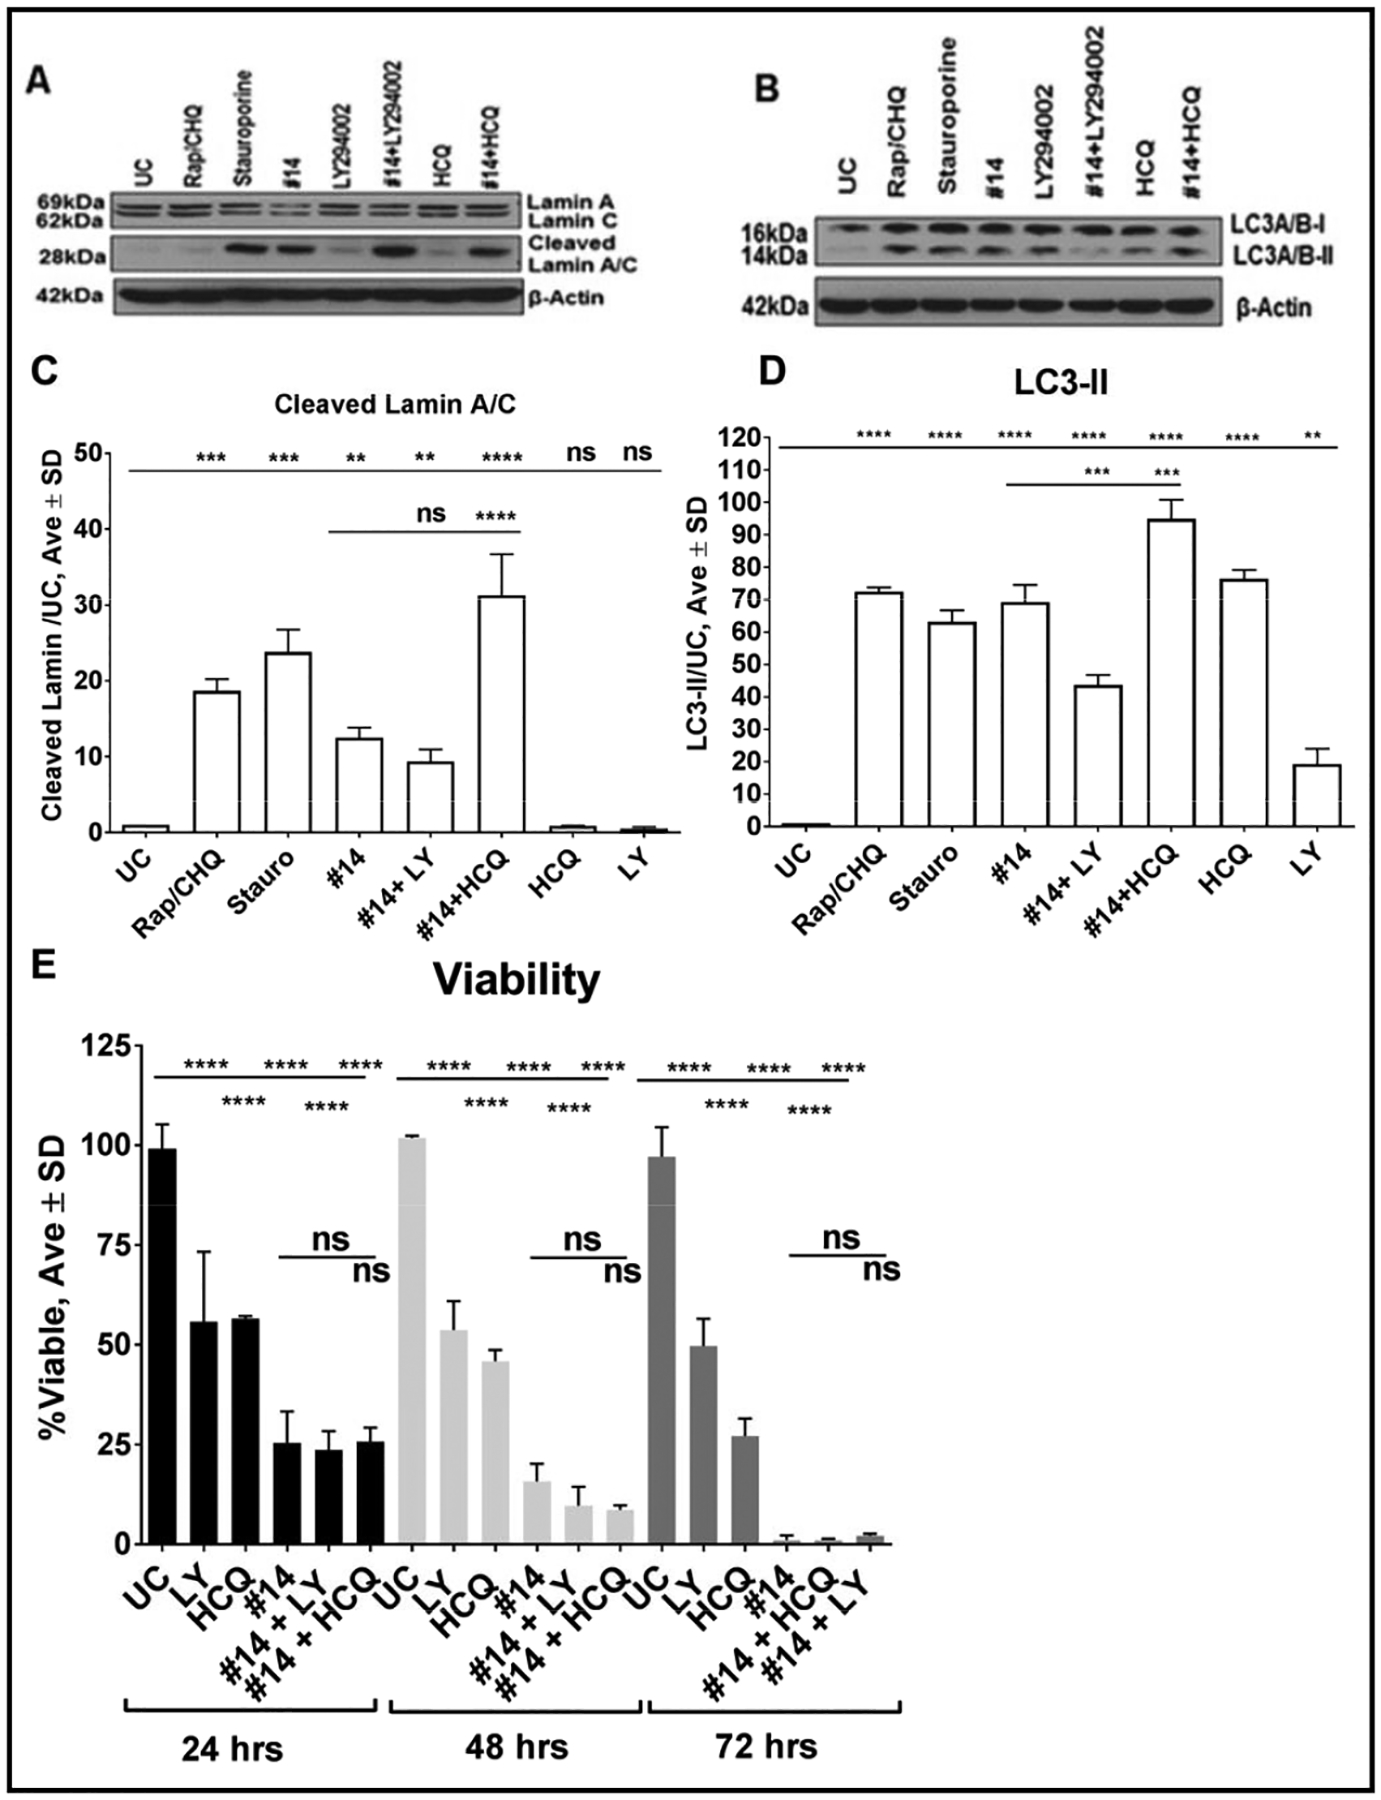
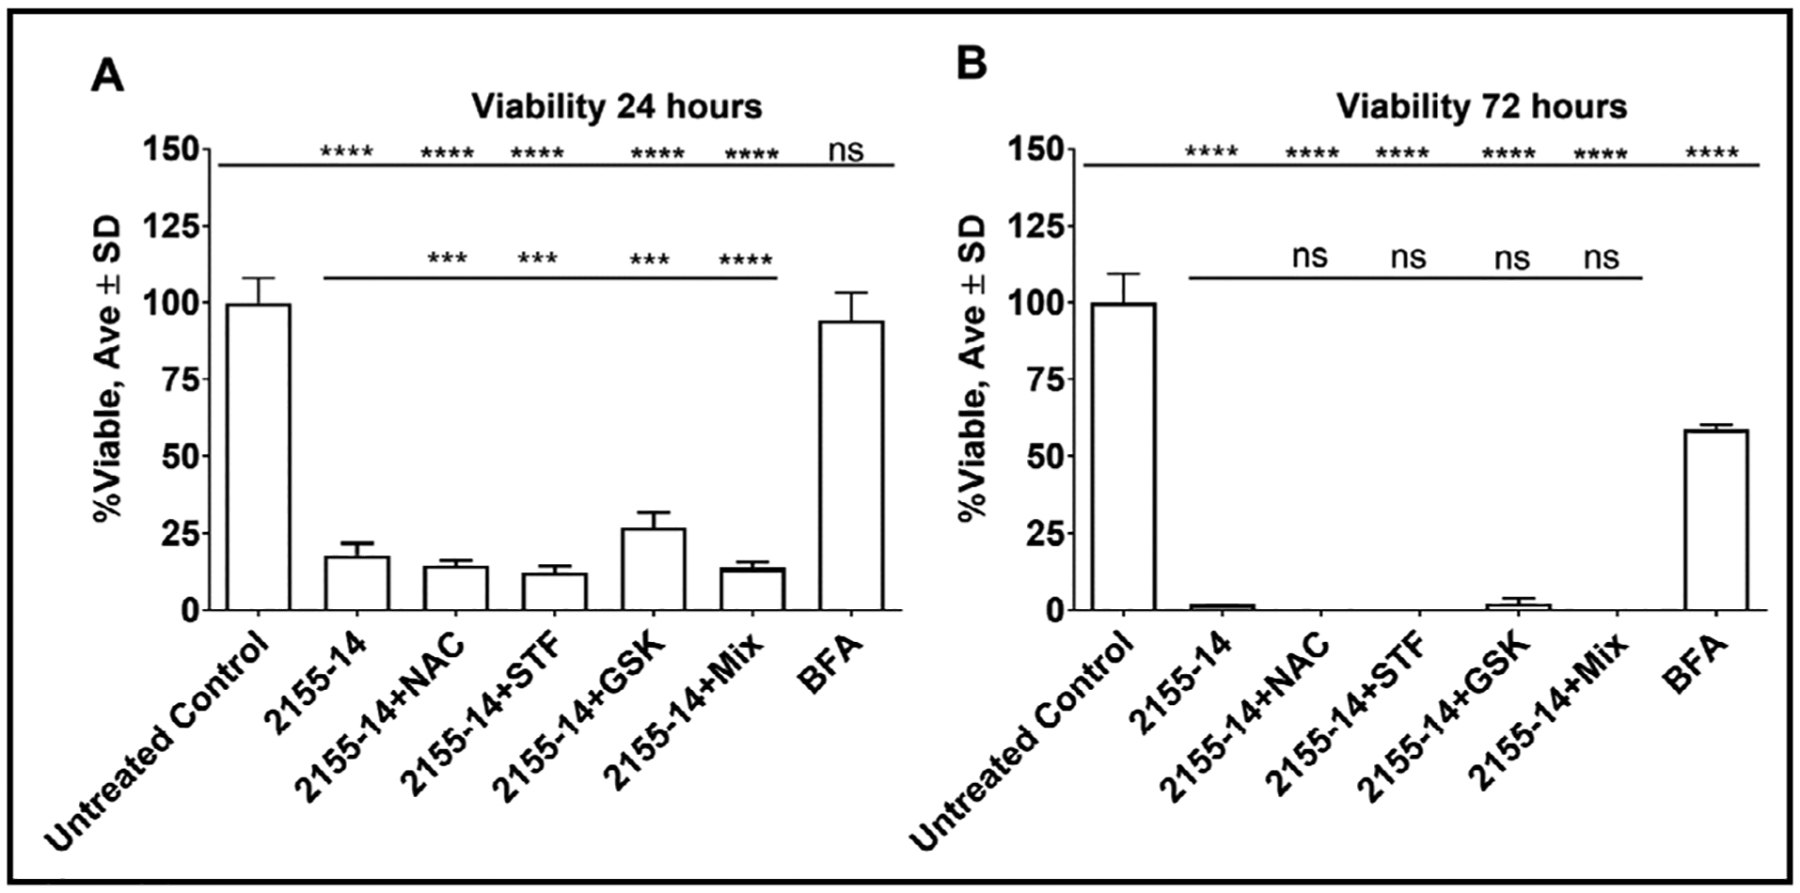
Methods: We utilized biotinylated analog of 2155-14 to pull down its targets from melanoma cells. Proteomics in combination with western blot were used to identify the targets. Mechanism of action of 2155-14 was determined using flow cytometry, RT-PCR, microscopy, western blot, and enzymatic activity assays. Where applicable, one-way analysis of variance (ANOVA) was used followed by Dunnett post hoc test.

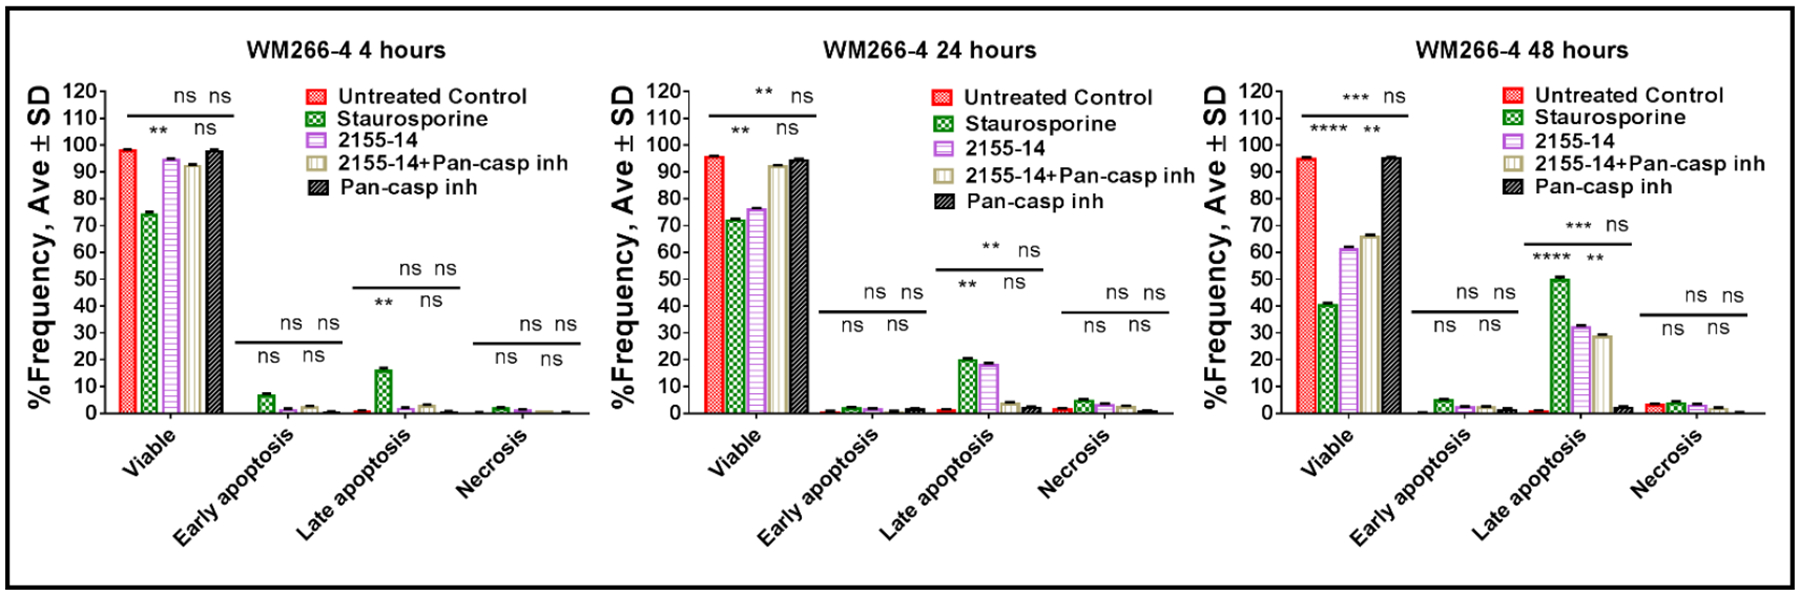
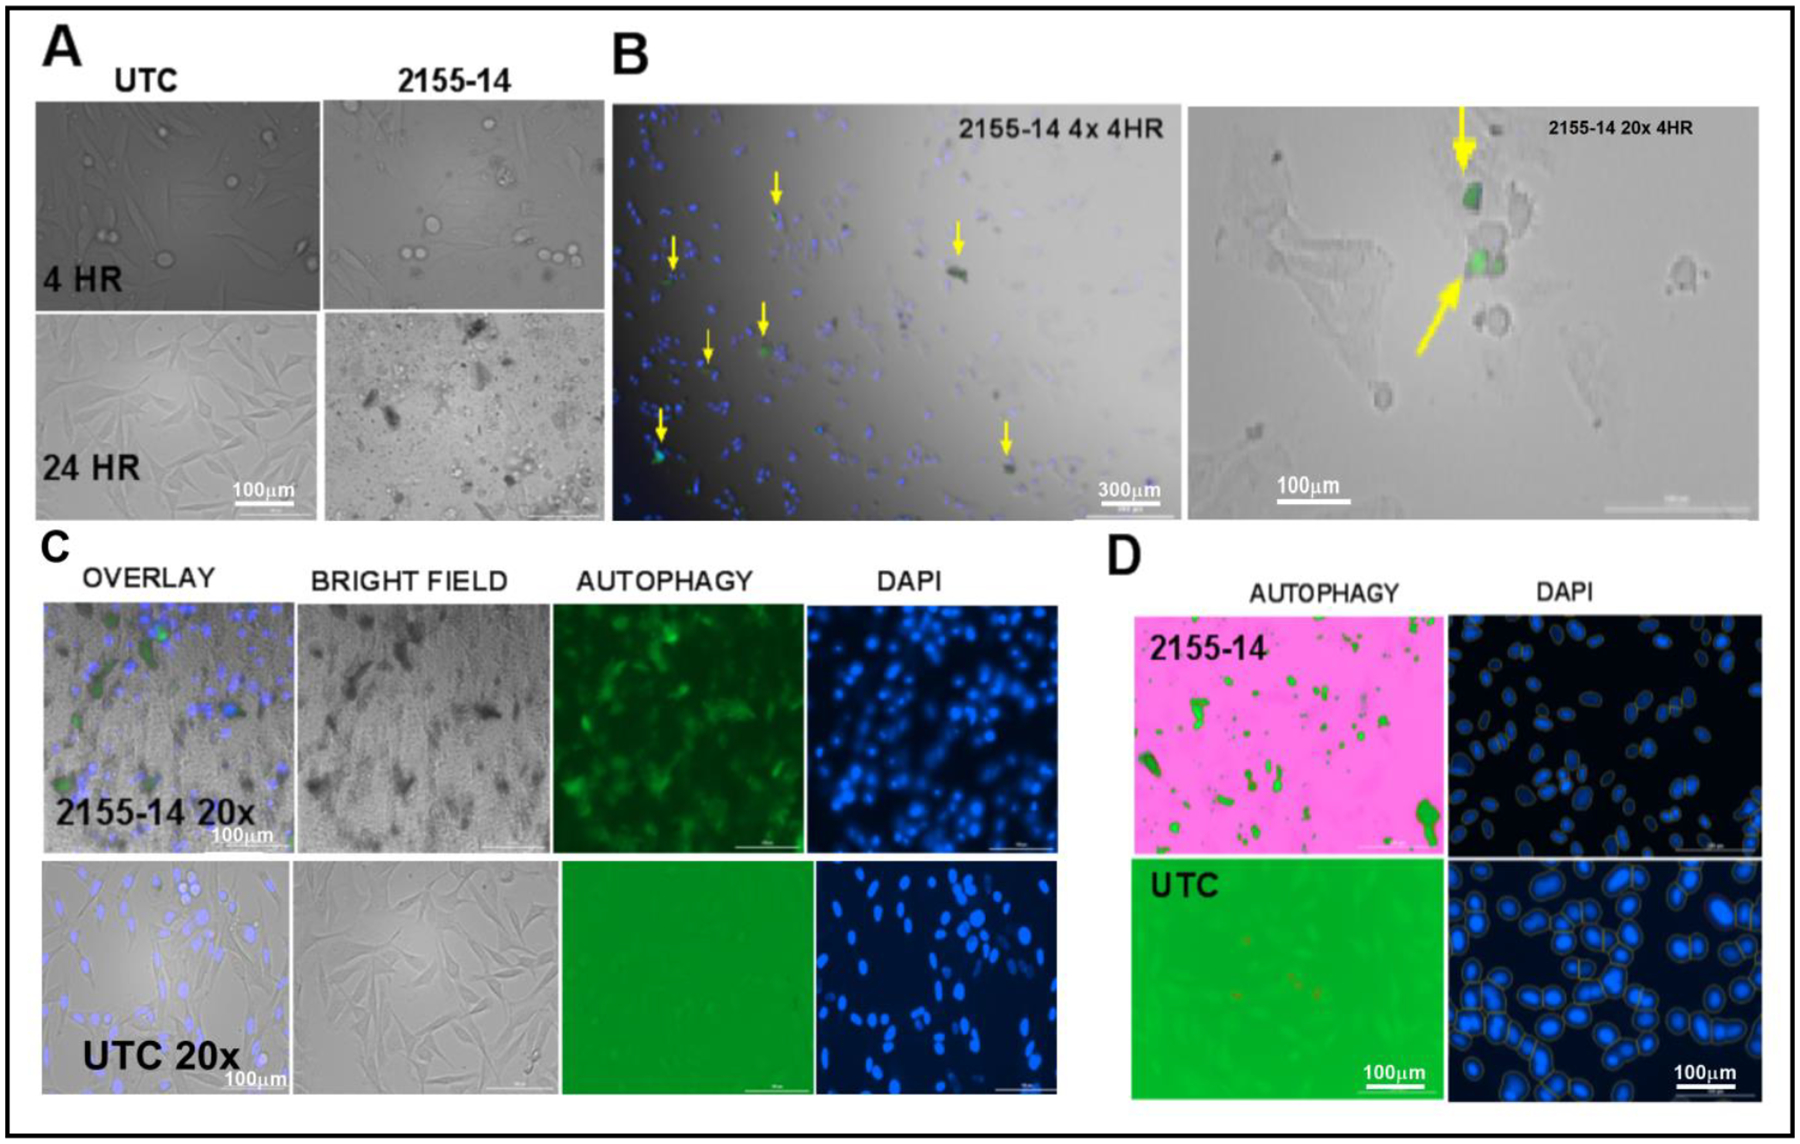
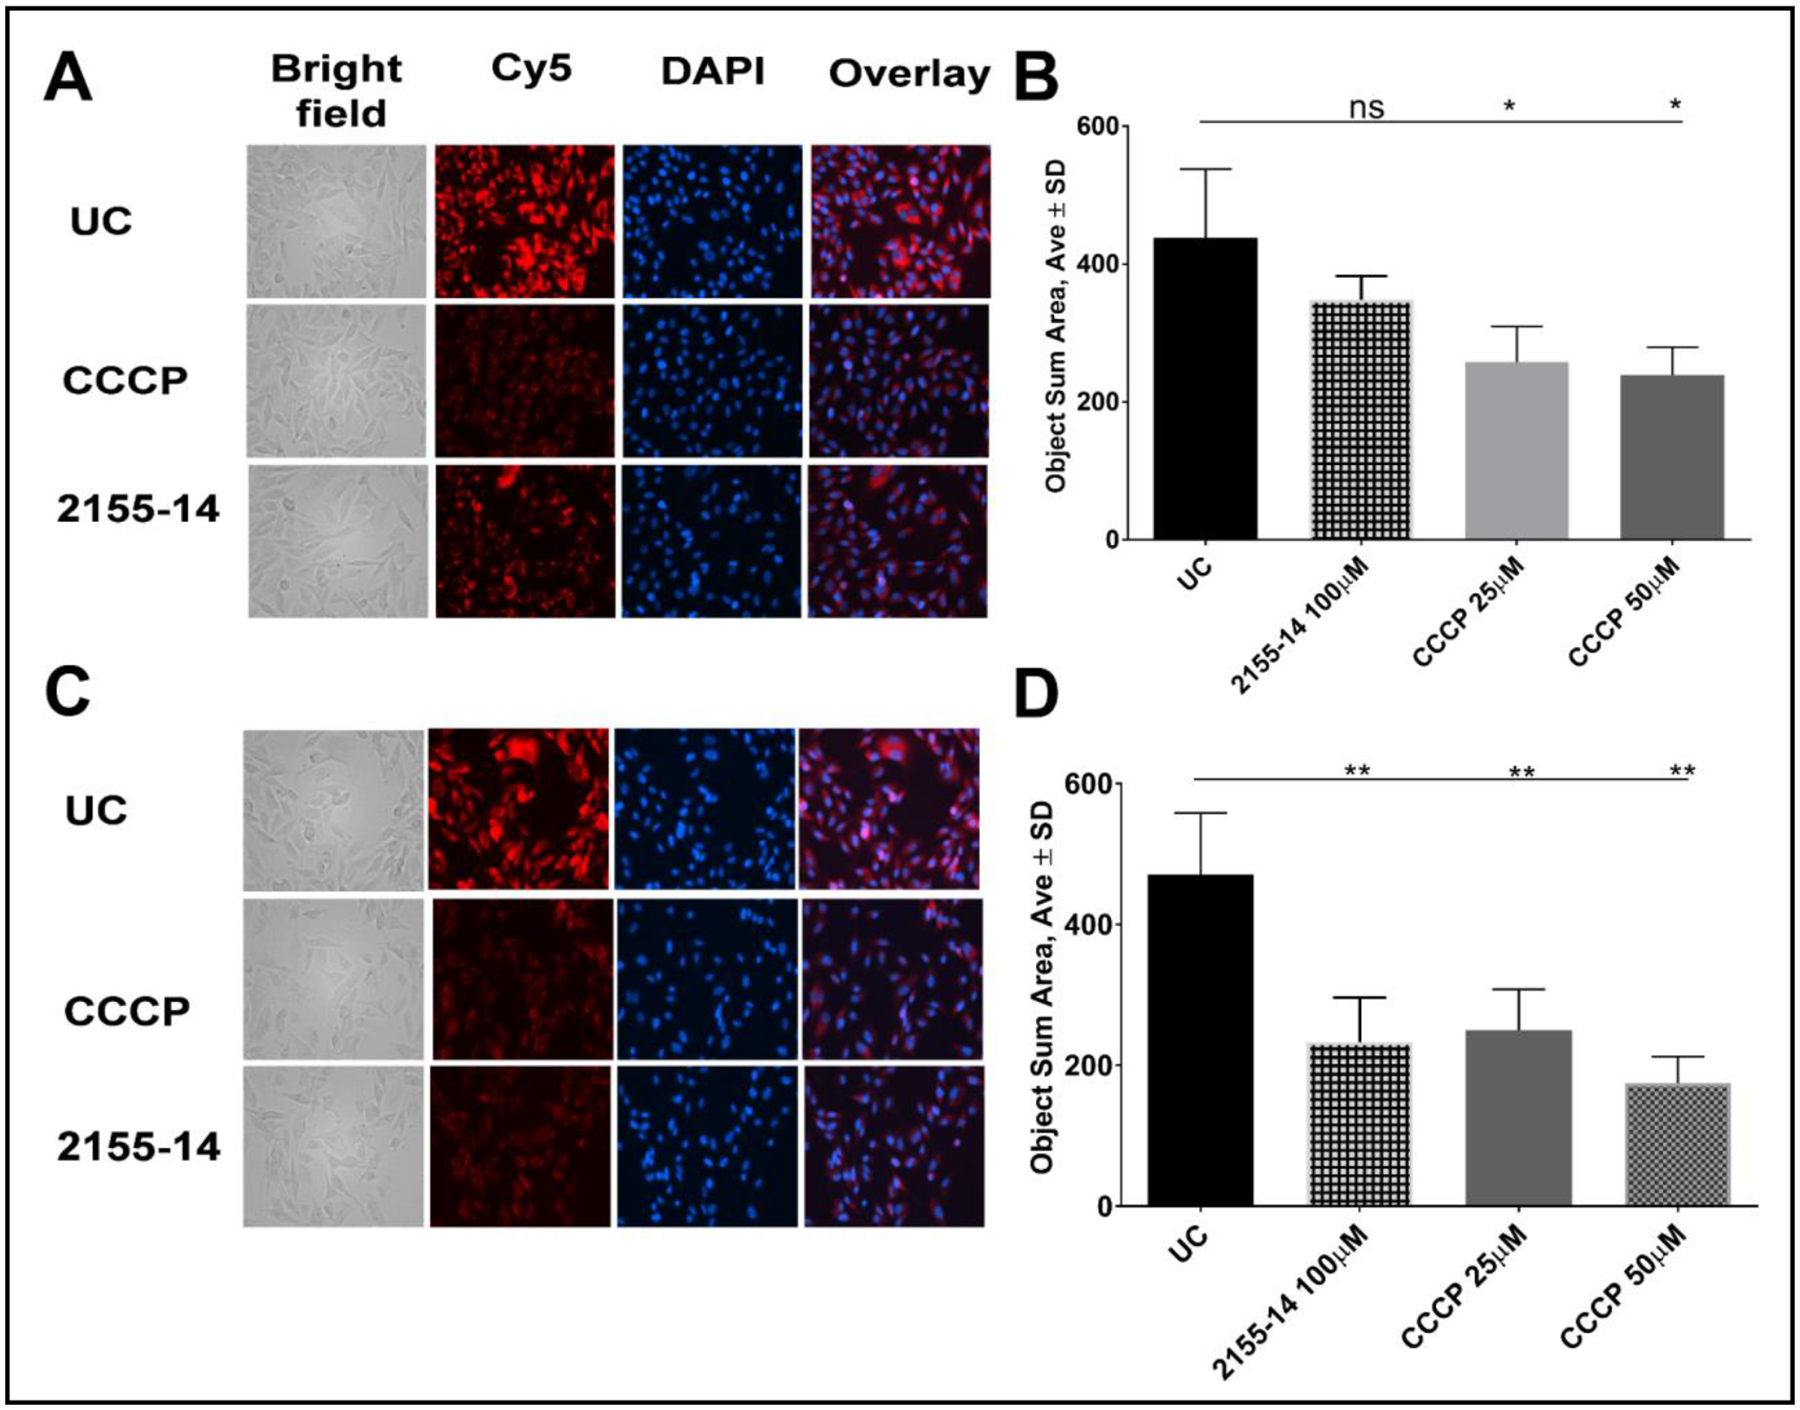
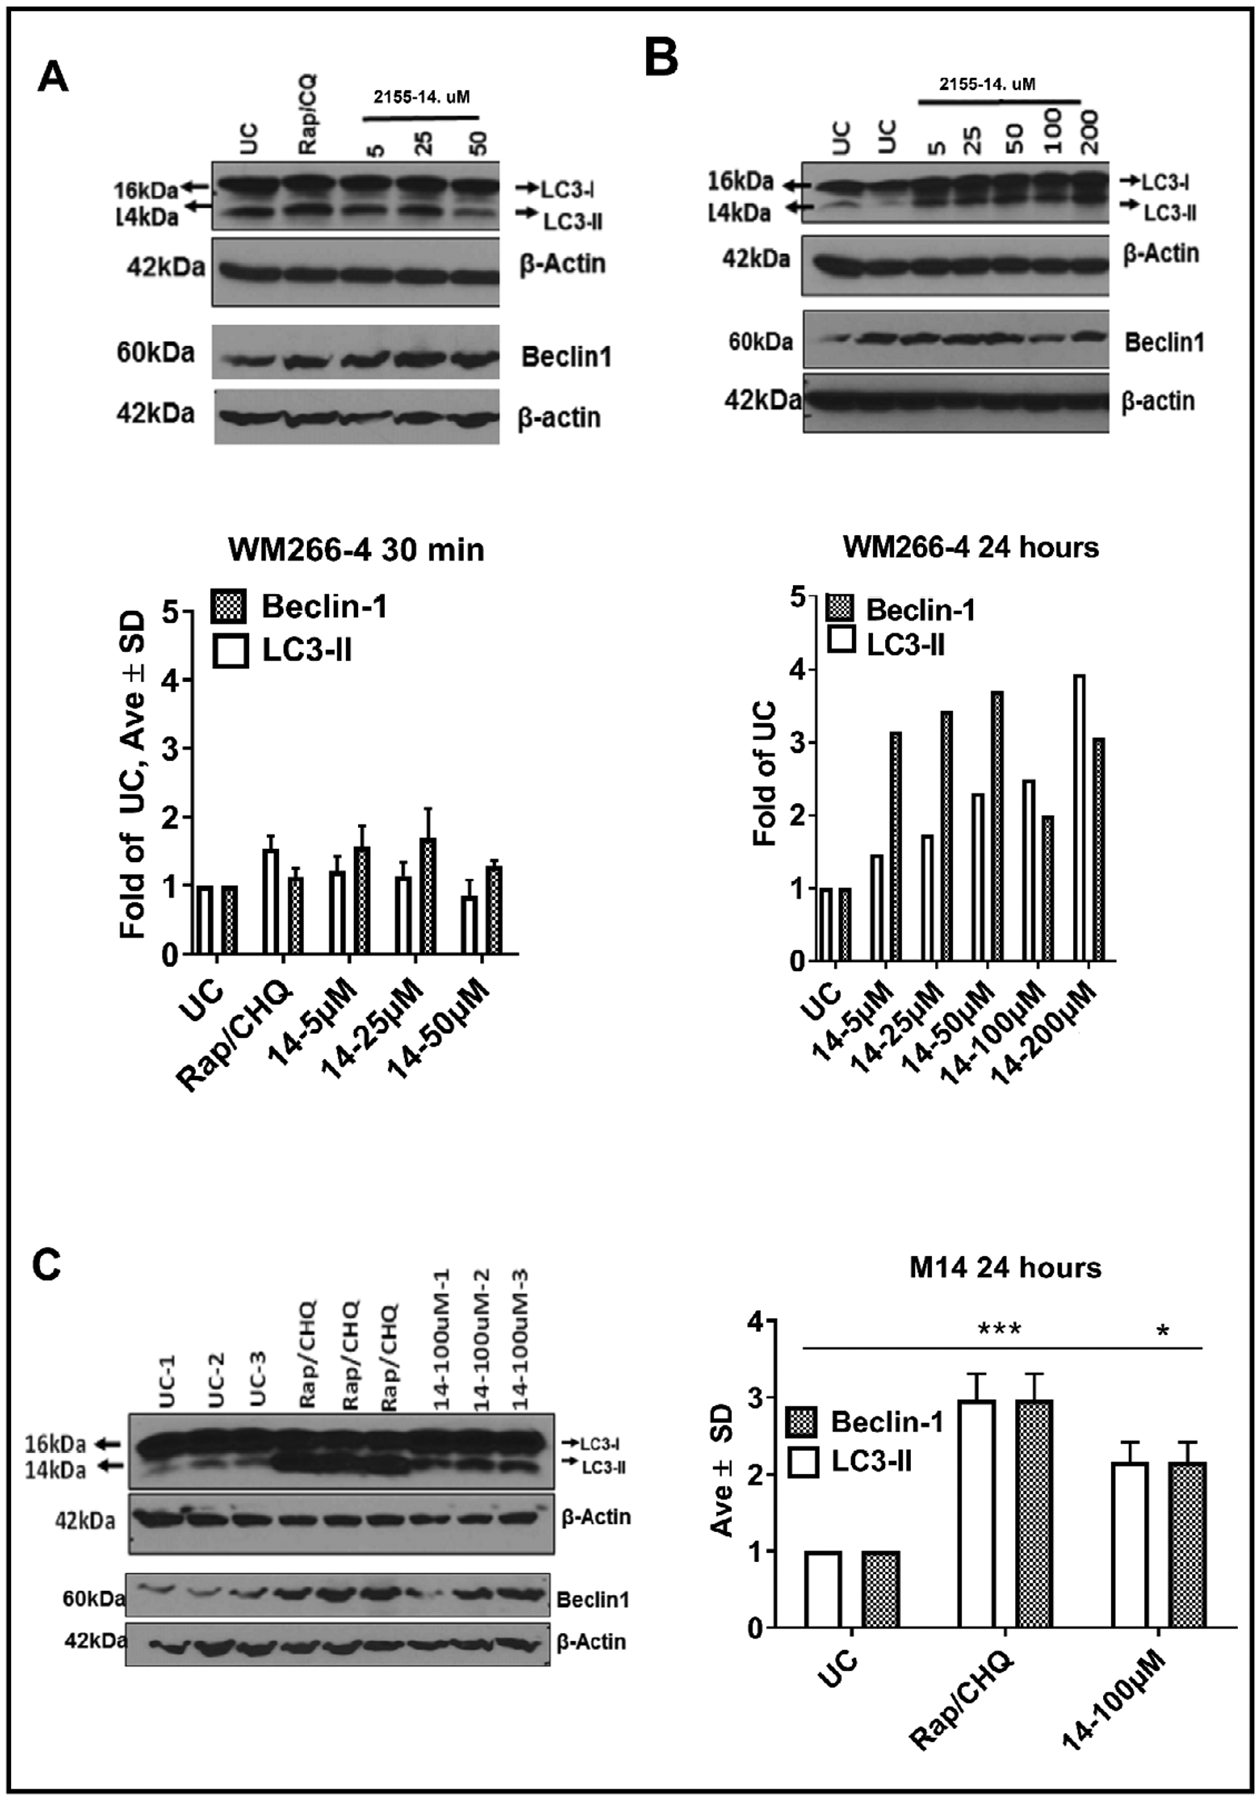
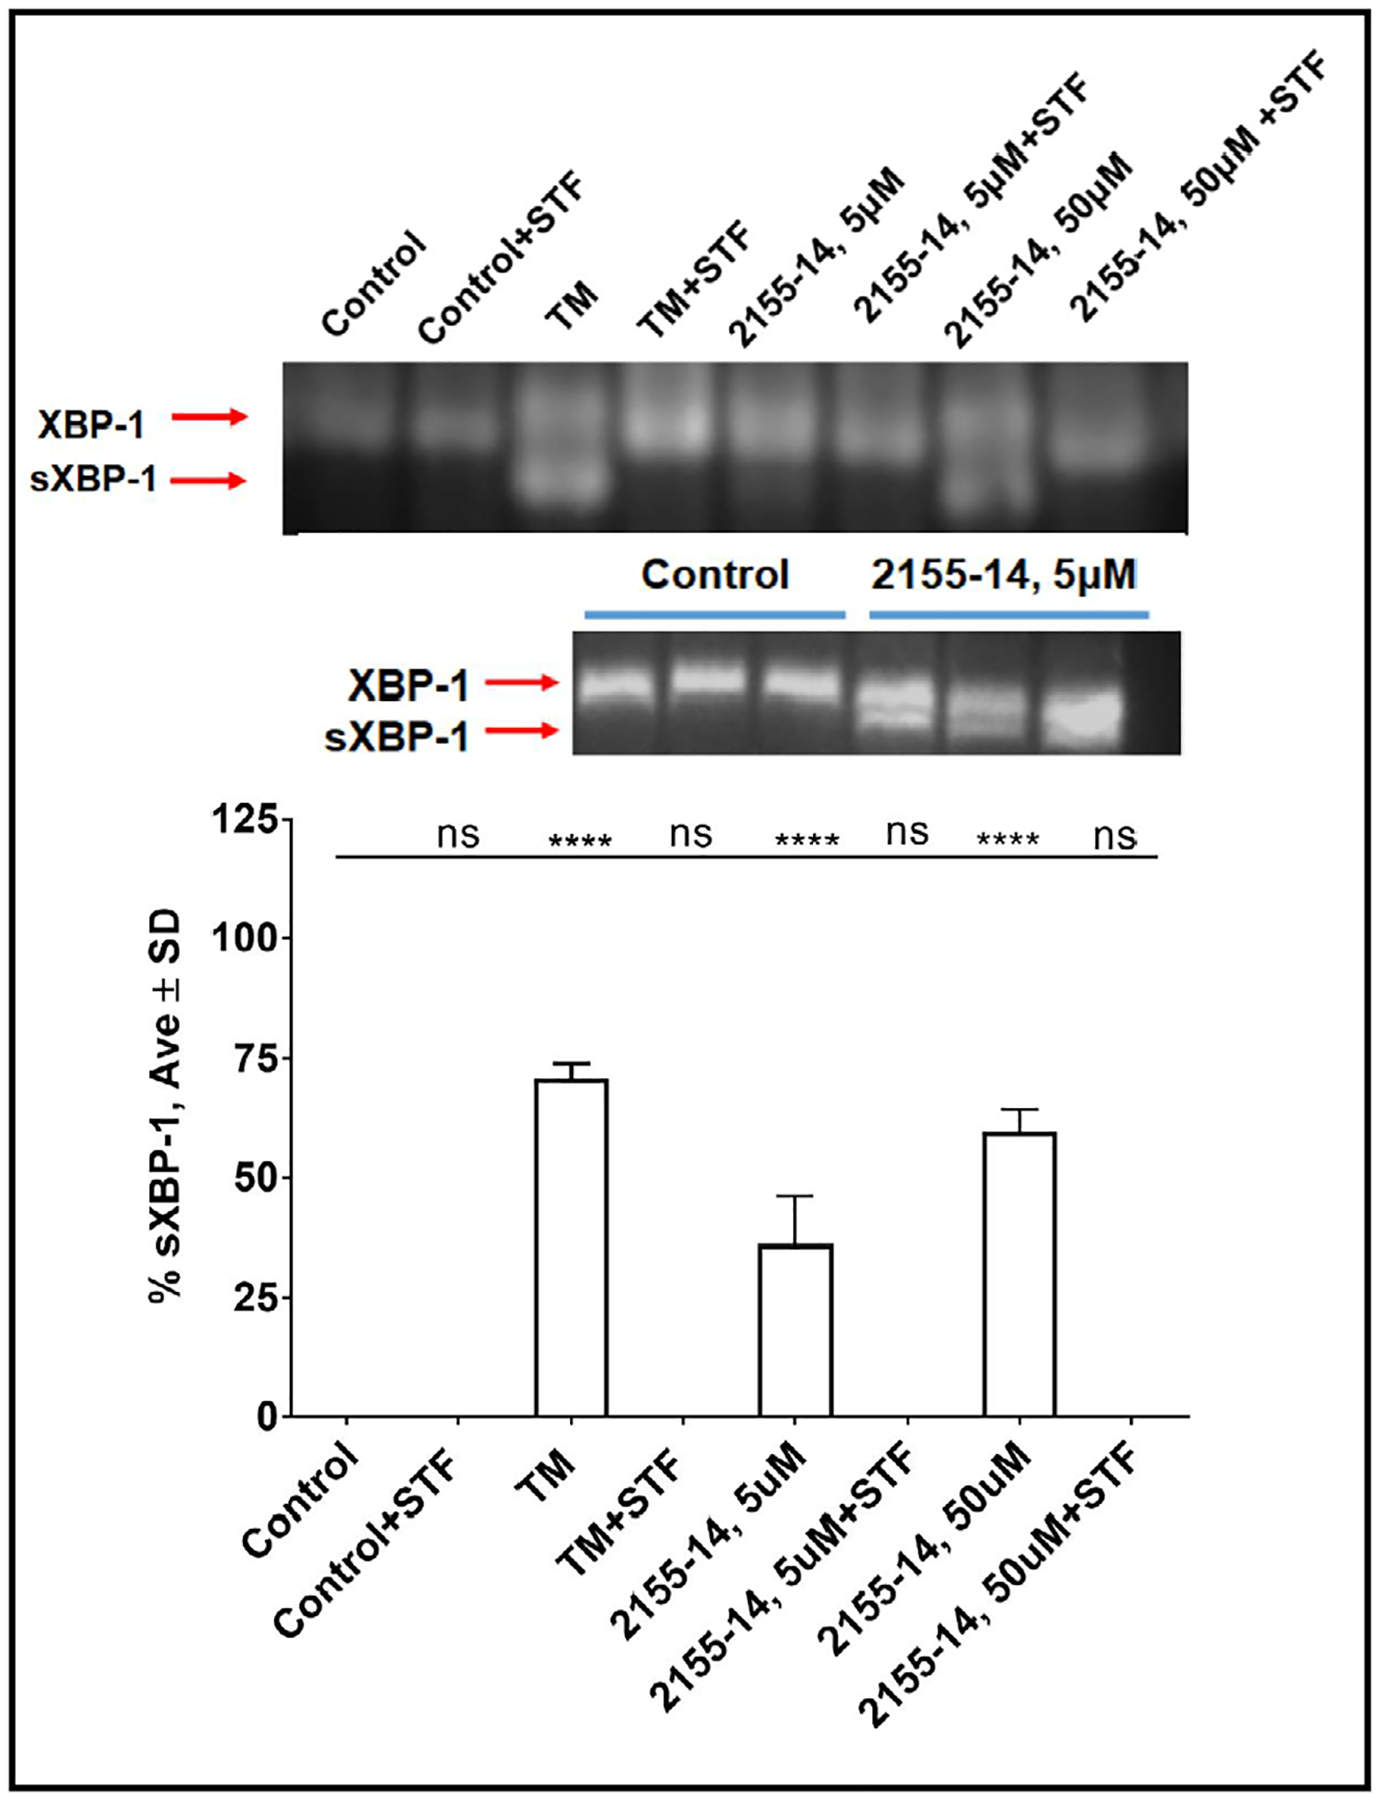
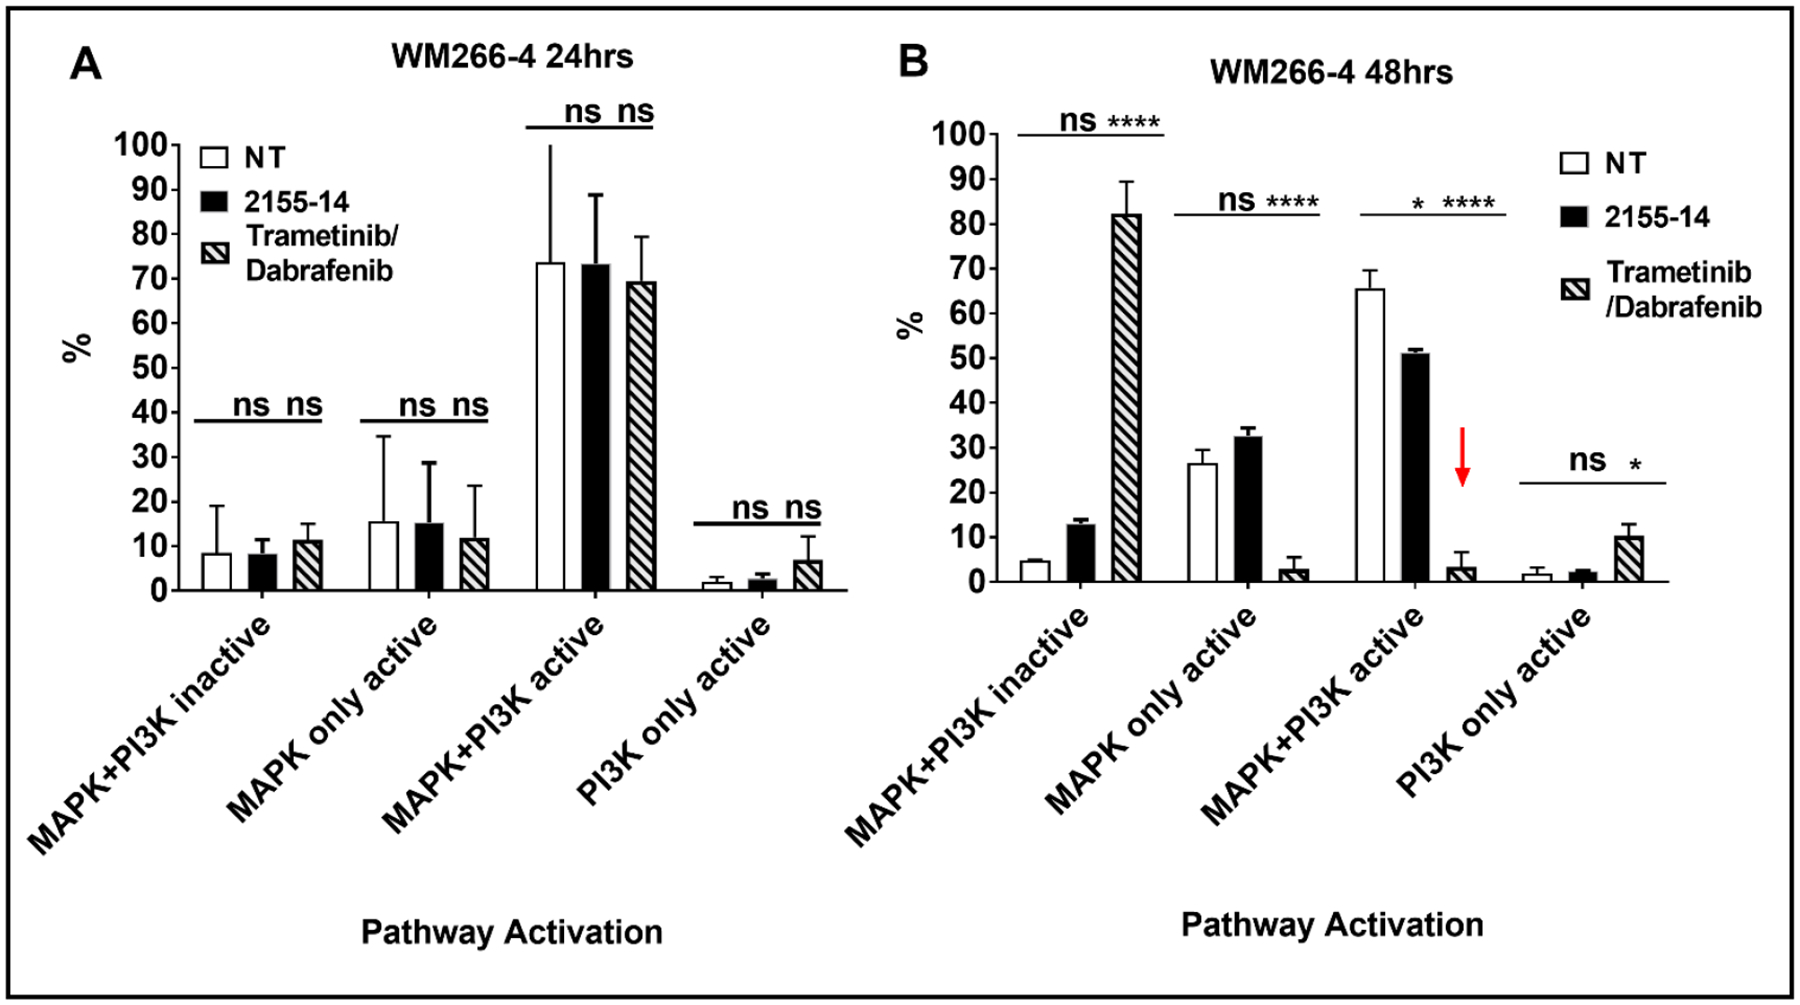
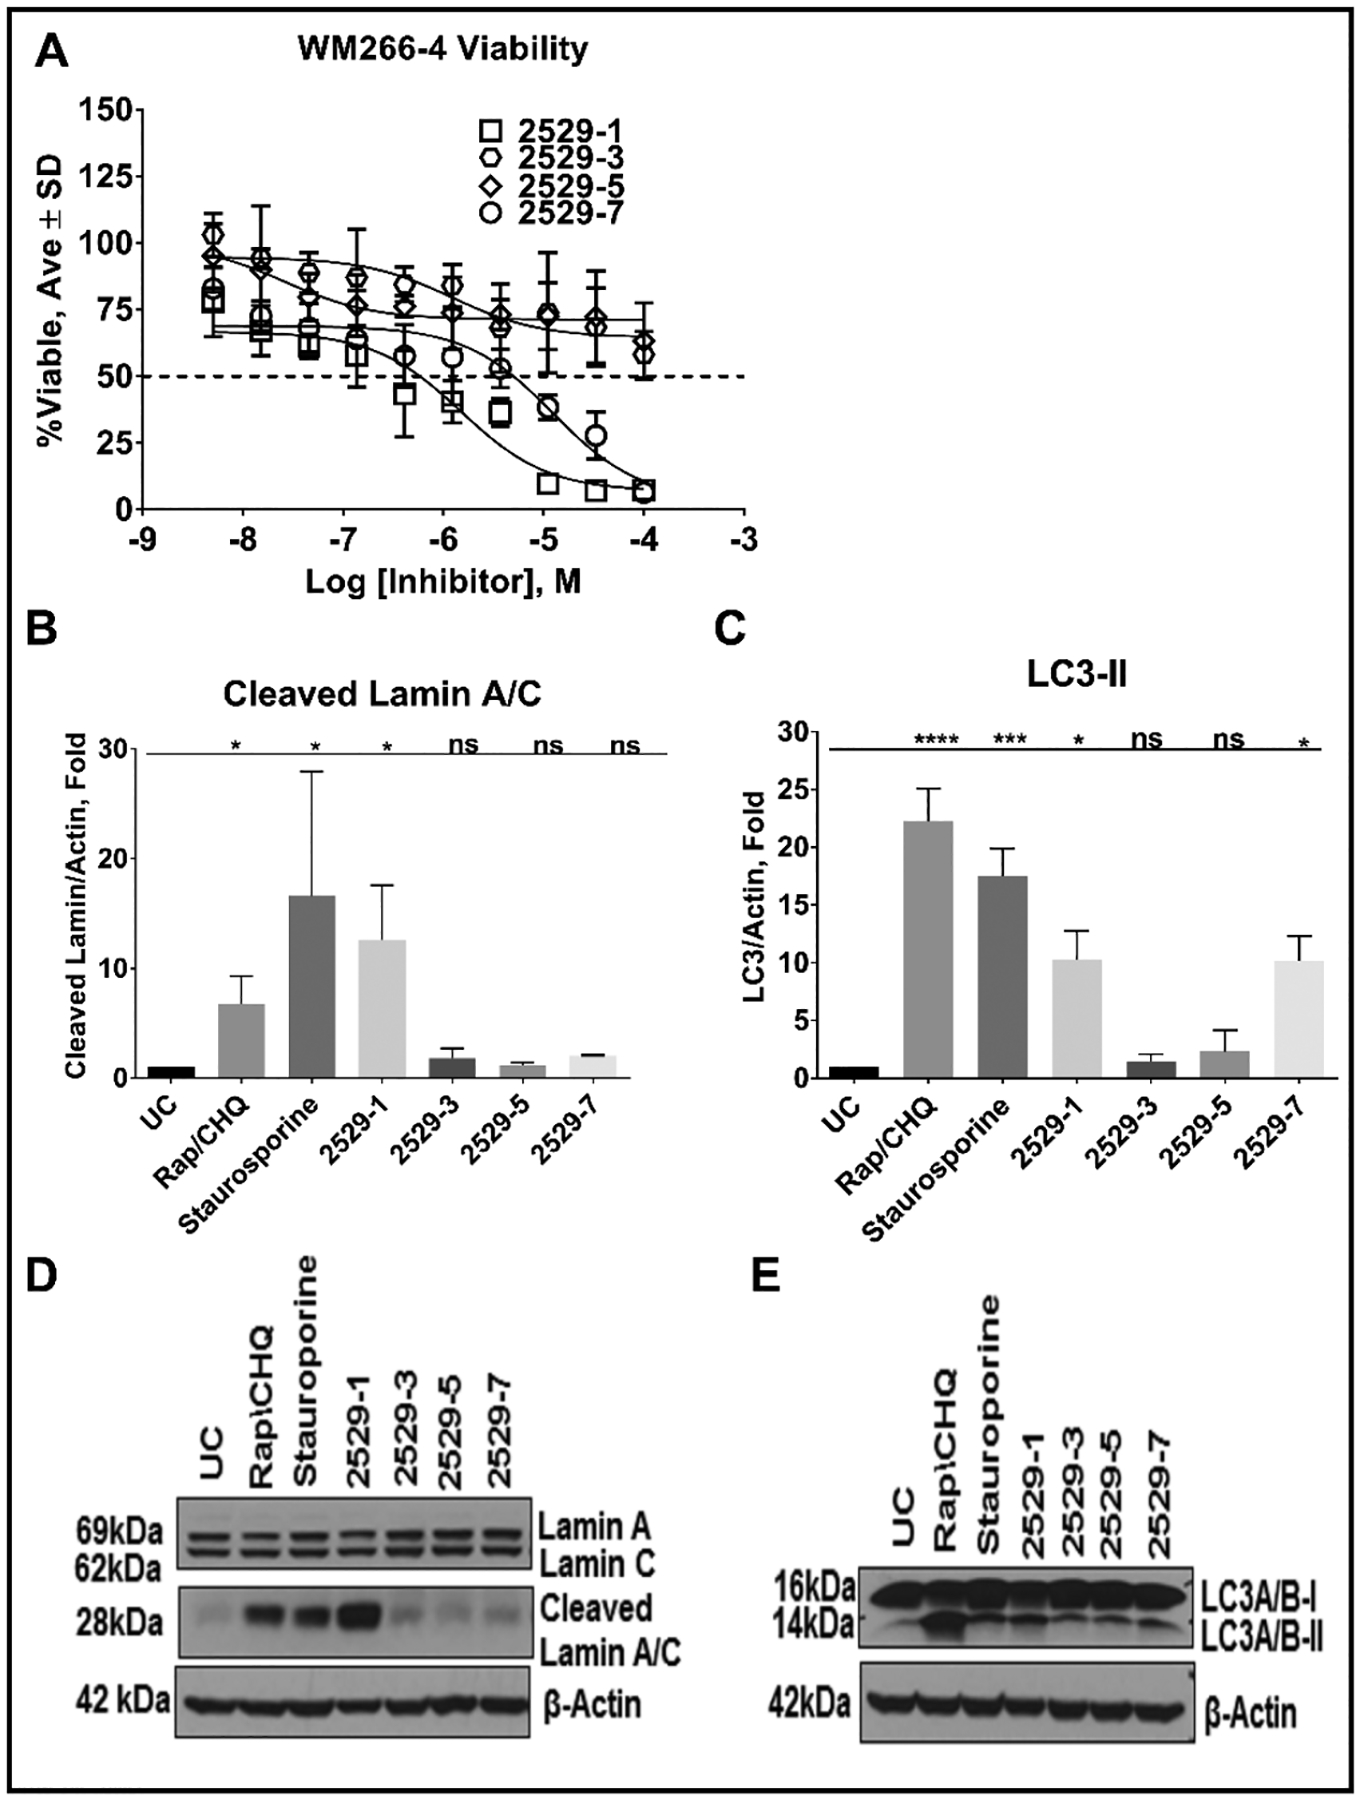
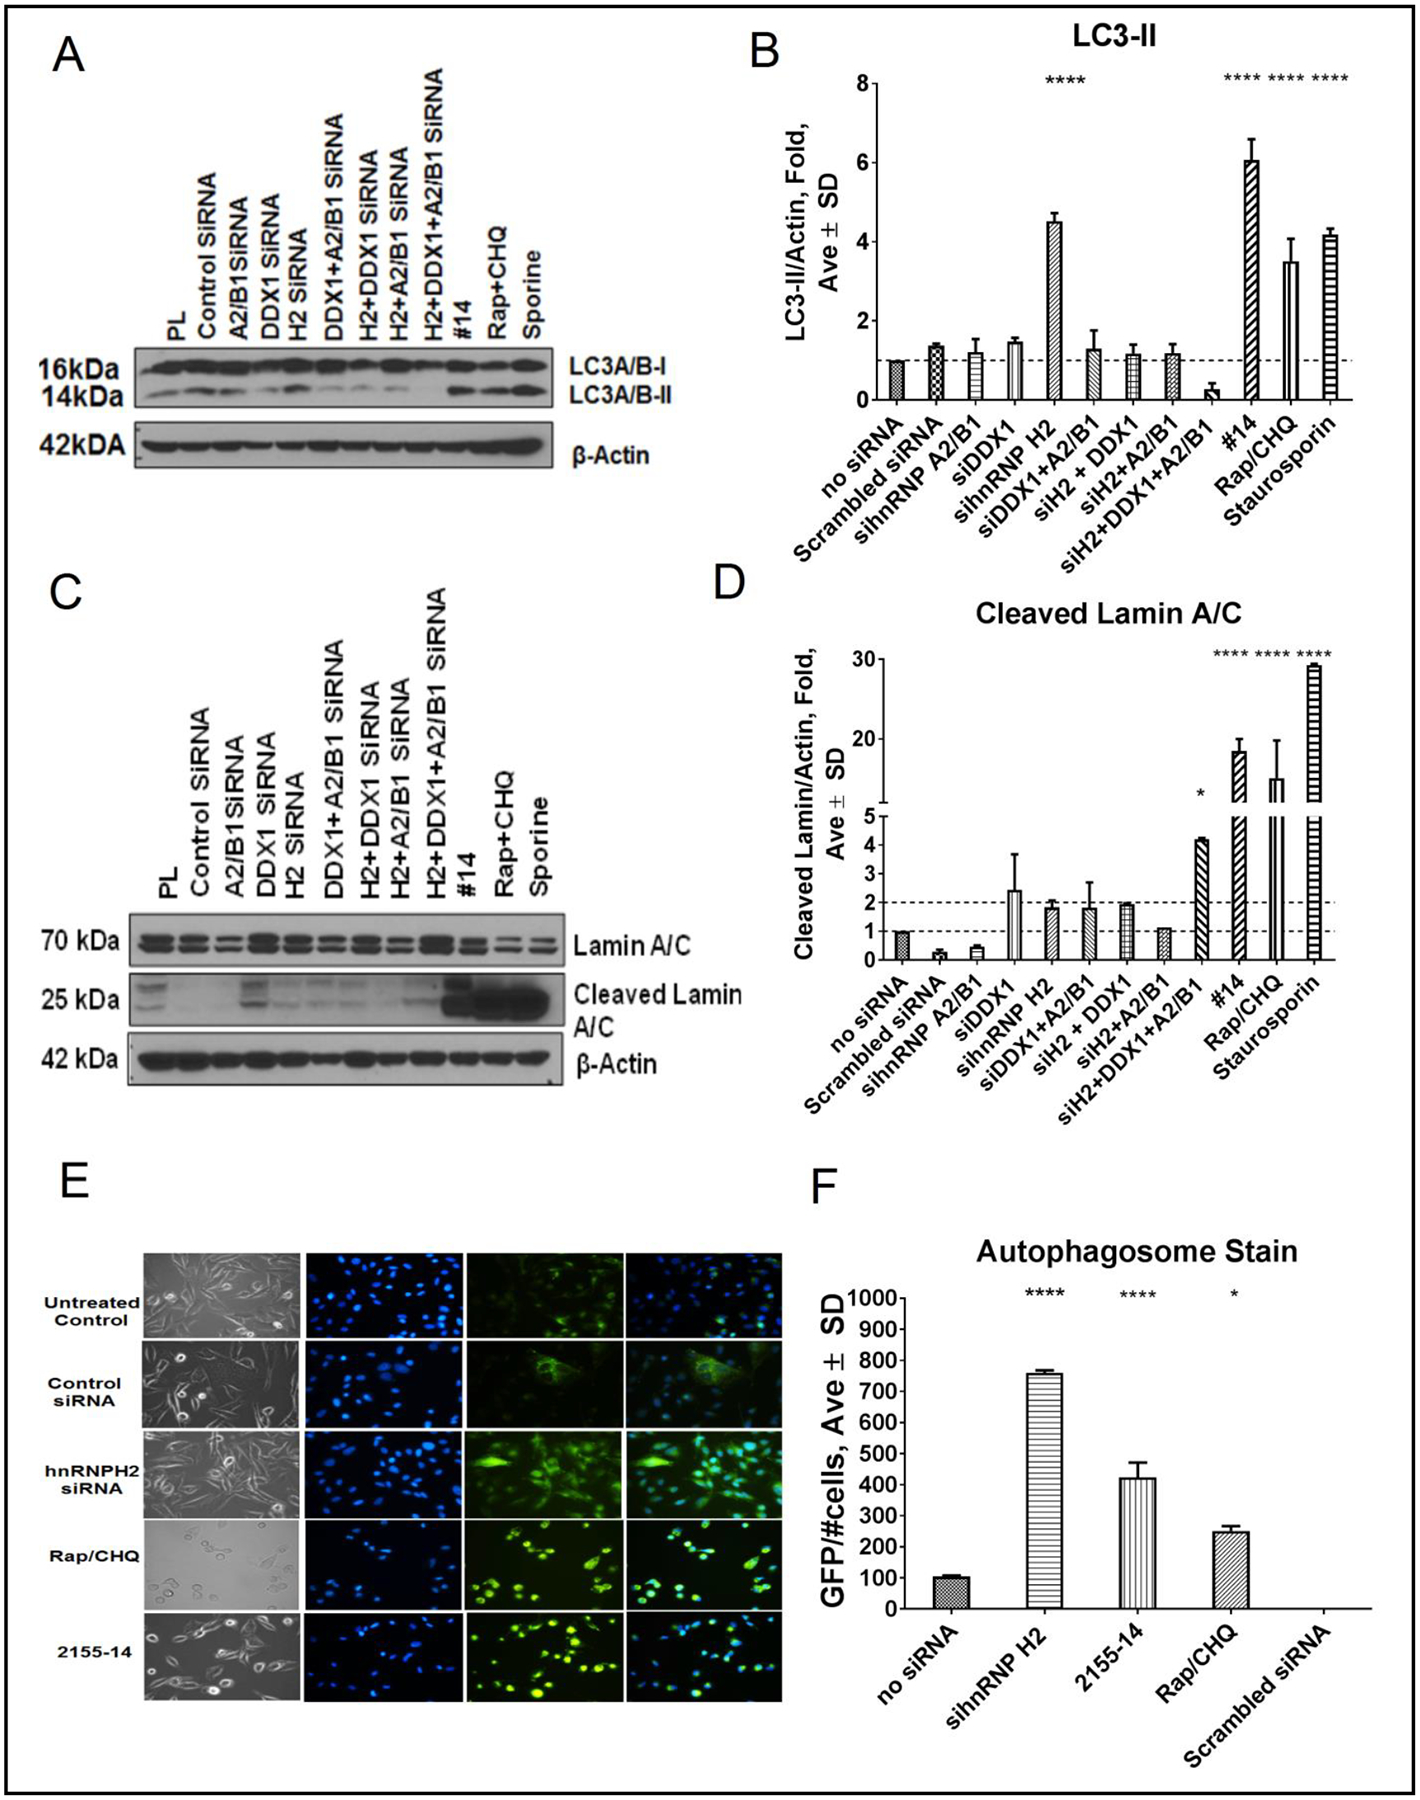
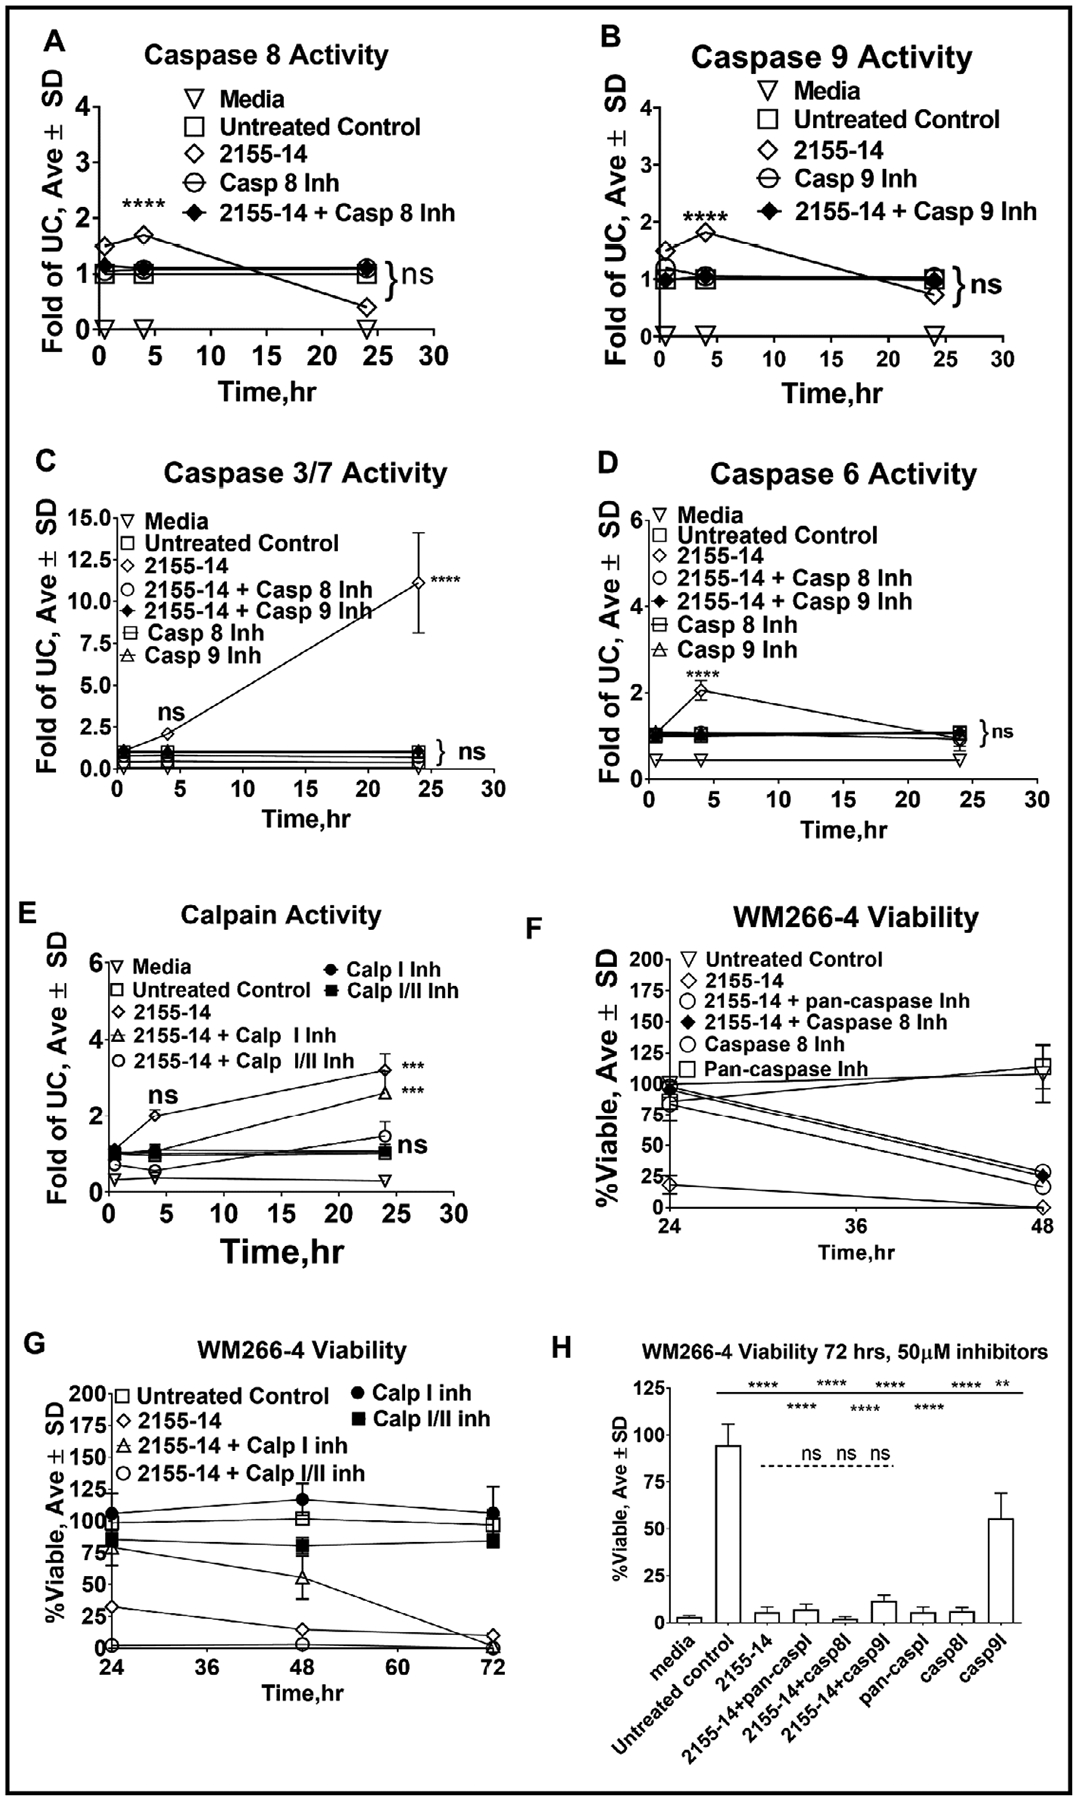
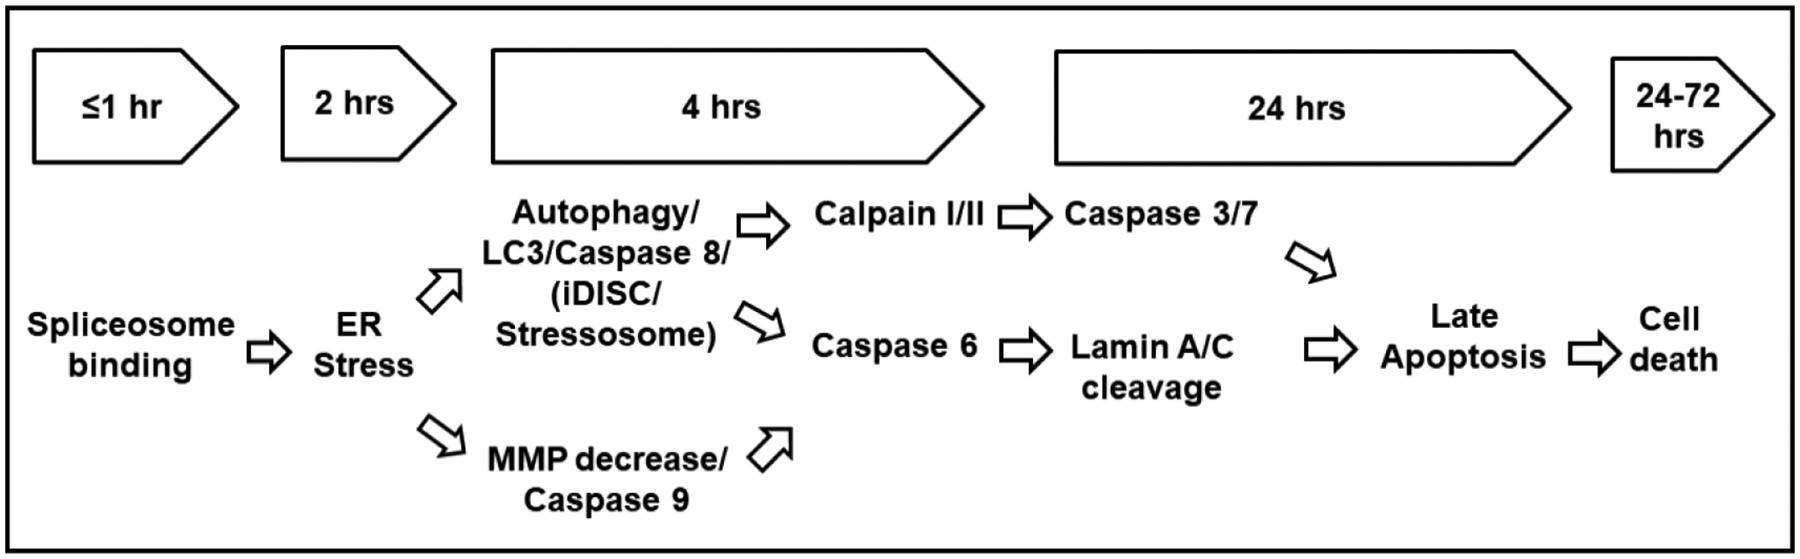
Results: In the present study, we identified ATP-dependent RNA helicase DDX1 and heterogeneous nuclear ribonucleoproteins (hnRNPs) H1, H2 and A2/B1 as targets of anti-melanoma compound 215514. To the best of our knowledge, this is a first report suggesting that these proteins could be targeted for melanoma therapy. Mechanistic investigations showed that 2155-14 induces ER stress leading to potentiation of basal autophagy resulting in melanoma cell death in BRAF and NRAS mutated melanoma cells.

Conclusion: Identification of mode of action of 2155-14 may provide insight into novel therapies against a broad range of melanoma subtypes. These studies were enabled by the novel probe derived from a mixture-based library, an important class of chemical biology tools for discovering novel targets.

Keywords: Autophagy; Mechanism of action; Melanoma; Spliceosomal protein binding; Target identification.


Conflict of interest statement

The authors declare that no conflict of interest exists.

Figures

Fig. 1.
Fig. 1.
Annexin V assay confirms late apoptosis as one of the mechanisms of 2155–14-induced cell death. Starurosporine was used at 1 μM, 2155–14 was used at 100 μM, and pan-caspase inhibitor Z-VAD-FMK was used at 10 μM. Cells treated with 2155–14 and 2155–14+pan-caspase inhibitor have similar distribution of cell populations suggesting lack of pan-caspase inhibitor activity on biological effects of 2155–14 application.
Fig. 2.
Fig. 2.
Autophagy detection in WM266–4 cells using autophagosome dye. (A) Bright field micrographs at 4x magnification of unstained WM266–4 cells in the presence of 2155–14 and 2155–18 4 and 24 h after compound addition. Please note differences in cell morphology as compared to untreated control (UTC). (B) WM266–4 cells stain positive for autophagy at 4 h after addition of 2155–14, but not 2155–18. Nuclei are stained blue. Yellow arrows indicate green puncta signifying autophagosome formation. (C) WM266-4 cells show increased autophagy staining at 24 h after addition of 2155–14, but not 2155–18. Nuclei are stained blue. (D) Autophagy (GFP) channel was used to quantify positive WM266–4 cells. Number of cells present in each well was normalized using DAPI-stained nuclei. Scale bar = 100 μm for all images with 20x magnification and 300 μm for all images with 4x magnification.
Fig. 3.
Fig. 3.
Effect of 2155–14 on mitochondrial potential of WM266–4 cells. (A). Representative images of cells 1 h after addition of compounds; (B) Quantitation of effects of compounds on mitochondrial potential 1 h after compound addition. There is no significance between untreated control and cells treated with 2155–14. One-way analysis of variance (ANOVA) was used followed by Dunnett post hoc test. The data shown are the mean ± SD, n = 4. * - p<0.05; (C). Representative images of cells 4 h after addition of compounds; (D) Quantitation of effects of compounds on mitochondrial potential 1 h after compound addition. One-way analysis of variance (ANOVA) was used followed by Dunnett post hoc test. The data shown are the mean ± SD, n=4. ** - p<0.01; UC – untreated control, CCCP - carbonyl cyanide m-chlorophenyl hydrazine.
Fig. 4.
Fig. 4.
Western blot analysis of WM266–4 and M14 melanoma cells confirms that autophagy is induced by 2155–14. (A) LC3 and beclin-1 representative blots and quantification 30 min after addition of 5–50 μM 2155–14 and 2155–18 to WM266–4 cells. No statistical significance between untreated control and test conditions was observed. (B) LC3 and beclin-1 representative blots and quantification 24 h after addition of 5–200 μM 2155–14 to WM266–4 cells. Dose dependent increase of LC3 and beclin-1 was observed in the case of 2155–14, but not 2155–18. (C) LC3 and beclin-1 representative blots and quantification 24 h after addition of 100 μM 2155–14 to M14 cells. UC – untreated control. Rapamycin/chloroquine (Rap/CHQ) mixture used as a control. One-way analysis of variance (ANOVA) was used followed by Dunnett post hoc test. The data shown were the mean ± SD, n=3. ***** - p<0.0001, *** - p<0.001, ** - p<0.01, * - p<0.05.
Fig. 5.
Fig. 5.
RNA blot analysis of ER stress marker sXBP-1 in WM266–4 cells confirms that 2155–14 induces ER stress. Representative blot and quantification 2 h after addition of 5 μM and 50 μM 2155–14 to WM266–4 cells. % sXBP-1 was calculated as a % of total XBP-1 (total XBP-1 = sXBP-1 (lower band) + XBP-1 (upper band)). sXBP-1 band in 5 μM 2155–14 lane was confirmed by running additional replicates (lower blot). 5 μg/mL tunicamycin (TM) used as a positive control. STF – 60 μM STF-83010, an inhibitor of IRE1 RNase activity responsible for splicing of XBP1 into ER stress marker sXBP1. One-way analysis of variance (ANOVA) was used followed by Dunnett post hoc test. The data shown were the mean ± SD, n=3. **** - p<0.0001, ns – no significance.
Fig. 6.
Fig. 6.
Results of flow cytometry-based assay of MAPK and PI3K pathway activation of WM266–4 cells in presence of 2155–14. (A). 24 h treatment with 100 μM 2155–14. (B) 48 h treatment with 100 μM 2155–14. One-way analysis of variance (ANOVA) was used followed by Dunnett post hoc test. The data shown were the mean ± SD, n=3. ***** - p<0.0001, ns – no significance; 2155–14 Trametinib/dabrafenib combination was tested at 25 μM of each compound. MAPK+PI3K inactive – cell population with neither MAPK nor PI3K pathway activated; MAPK only active - cell population with just MAPK pathway activated; MAPK+PI3K active - cell population with both MAPK and PI3K pathways activated; PI3K only active - cell population with just PI3K pathway activated.
Fig. 7.
Fig. 7.
Effect of 2155–14 and its biotinylated analog on cell viability, levels of LC3 and cleaved lamin A/C in WM266–4 cells. (A) Results of cell viability study after 72 h treatment. (B) Quantification of western blot of cleaved lamin A/C in presence of 100 μM 2155–14/2529–1, 2529–3, 2529–5, and 2529–7. (C) Quantification of western blot of LC3-II in presence of 100 μM 2155–14/2529–1, 2529–3, 2529–5, and 2529–7. (D) Representative western blot of lamin A/C in presence of 100 μM 2155–14/2529–1, 2529–3, 2529–5, and 2529–7. (E) Representative western blot of LC3 in presence of 100 μM 2155–14/2529–1, 2529–3, 2529–5, and 2529–7. One-way analysis of variance (ANOVA) was used followed by Dunnett post hoc test. The data shown are the mean ± SD, n=3. ***** - p<0.0001, *** - p<0.001, ** - p<0.01, * - p<0.05, ns - not significant. Rap/CHQ = Rapamycin (5 μM)/Chloroquine (10 μM). Staurosporine was used at 1 μM. Note that 2529–3 and 2529–5 did not significantly increase levels of cleaved lamin A/C and LC3-II explaining their lower potency against WM266–4 cells. 2529–7 increased LC3-II to the levels of 2155–14/2529–1, while failing to increase levels of cleaved lamin A/C.
Fig. 8.
Fig. 8.
SDS-PAGE of pulldown of WM266–4 cell lysates incubated with biotinylated analogs of 2155–14 pre-complexed with streptavidin beads. (A) WM266–4 cell lysates incubated for 24 h. (B) M14 cell lysates incubated for 24 h. (C) WM266–4 cell lysates incubated for 1 h. Note that 1 h incubation is missing band 1 present in 24 h incubation experiments in either WM266–4 or M14 cells. Note that bands 1–4 appear in both tested melanoma cell lines suggesting a common target for 2155–14. (D) Repeat pulldown experiment with 2529–7 confirms bands 1–4, but not bands 5–6. Bands 1–4 were excised and sent for identification. Pulldown experiment was repeated three times. Protein identification was performed twice on bands from two independent pulldown experiments.
Fig. 9.
Fig. 9.
Genomic confirmation of DDX1, hnRNP H2, and hnRNP A2/B1 as targets of 2155–14. (A) Western blot of WM266–4 lysates validates DDX1, hnRNP H2, and hnRNP A2/B1 as binding targets of biotinylated analog of 2155–14, 2529–7. (B) DDX1, hnRNP H2, and hnRNP A2/B1 expression is knocked down by the corresponding siRNAs. (C,D,E) WM266–4 cell viability after treatment with DDX1, hnRNP H2, and hnRNP A2/B1 siRNAs and combinations thereof at concentrations which produced complete knockdown of respective proteins as shown in (B). One-way analysis of variance (ANOVA) was used followed by Dunnett post hoc test. The data shown were the mean ± SD, n=6. ***** - p<0.0001, *** - p<0.001, ** - p<0.01, * - p<0.05, ns = no significance. (F) WM266–4 viability time course assay in the presence of dose response of 2155–14. Please note similarity of time dependent loss of viability of WM266–4 starting at 48 h in the presence of siRNAs and 2155–14.Please note similarity of time dependent loss of viability of WM266–4 starting at 48 h in the presence of siRNAs and 2155–14.
Fig. 10.
Fig. 10.
Effect of siRNA knockdown on LC3-II and lamin A/C levels. (A) Representative western blot of LC3-II in WM266–4 lysates in response to siRNA treatment and (B) its quantification. (C) Representative western blot of lamin A/C in WM266–4 lysates in response to siRNA treatment and (D) its quantification. (E) WM266–4 cells showed increased autophagosome staining at 24 h after addition of hnRNP H2 siRNA and 2155–14. Nuclei are stained blue. (F) Autophagy (GFP) channel was used to quantify positive WM266–4 cells. Number of cells present in each well was normalized using DAPI-stained nuclei. One-way analysis of variance (ANOVA) was used followed by Sidak multiple comparisons test. The data shown were the mean ± SD, n=3. ***** - p<0.0001, *** - p<0.001, ** - p<0.01, * - p<0.05, rest = no significance.
Fig. 11.
Fig. 11.
Confirmation of DDX1, hnRNP H2, and hnRNP A2/B1 as targets of 2155–14. (A) Western blot of hnRNP H2 in WM266–4 melanoma cells and melanocytes. (B) Western blot of WM266–4 melanoma and HEK293 cell lysates. Live cells were incubated in presence and absence of 2155–14. (C) Quantification of western blots for (B). (D) Western blot of DDX1, hnRNP H2, and hnRNP A2/B1 in WM266–4 cell lysates after digestion with pronase in the presence and absence of 2155–14. (E) Quantification of western blots for (D). (F) Western blot of DDX1, hnRNP H2, and hnRNP A2/B1 in HEK293 cell lysates after digestion with pronase in the presence and absence of 2155–14. (E) Quantification of western blots for (F). One-way analysis of variance (ANOVA) was used followed by Dunnett post hoc test. The data shown were the mean ± SD, n=3. ***** - p<0.0001, *** - p<0.001, ** - p<0.01, * - p<0.05, rest = no significance.
Fig. 12.
Fig. 12.
Effect of 2155–14 on caspase and calpain activity and its inhibition on viability of WM266–4 cells. (A) Caspase 8 activity assay results. (B) Caspase 9 activity assay results. (C) Caspase 3/7 activity assay results. (D) Caspase 6 activity assay results. (E) Calpain I/II activity assay results. (F) Cell viability time course after pre-treatment with 10 μM caspase inhibitors. (G) Cell viability time course after pretreatment with 25 μM calpain inhibitors. (H) Cell viability 72 h after pre-treatment with 50 μM caspase inhibitors. One-way analysis of variance (ANOVA) was used followed by Dunnett post hoc test. The data shown were the mean ± SD, n=6. ***** - p<0.0001, *** - p<0.001, ** - p<0.01, * - p<0.05, ns – no significance; 2155–14 was tested at 100 μM.
Fig. 13.
Fig. 13.
Effect of pretreatment of WM266–4 cells with caspase inibitors on levels of LC3-II and lamin A/C cleavage in the presence of 2155–14. (A) Representative western blot of lamin A/C in the presence of 10 μM caspase inibitors. (B) Representative western blot of LC3 in the presence of 10 μM caspase inibitors. (C) Quantification of western blot of cleaved lamin A/C in the presence of 10 μM caspase inibitors. (D) Quantification of western blot of LC3-II in the presence of 10 μM caspase inibitors. (E) Representative western blot of lamin A/C in the presence of 50 μM caspase inibitors. (F) Representative western blot of LC3 in the presence of 50 μM caspase inibitors. (G) Quantification of western blot of cleaved lamin A/C in the presence of 50 μM caspase inibitors. (H) Quantification of western blot of LC3-II in the presence of 50 μM caspase inibitors. One-way analysis of variance (ANOVA) was used followed by Dunnett post hoc test. The data shown were the mean ± SD, n=3. ***** - p<0.0001, *** - p<0.001, ** - p<0.01, * - p<0.05, ns - no significance. 2155–14 was tested at 100 μM. Rap/CHQ = Rapamycin (5 μM)/Chloroquine (10 μM). Caspase 2 inh = Z-VDVAD-FMK, Caspase 6 inh = Z-VEID-FMK, Caspase 8 inh = Z-IETD-FMK, pan-Caspase inh = Z-VAD-FMK.
Fig. 14.
Fig. 14.
Effect of pre-treatment of WM266–4 cells with autophagy inhibitors on viability and levels of LC3-II and lamin A/C cleavage in the presence of 2155–14. (A) Representative western blot of lamin A/C. (B) Representative western blot of LC3. (C) Quantification of western blot of lamin A/C. 2155–14 was tested at 100 μM, LY and hydroxychloroquine (HCQ) were tested at 10 μM. (D) Quantification of western blot of LC3. The data shown are the mean ± SD, n=3. (E) Viability of WM266–4 cells after pre-treatment with autophagy inibitors in the presence of 2155–14. The data shown were the mean ± SD, n=6. One-way analysis of variance (ANOVA) was used followed by Dunnett post hoc test. ***** - p<0.0001, *** - p<0.001, ** - p<0.01, * - p<0.05, ns - no significance.
Fig. 15.
Fig. 15.
Effect of pretreatment of WM266–4 cells with ER stress inhibitors on viability in the presence of 2155–14. (A) WM266–4 cell viability 24 h after 2155–14 addition. (B) WM266–4 cell viability 72 h after 2155–14 addition. 2155–14 was tested at 100 μM, STF-83010 (STF) was tested at 60 μM, N-acetyl cysteine (NAC) was tested at 10 μM, and GSK2606414 (GSK) was tested at 1 μM. The data shown were the mean ± SD, n=6. One-way analysis of variance (ANOVA) was used followed by Dunnett post hoc test. ***** -p<0.0001, *** - p<0.001, ** - p<0.01, * - p<0.05, ns - no significance.
Fig. 16.
Fig. 16.
Proposed mechanism of action of 2155–14.

Similar articles

Cited by

References

    1. National Cancer Institute: Surveillance, Epidemiology, and End Results Program: Turning Cancer Data Into Discovery. NIH, 2014. URL: https://seer.cancer.gov/
    1. World Cancer Research Fund: Skin cancer statistics, 2019. URL: https://www.wcrf.org/dietandcancer/cancer-trends/skin-cancer-statistics
    1. Melanoma Research Foundation: Melanoma Facts and Stats, 2018. URL: https://melanoma.org/melanomaeducation/understand-melanoma/facts-stats/
    1. Bray F, Ferlay J, Soerjomataram I, Siegel RL, Torre LA, Jemal A: Global cancer statistics 2018: GLOBOCAN estimates of incidence and mortality worldwide for 36 cancers in 185 countries. CA Cancer J Clin 2018;68:394–424. - PubMed
    1. See: Active melanoma clinical trials, by NIH/NCI. URL: https://clinicaltrials.gov/.

MeSH terms

Substances