. 2019 Oct 1:8:e49278.
doi: 10.7554/eLife.49278.

H3K9me2 orchestrates inheritance of spatial positioning of peripheral heterochromatin through mitosis

Affiliations

H3K9me2 orchestrates inheritance of spatial positioning of peripheral heterochromatin through mitosis

Andrey Poleshko et al. Elife. .

Abstract

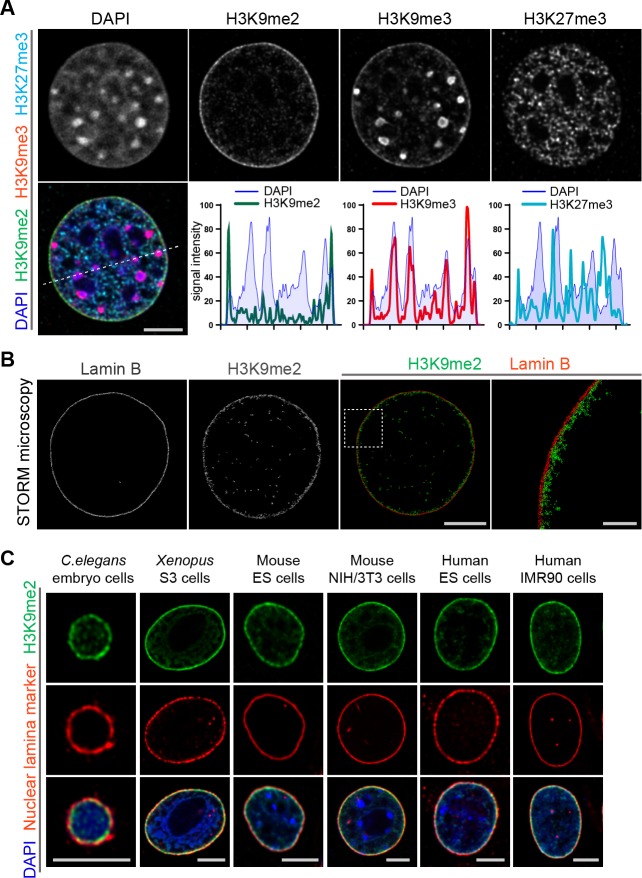
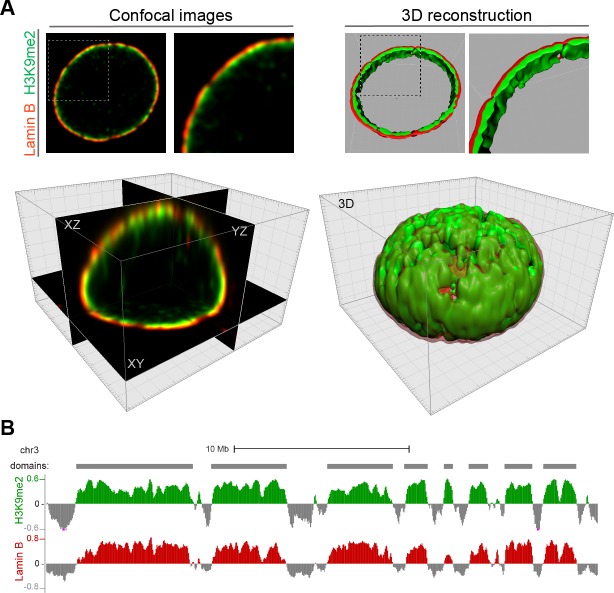
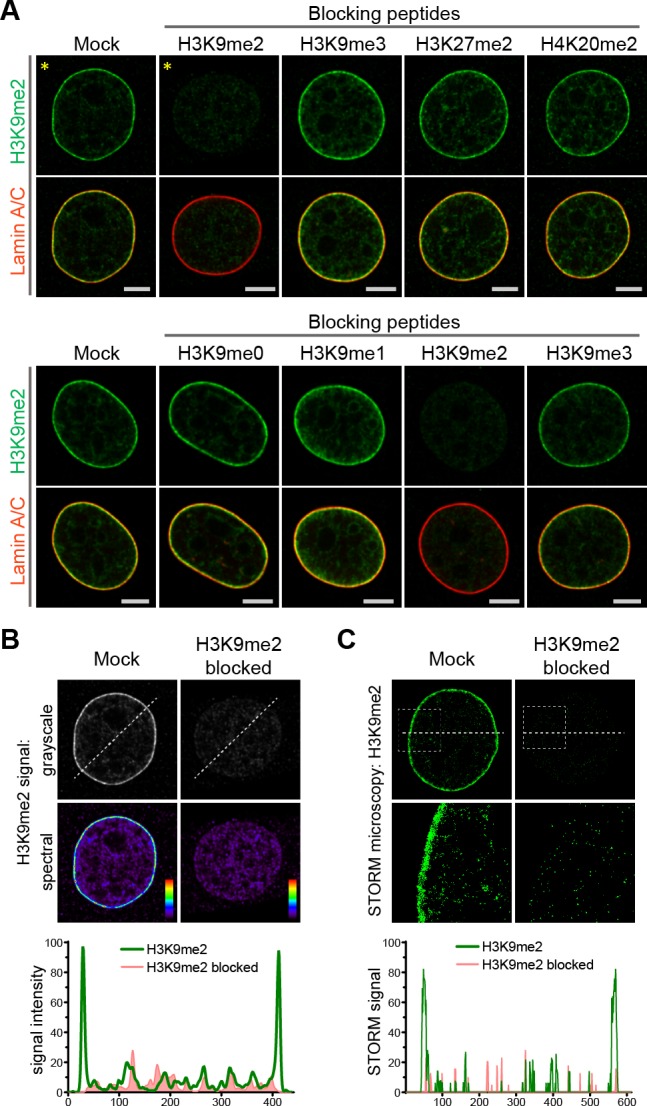
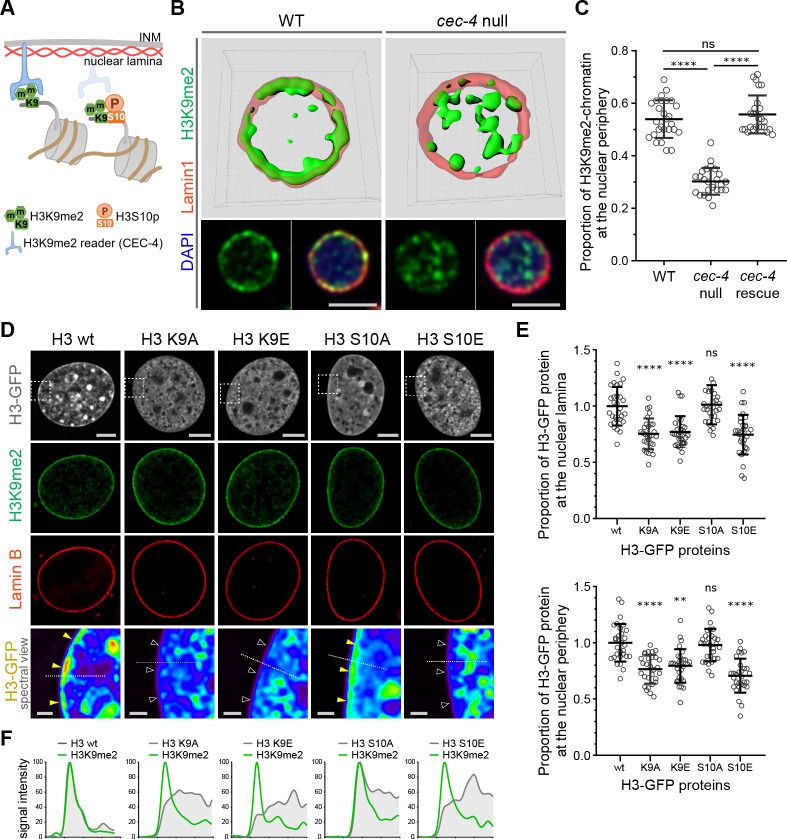
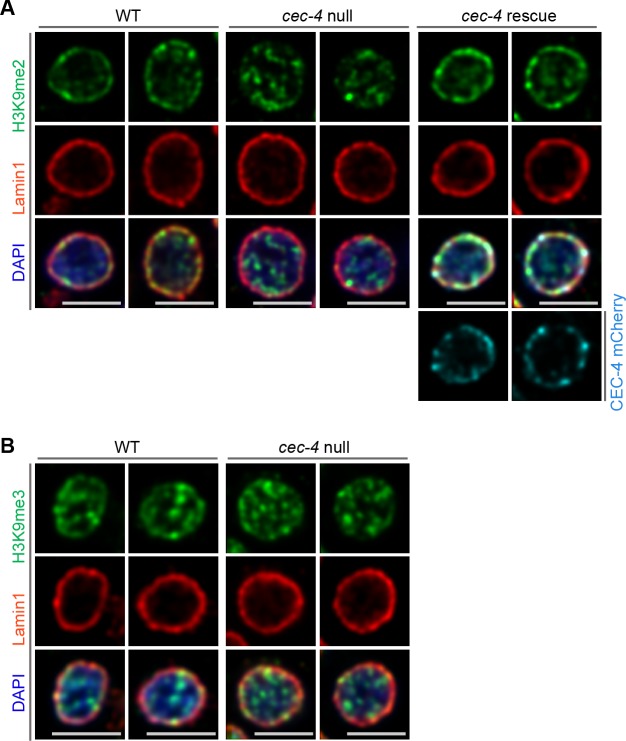
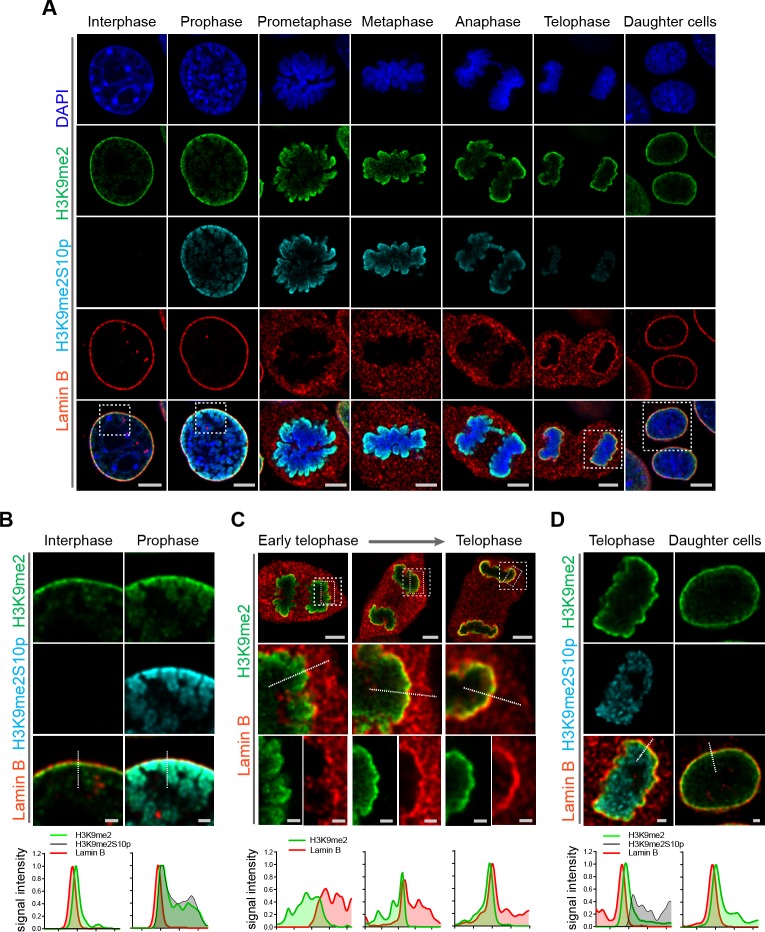
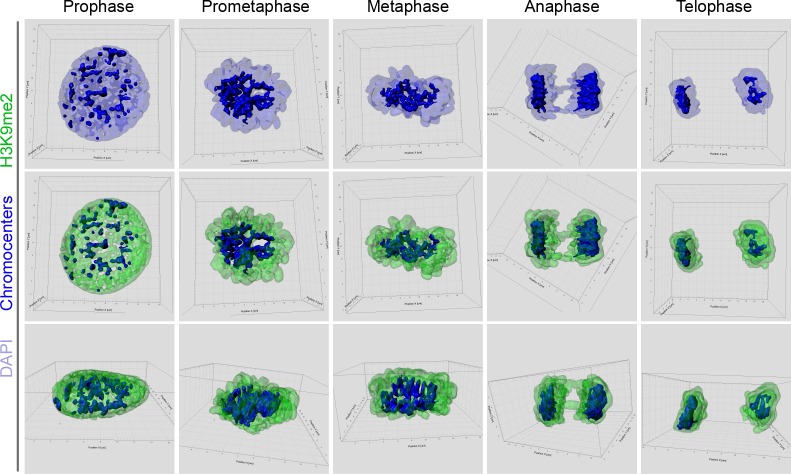
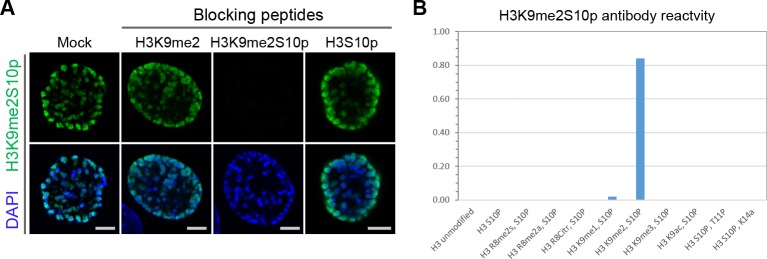
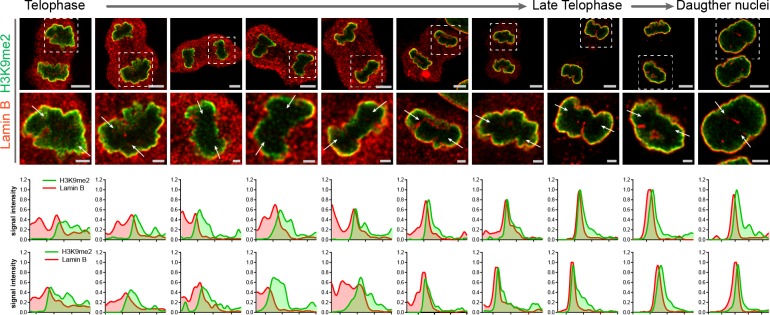
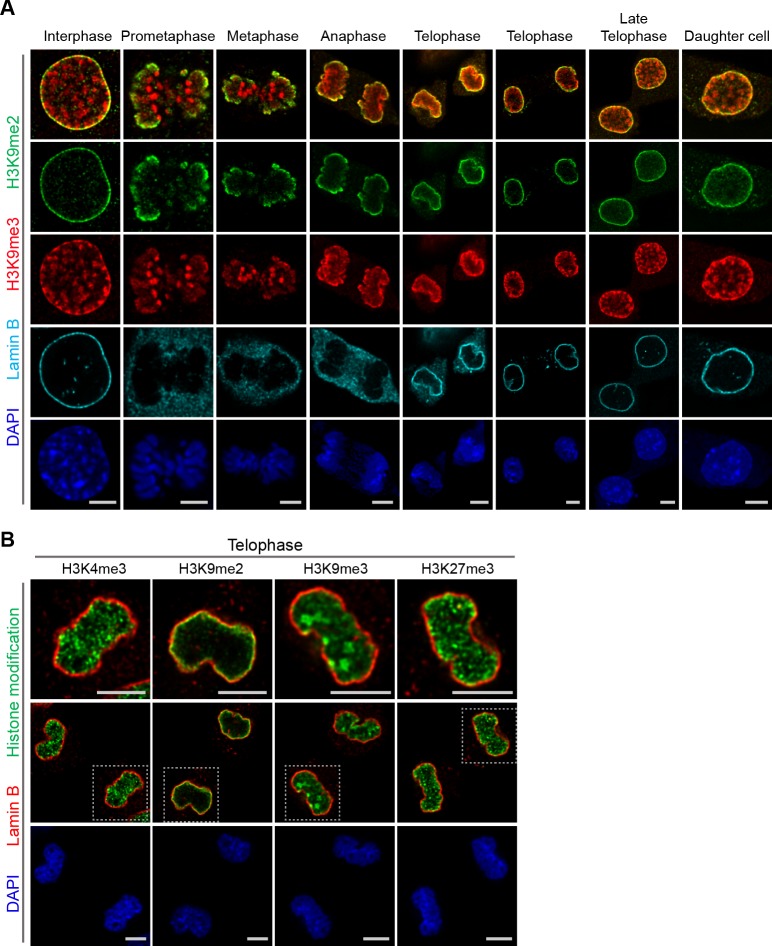
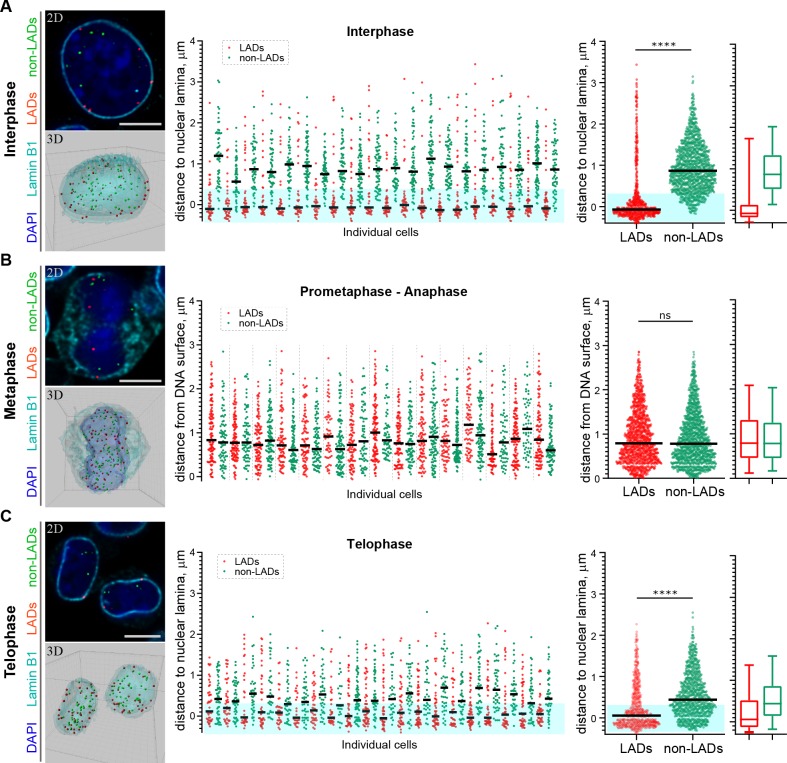
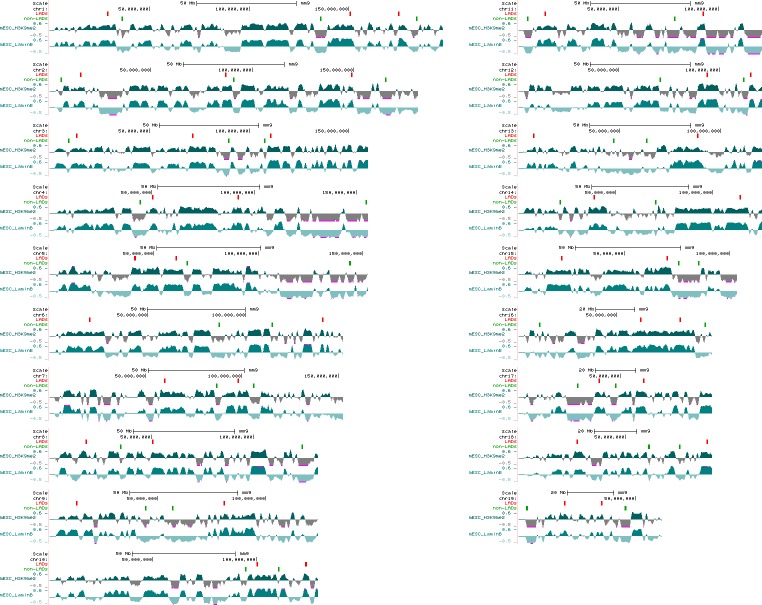
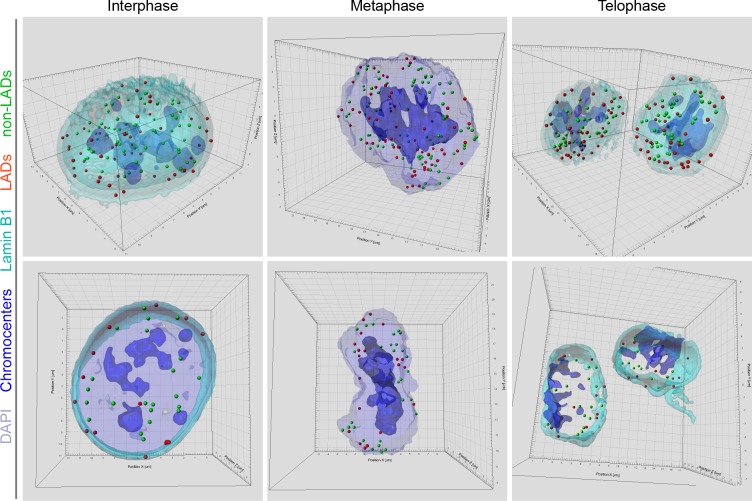
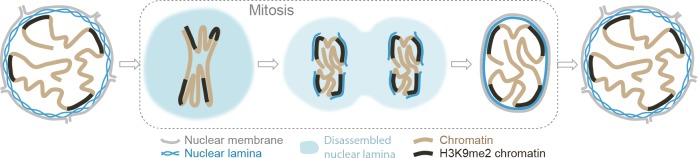
Cell-type-specific 3D organization of the genome is unrecognizable during mitosis. It remains unclear how essential positional information is transmitted through cell division such that a daughter cell recapitulates the spatial genome organization of the parent. Lamina-associated domains (LADs) are regions of repressive heterochromatin positioned at the nuclear periphery that vary by cell type and contribute to cell-specific gene expression and identity. Here we show that histone 3 lysine 9 dimethylation (H3K9me2) is an evolutionarily conserved, specific mark of nuclear peripheral heterochromatin and that it is retained through mitosis. During mitosis, phosphorylation of histone 3 serine 10 temporarily shields the H3K9me2 mark allowing for dissociation of chromatin from the nuclear lamina. Using high-resolution 3D immuno-oligoFISH, we demonstrate that H3K9me2-enriched genomic regions, which are positioned at the nuclear lamina in interphase cells prior to mitosis, re-associate with the forming nuclear lamina before mitotic exit. The H3K9me2 modification of peripheral heterochromatin ensures that positional information is safeguarded through cell division such that individual LADs are re-established at the nuclear periphery in daughter nuclei. Thus, H3K9me2 acts as a 3D architectural mitotic guidepost. Our data establish a mechanism for epigenetic memory and inheritance of spatial organization of the genome.

Keywords: C. elegans; H3K9me2; cell biology; chromosomes; gene expression; genome organization; mitosis; mouse; nuclear architecture; nuclear lamina; peripheral heterochromatin.


Conflict of interest statement

AP, CS, SN, PS, KW, JM, ML, EJ, RJ, JE No competing interests declared

Figures

Figure 1.
Figure 1.. Localization of H3K9me2-marked chromatin at the nuclear periphery is evolutionarily conserved.
(A) Immunofluorescent confocal images illustrating localization of the indicated repressive chromatin marks in the nucleus of a NIH/3T3 cell, counterstained with DAPI; dashed line indicates position of the line signal intensity profiles. Scale bar: 5 μm (B) Representative super-resolution images of a NIH/3T3 cell stained for H3K9me2 and Lamin B obtained using Stochastic Optical Reconstruction Microscopy (STORM). Scale bars: 5 μm (left panel) and 1 μm (right panel) (C) Localization of H3K9me2-marked chromatin in distinct species, co-stained with nuclear lamina markers (Lamin one for C. elegans; Lamin B all others), counterstained with DAPI. Scale bars: 5 μm.
Figure 1—figure supplement 1.
Figure 1—figure supplement 1.. H3K9me2-marked chromatin localizes specifically at the nuclear periphery and forms large heterochromatin domains.
(A) Representative confocal images of the H3K9me2-marked chromatin (green) localized at the nuclear lamina (Lamin B, red) of mouse ESCs, top panel; representative XY, XZ and YZ single confocal planes, bottom panel. 3D-image reconstruction (right panels, top) demonstrates H3K9me2 heterochromatin layer at the nuclear lamina; a full 3D reconstruction (right panel, bottom). (B) Representative H3K9me2 and Lamin B ChIP-seq tracks from mESCs illustrating lamina-associated domains specifically enriched for H3K9me2 and Lamin B.
Figure 1—figure supplement 2.
Figure 1—figure supplement 2.. H3K9me2 signal distribution is specific at the nuclear periphery.
Representative STORM images of the H3K9me2 signal with or without blocking peptides after applying the automatic thresholding based on Voronoi tessellation (see Materials and methods) and shown from highest density (yellow) to lowest density (gray), illustrating separation of H3K9me2 and blocked signal. Specific H3K9me2 signal is localized at the nuclear periphery forming a layer of peripheral heterochromatin.
Figure 2.
Figure 2.. Anti-H3K9me2 antibody used in immunofluorescence assays is specific.
(A) Murine C2C12 cells stained with nuclear lamina marker Lamin A/C and H3K9me2 antibodies preincubated with indicated blocking peptides. (B) Starred images (*) from panel A, with H3K9me2 signal displayed in grayscale and signal intensity spectral view; line signal intensity profile, below, illustrates H3K9me2-specific signal (green) and non-specific antibody background (red). (C) STORM images of NIH/3T3 cell stained for H3K9me2 and blocked with mock or H3K9me2 peptide; line signal intensity profile below as in panel B.
Figure 2—figure supplement 1.
Figure 2—figure supplement 1.. Anti-H3K9me2 antibodies validation.
(A and B) Bar graphs display histone peptide reactivity for H3K9me2 antibodies, data from Poleshko et al. (2017): Active Motif #39239 (left) and Abcam #ab1220 (right); panel A shows peptides with a single modification; panel B shows all peptides with H3K9me2 modification. (C) Representative confocal images of C2C12 and HeLa cells stained with different H3K9me2 antibodies. (D) Acid-extracted histones immunoblotted with indicated H3K9me2 antibodies demonstrates a single band that corresponds to histone H3. Representative confocal images of (E) mouse C2C12 cells and (F) human HeLa cells stained with nuclear lamina marker Lamin A/C and H3K9me2 antibodies preincubated with indicated blocking peptides. Scale bars: 5 μm.
Figure 3.
Figure 3.. H3K9me2 is essential for histone H3 positioning at the nuclear periphery.
(A) Schematic illustrating C. elegans protein CEC-4 tethering H3K9me2-marked chromatin to the nuclear periphery; INM: inner nuclear membrane. (B) Localization of H3K9me2-marked chromatin (green) in wild-type (WT) and cec-4-null C. elegans embryo cells, counterstained with nuclear lamina marker Lamin 1 (red) and DAPI (blue); 3D reconstruction (top); immunofluorescent confocal images of C. elegans embryo cells (bottom). Scale bars: 3 μm (C) Dot plot of the proportion of total H3K9me2-marked chromatin at the nuclear lamina in WT, cec-4-null, and cec-4-rescued embryo cells (mean ± SD); n = 25 cells per condition. (D) Localization of indicated histone H3-GFP fusion proteins in NIH/3T3 cells; counterstained with H3K9me2 (green) and nuclear lamina marker Lamin B (red); spectral views (magnifications of top panels as indicated by dashed squares) illustrate H3-GFP signal intensity. Localization of the H3-GFP at the nuclear periphery (yellow arrowheads) or loss of peripheral localization (white arrowheads). Scale bars: 5 μm (top panels) and 1 μm (bottom panels). (E) Dot plot of the proportion of indicated H3-GFP fusion protein at the nuclear lamina (marked by Lamin B, top) or within the layer of peripheral heterochromatin (marked by H3K9me2, bottom), normalized to wt H3-GFP, calculated using Lamin B or H3K9me2 signal as a mask (mean ± SD); n = 30 cells per condition. (F) Line signal intensity profiles of corresponding images in panel D indicated by dashed lines. Statistical analyses performed using two-tailed student’s t-test for panel C and one-way ANOVA test for panel E; ****p<0.0001, **p=0.0024, ns: not significant; all comparisons relative to wild type (wt).
Figure 3—figure supplement 1.
Figure 3—figure supplement 1.. Localization of H3K9me2- and H3K9me3-marked chromatin in C. elegans wild-type (WT), cec-4-null, and cec-4-rescue embryo cells.
(A) Additional representative immunofluorescent confocal images of C. elegans embryo cells illustrate H3K9me2 (green) localized to the nuclear periphery as stained with Lamin1 (red) in WT and cec-4-null cells rescued with cec-4 transgene (CEC-4 mCherry), but not in cec-4-null cells; counterstained with DAPI (blue). (B) Representative immunofluorescent confocal images illustrate H3K9me3 (green) distribution, counterstained with Lamin 1 (red) and DAPI (blue); Scale bars: 3 μm.
Figure 3—figure supplement 2.
Figure 3—figure supplement 2.. Expression of histone H3-GFP fusion proteins.
Histone H3 immunoblot demonstrating expression of exogenous H3-GFP fusion proteins. (A) anti-histone H3 immunoblot; and (B) anti-GFP immunoblot.
Figure 4.
Figure 4.. H3K9me2-marked chromatin is maintained throughout mitosis to be re-established at the nuclear lamina during nuclear lamina reassembly.
(A) Representative immunofluorescent confocal images of murine C2C12 cells illustrating localization of H3K9me2- and H3K9me2S10p-marked chromatin and Lamin B during different stages of mitosis; DNA visualized with DAPI. Scale bars: 5 μm. (B) Magnified images of Interphase and Prophase from panel (A) demonstrating detachment of the H3K9me2-chromatin from the nuclear lamina concomitant with H3K9me2S10p phosphorylation; scale bar: 1 μm. (C) Representative images of cells progressing through telophase as the layer of peripheral H3K9me2-marked heterochromatin (green) is re-established and nuclear lamina (Lamin B, red) is reassembled; dashed boxes in top panels indicate higher resolution images. Scale bars: 5 μm (top) and 1 μm (bottom panels). (D) Magnified images of telophase and daughter cells from panel A demonstrating de-phosphorylated H3K9me2-chromatin (green) assembled at the nuclear lamina (Lamin B, red), while the phosphorylated form (H3K9me2S10p, cyan, enchanced brightness) remains localized in the nuclear interior; scale bar: 1 μm. Dashed lines indicate location of corresponding representative line signal intensity profiles (bottom row).
Figure 4—figure supplement 1.
Figure 4—figure supplement 1.. 3D reconsruction of mitotic cells stained for H3K9me2.
3D-image reconstruction of mitotic cells displayed in Figure 4A as single confocal planes.
Figure 4—figure supplement 2.
Figure 4—figure supplement 2.. Anti-H3K9me2S10p antibody specificity validation.
(A) C2C12 cells in prophase stained with H3K9me2S10p antibody (green) preincubated with indicated blocking peptides, counterstained with DAPI (blue). (B) Histone peptide array analysis of H3K9me2S10p antibody reactivity with indicated peptides.
Figure 4—figure supplement 3.
Figure 4—figure supplement 3.. Restoration of the H3K9me2 chromatin layer at the nuclear lamina during telophase progression.
Representative confocal images of cells progressing through telophase (additional images to support Figure 4C) stained for H3K9me2 (green) and nuclear lamina marker (Lamin B, red); white arrows indicate location of line signal intensity profiles. Dashed squares indicate location of corresponding zoomed images. Top and bottom signal intensity line profiles correspond to left and right white arrows, respectively. Scale bars: 5 μm (top) and 1 μm (bottom panels).
Figure 5.
Figure 5.. Localization of H3K9me2- and H3K9me3-marked chromatin differs during mitosis.
(A) Representative immunofluorescent confocal images of murine C2C12 cells illustrating a difference in localization of H3K9me2 (green) and H3K9me3 (red) chromatin marks in interphase, during mitosis, and upon mitotic exit; co-stained with Lamin B (cyan) and DAPI (blue). (B) Representative immunofluorescent confocal images of C2C12 cells in telophase illustrating difference in localization of different histone modifications (green) in relation to Lamin B (red); co-stained with DAPI (blue). Dashed boxes in panels of middle row indicate higher resolution images (top row). Scale bars: 5 μm.
Figure 6.
Figure 6.. H3K9me2-enriched LADs are positioned at the nuclear lamina in interphase cells and the position is inherited through mitosis.
(A) Localization of LADs and non-LADs in interphase mouse embryonic stem cells (mESCs). Left panels show representative immuno-FISH images (top) and 3D image reconstructions (bottom) of cells hybridized with fluorescent DNA oligopaint probes targeting individual LADs (red) and non-LADs (green), and immunostained for Lamin B1 (cyan) and DAPI (blue). Scale bar: 5 μm. Dot plots show distribution of distances to the nuclear periphery (as defined by Lamin B1) of individual LAD and non-LAD probes for individual cells (middle) and cumulative over all cells (right) in interphase. (B) As in panel A for prometaphase-metaphase-anaphase cells. (C) As in panel A for telophase cells. For dot plots, nuclear periphery defined by Lamin B1 or DNA edge; black line: median value; cyan boxes indicate average thickness of H3K9me2 peripheral heterochromatin layer. Box plots display 5, 25, 50, 75 and 95 percentiles. n ≥ 20 individual nuclei; N = 870–1399 individual LADs or non-LADs per condition. Statistical analysis performed using two-tailed t-test; ****p<0.0001; ns: not significant.
Figure 6—figure supplement 1.
Figure 6—figure supplement 1.. Location of the oligopaint DNA probes targeting LADs and non-LADs on mouse chromosomes.
Displayed are H3K9me2 and LaminB ChIP-seq tracks from mESCs with each region of 41 ‘LADs’ (enriched for H3K9me2 and Lamin B signal) shown as a red bar above tracks and each region of 41 ‘non-LADs’ (depleted for H3K9me2 and Lamin B) shown as a green bar; probes for each region span 250 kb of the mouse genome (mm9).
Figure 6—figure supplement 2.
Figure 6—figure supplement 2.. Localization of LADs and non-LADs in interphase and mitotic mESCs.
Representative 3D reconstructions of interphase and mitotic cells illustrate localization of LAD and non-LAD oligopaint probes. Pericentromeric heterochromatin/chromocenters localize centrally during mitosis and thus both LADs and non-LADs are distributed in the chromosome arms.
Figure 7.
Figure 7.. Model illustrating the role of the H3K9me2 chromatin modification in inheritance of peripheral heterochromatin localization through cell division.

References

    1. Amendola M, van Steensel B. Mechanisms and dynamics of nuclear lamina-genome interactions. Current Opinion in Cell Biology. 2014;28:61–68. doi: 10.1016/j.ceb.2014.03.003. - DOI - PubMed
    1. Andrey G, Mundlos S. The three-dimensional genome: regulating gene expression during pluripotency and development. Development. 2017;144:3646–3658. doi: 10.1242/dev.148304. - DOI - PubMed
    1. Andronov L, Orlov I, Lutz Y, Vonesch JL, Klaholz BP. ClusterViSu, a method for clustering of protein complexes by voronoi tessellation in super-resolution microscopy. Scientific Reports. 2016;6:24084. doi: 10.1038/srep24084. - DOI - PMC - PubMed
    1. Beliveau BJ, Kishi JY, Nir G, Sasaki HM, Saka SK, Nguyen SC, Wu CT, Yin P. OligoMiner provides a rapid, flexible environment for the design of genome-scale oligonucleotide in situ hybridization probes. PNAS. 2018;115:E2183–E2192. doi: 10.1073/pnas.1714530115. - DOI - PMC - PubMed
    1. Bickmore WA. The spatial organization of the human genome. Annual Review of Genomics and Human Genetics. 2013;14:67–84. doi: 10.1146/annurev-genom-091212-153515. - DOI - PubMed

Publication types