. 2019 Dec 1;317(6):E1121-E1130.
doi: 10.1152/ajpendo.00245.2019. Epub 2019 Oct 1.

Amelioration of metabolic syndrome by metformin associates with reduced indices of low-grade inflammation independently of the gut microbiota

Affiliations

Amelioration of metabolic syndrome by metformin associates with reduced indices of low-grade inflammation independently of the gut microbiota

Aneseh Adeshirlarijaney et al. Am J Physiol Endocrinol Metab. .

Abstract

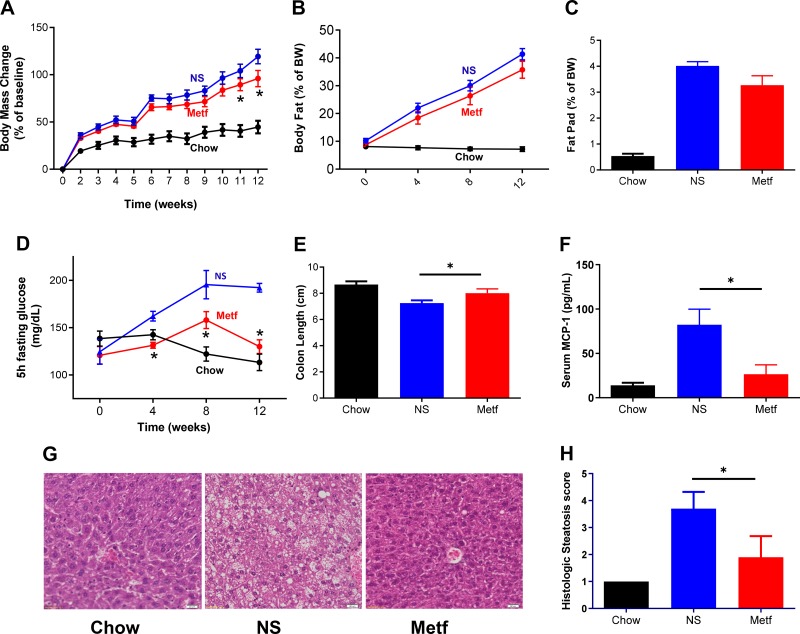
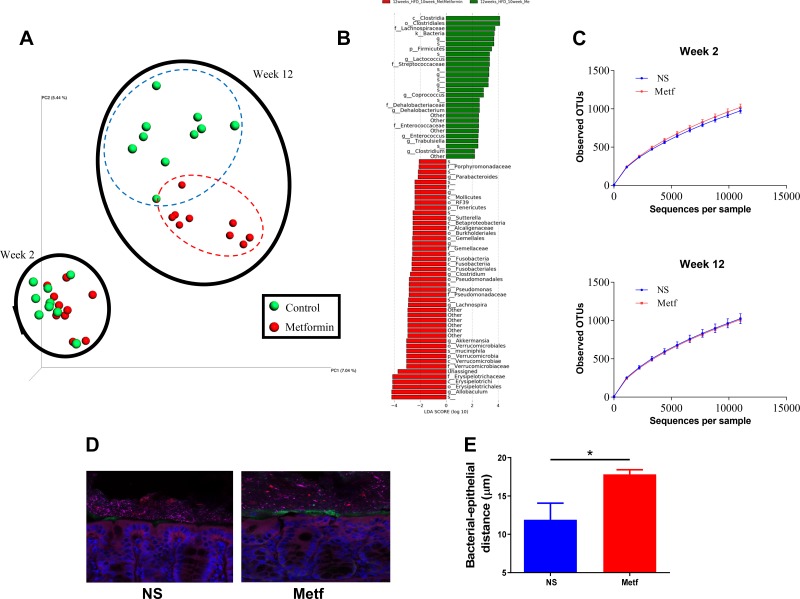
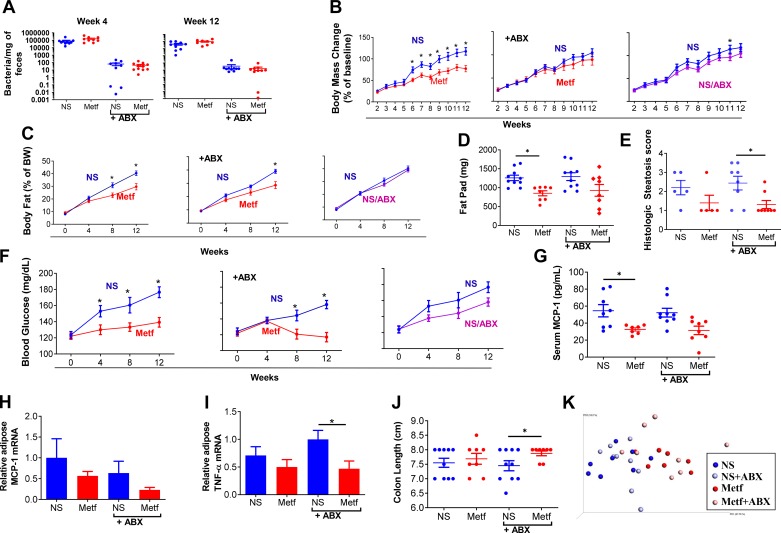
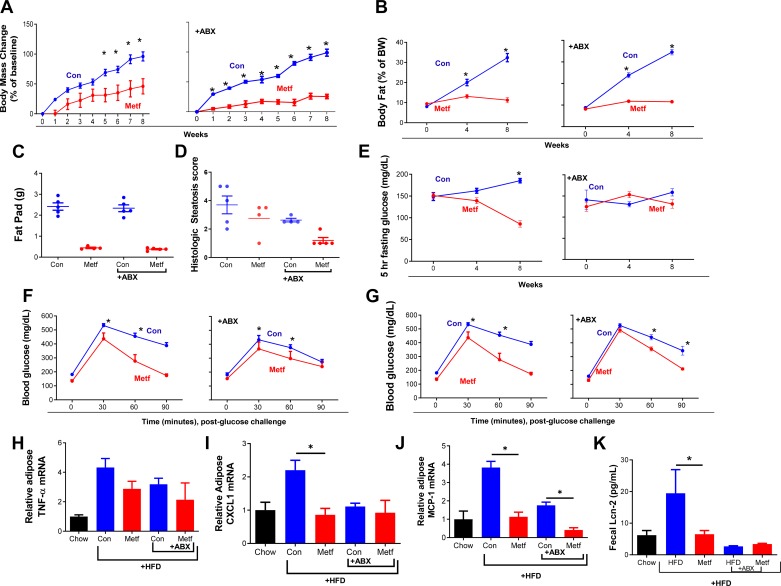
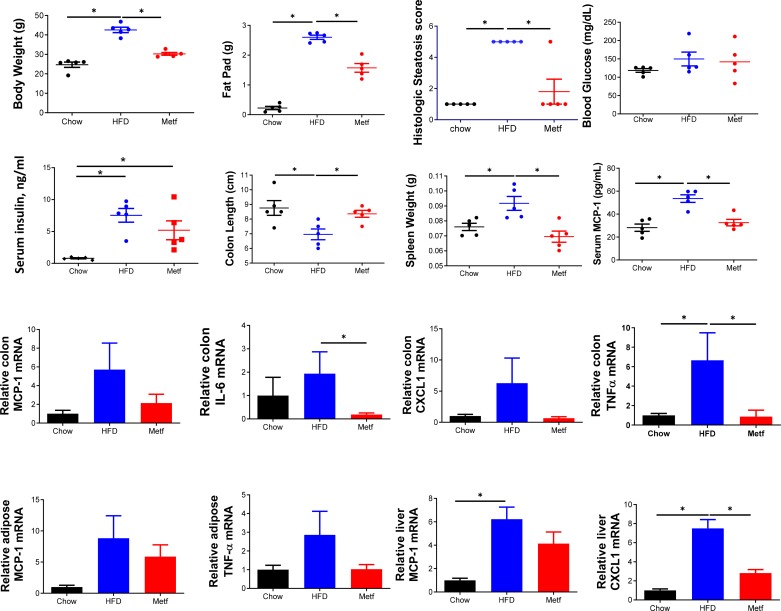
Metformin beneficially impacts several aspects of metabolic syndrome including dysglycemia, obesity, and liver dysfunction, thus making it a widely used frontline treatment for early-stage type 2 diabetes, which is associated with these disorders. Several mechanisms of action for metformin have been proposed, including that it acts as an anti-inflammatory agent, possibly as a result of its impact on intestinal microbiota. In accord with this possibility, we observed herein that, in mice with diet-induced metabolic syndrome, metformin impacts the gut microbiota by preventing its encroachment upon the host, a feature of metabolic syndrome in mice and humans. However, the ability of metformin to beneficially impact metabolic syndrome in mice was not markedly altered by reduction or elimination of gut microbiota, achieved by the use of antibiotics or germfree mice. Although reducing or eliminating microbiota by itself suppressed diet-induced dysglycemia, other features of metabolic syndrome including obesity, hepatic steatosis, and low-grade inflammation remained suppressed by metformin in the presence or absence of gut microbiota. These results support a role for anti-inflammatory activity of metformin, irrespective of gut microbiota, in driving some of the beneficial impacts of this drug on metabolic syndrome.

Keywords: antibiotics; germ free; high-fat diet; metabolic syndrome; metformin; microbiota; steatosis.


Conflict of interest statement

No conflicts of interest, financial or otherwise, are declared by the authors.

Figures

Fig. 1.
Fig. 1.
Metformin (Metf) ameliorates high-fat diet (HFD)-induced metabolic syndrome. Male C57 BL/6 mice (6 wk old; n = 10 per condition) were maintained on a standard grain-based chow diet or administered a Western-style, low-fiber HFD for 12 wk. HFD-fed mice were injected intraperitoneally with normal saline (NS) or metformin (metf) daily from 2 wk post-diet exposure until being euthanized. A and B: weight and body composition were monitored. C: epididymal fat pad pass measured post-euthanasia. D: mice were fasted for 5 h every 4 wk, and blood glucose was measured. E: colon length measured post-euthanasia. F: serum macrophage chemotactic protein-1 (MCP-1) measured by ELISA following 8 wk HFD exposure and overnight fasting. G: representative hematoxylin-eosin-stained liver sections. H: histologic scoring of liver sections for extent lipid accumulation. Data are shown as means ± SE. *Statistical significance (P < 0.05) by Student’s t test for HFD/metformin vs. HFD/NS. BW, body weight; MCP-1, macrophage chemotactic protein-1.
Fig. 2.
Fig. 2.
Metformin (Metf) impacts microbiota composition and reduces microbiota encroachment. Male C57 BL/6 mice (6 wk old; n = 10 per condition) were fed a high-fat diet (HFD) for 12 wk. HFD-fed mice were injected intraperitoneally with normal saline (NS) or metformin daily from 2 wk post-diet exposure until being euthanized. A: comparison of fecal microbiome composition via principal coordinate analysis of the UniFrac coordinates following wk 2 and wk 12; 0 and 10 wk post-metformin treatment. B: histogram shows linear discriminant analysis (LDA). C: rarefaction curves of number of observed operational taxonomic units (OTUs) based on sequence similarities for control and treatment group at wk 2 and wk 12. D: confocal microscopy analysis of microbiota localization; mucin 2 (green), actin (purple), bacteria (red), and DNA (blue). Scale bar = 20 μm. E: distance of closest bacteria to intestinal epithelial cells per condition over 5 high-powered fields per mouse. Pictures are representative of 10 biological replicates. Data are means ± SD; *P < 0.05 by Student’s t test.
Fig. 3.
Fig. 3.
Amelioration of high-fat diet (HFD)-induced metabolic syndrome in antibiotic-treated mice. Male C57 BL/6 mice (6 wk old; n = 10 per condition) were fed an HFD for 12 wk. HFD-fed mice were injected intraperitoneally with normal saline (NS) or metformin (Metf) daily from 2 wk post-diet exposure until being euthanized, with or without antibiotics (ABX) in drinking water. A: PCR-based quantification of bacterial load adhered to feces on wk 4 and 12. B and C: body weight MRI and analyzing body composition every 4 wk. D: epididymal fat pad pass measured post-euthanasia. E: histologic scoring of section of liver. F: mice were fasted for 5 h every 4 wk, and blood glucose was measured. G: serum macrophage chemotactic protein-1 (MCP-1) measured by ELISA following 12 wk HFD exposure and overnight fasting. H and I: the mRNA was extracted from fat, and the expression level of MCP-1 and TNFα was analyzed by RT-PCR. J: colon length measured post-euthanasia. K: principal component analysis plot combining terminal parameters of weight, fat composition, fat pad mass, blood glucose, MCP-1, and colon length. Data are shown as means ± SE. *Statistical significance (P < 0.05) by Student’s t test for HFD/metformin vs. HFD/NS.
Fig. 4.
Fig. 4.
Efficacy of oral metformin (Metf) amidst antibiotics. Male C57 BL/6 mice (6 wk old; n = 5 per condition) were maintained on a Western-style low-fiber high-fat diet (HFD) for 8 wk. HFD-fed mice were administered drinking water containing metformin or vehicle control (Con) from wk 1 of study, with or without antibiotics (ABX) in drinking water. A and B: body weightMRI and analyzing body composition. C: epididymal fat pad pass measured post-euthanasia. D: histologic scoring of section of liver. E: mice were fasted for 5 h every 4 wk, and glucose was measured. F and G: glucose measured 0, 30, 60, and 90 min after intraperitoneal injection of glucose at wk 3 and wk 8. H: mRNA extracted from adipose and expression level of macrophage chemotactic protein-1 (MCP)-1. I and J: CXCL1 and TNFα was measured by RT-PCR. K: fecal lipocalin-2 measured by ELISA at 8 wk timepoint. Data are shown as means ± SE. *Statistical significance (P < 0.05) by Student’s t test for HFD/metformin vs. HFD control.
Fig. 5.
Fig. 5.
Maintained efficacy of metformin (Metf) in high-fat diet (HFD)-fed germfree mice. Male C57 BL/6 mice (6 wk old; n = 5 per condition) were maintained on autoclaved chow or irradiated HFD (IR-HFD) for 8 wk while being administered drinking water containing metformin or vehicle. All parameters were measured following euthanasia. Body weight and epididymal fat pad. Histologic scoring of section of liver. Mice were fasted overnight, and blood glucose and insulin were measured. The colon length and spleen weight were also measured. Serum macrophage chemotactic protein-1 (MCP-1) was measured by ELISA and overnight fasting. The mRNA was extracted from the colon and expression level of MCP-1, IL-6, CXCL1 and TNFα was analyzed by RT-PCR. The mRNA was extracted from adipose and expression level of MCP-1 and TNFα was analyzed by RT-PCR. The mRNA was extracted from liver and expression level of MCP-1 and CXCL1 was analyzed by RT-PCR. The mRNA was extracted from adipose and expression level of MCP-1 and TNFα was analyzed by RT-PCR. Data are shown as means ± SE. *Statistical significance (P < 0.05) by Student’s t test for HFD/metformin vs. HFD control.

References

    1. An H, He L. Current understanding of metformin effect on the control of hyperglycemia in diabetes. J Endocrinol 228: R97–R106, 2016. doi:10.1530/JOE-15-0447. - DOI - PMC - PubMed
    1. Bäckhed F, Manchester JK, Semenkovich CF, Gordon JI. Mechanisms underlying the resistance to diet-induced obesity in germ-free mice. Proc Natl Acad Sci USA 104: 979–984, 2007. doi:10.1073/pnas.0605374104. - DOI - PMC - PubMed
    1. Bailey CJ, Flatt PR, Ewan C. Anorectic effect of metformin in lean and genetically obese hyperglycaemic (ob/ob) mice. Arch Int Pharmacodyn Ther 282: 233–239, 1986. - PubMed
    1. Bauer PV, Duca FA, Waise TMZ, Rasmussen BA, Abraham MA, Dranse HJ, Puri A, O’Brien CA, Lam TKT. Metformin alters upper small intestinal microbiota that impact a glucose-SGLT1-sensing glucoregulatory pathway. Cell Metab 27: 101–117.e5, 2018. doi:10.1016/j.cmet.2017.09.019. - DOI - PubMed
    1. Cani PD, Bibiloni R, Knauf C, Waget A, Neyrinck AM, Delzenne NM, Burcelin R. Changes in gut microbiota control metabolic endotoxemia-induced inflammation in high-fat diet-induced obesity and diabetes in mice. Diabetes 57: 1470–1481, 2008. doi:10.2337/db07-1403. - DOI - PubMed

Publication types

MeSH terms