. 2020 Jan 2;130(1):247-257.
doi: 10.1172/JCI129167.

Low- and high-thermogenic brown adipocyte subpopulations coexist in murine adipose tissue

Affiliations

Low- and high-thermogenic brown adipocyte subpopulations coexist in murine adipose tissue

Anying Song et al. J Clin Invest. .

Abstract

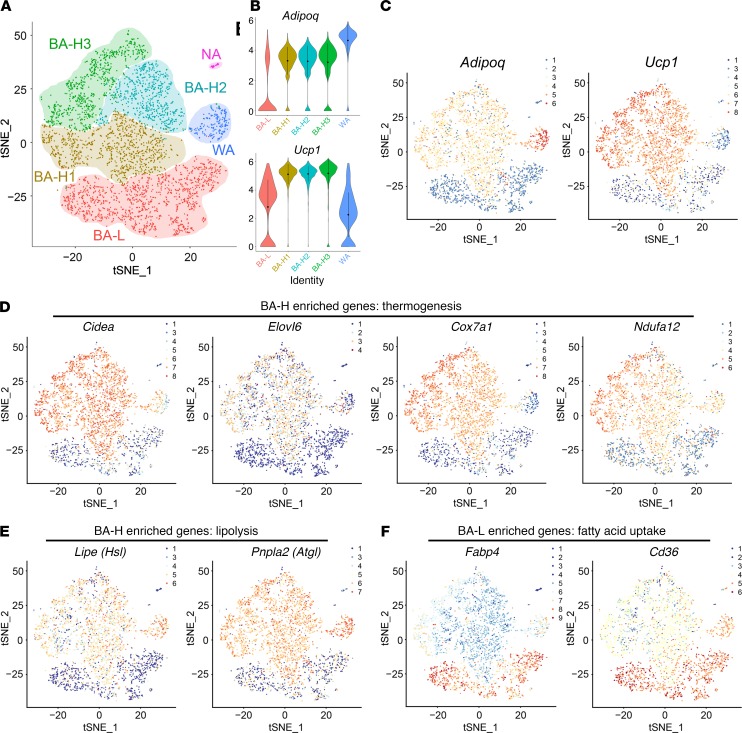
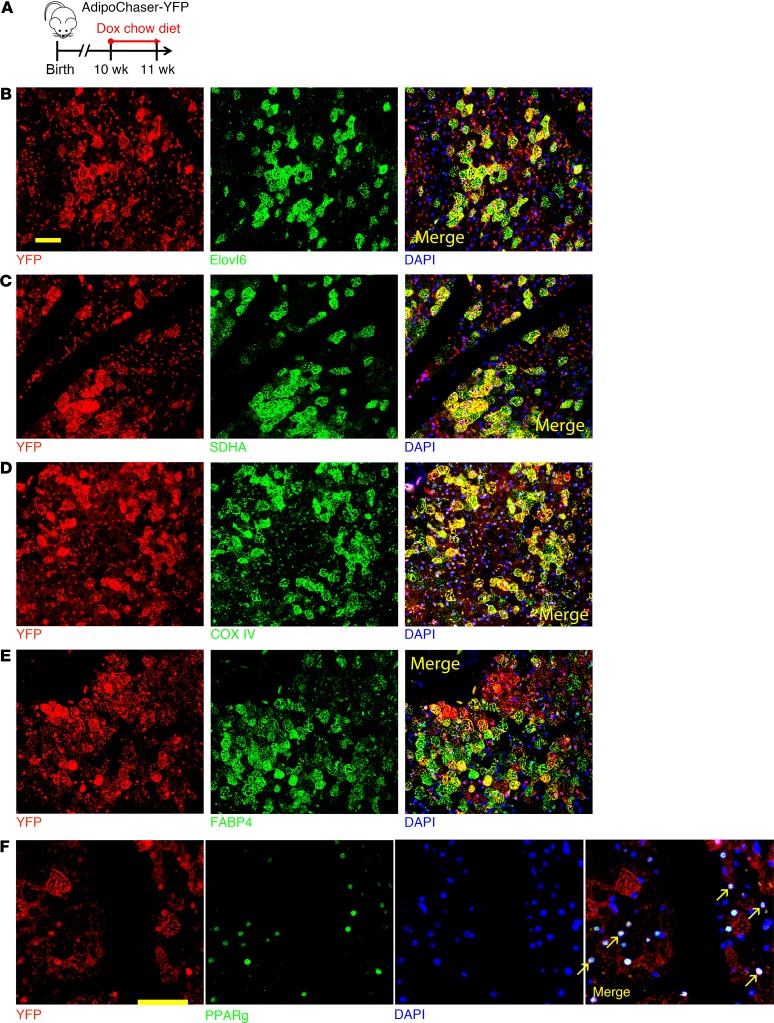
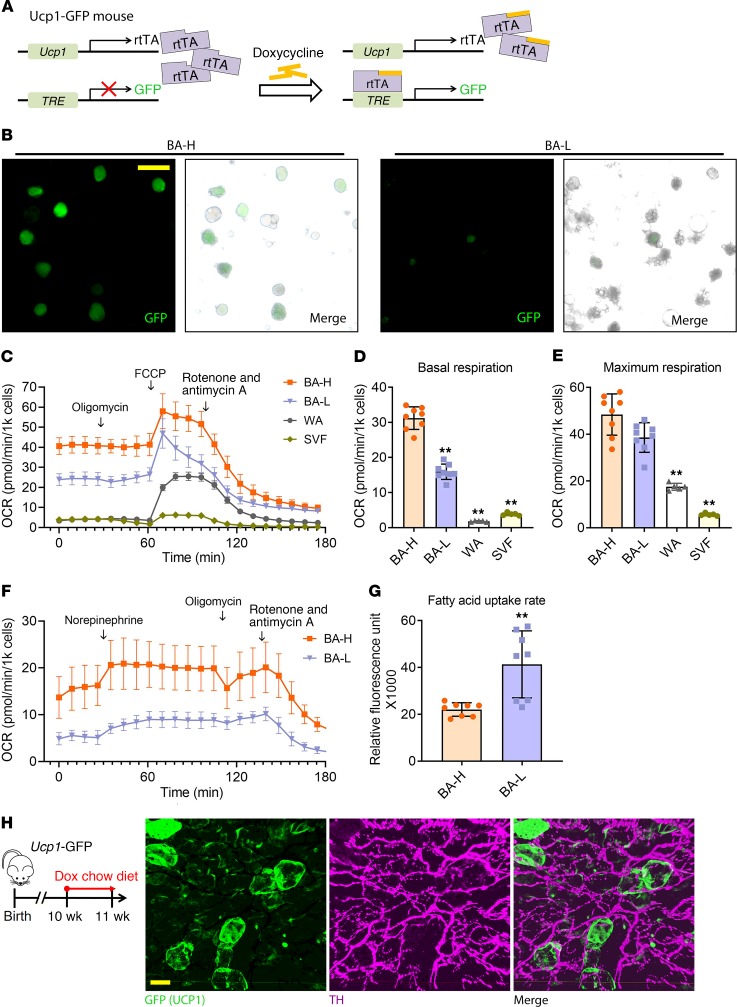
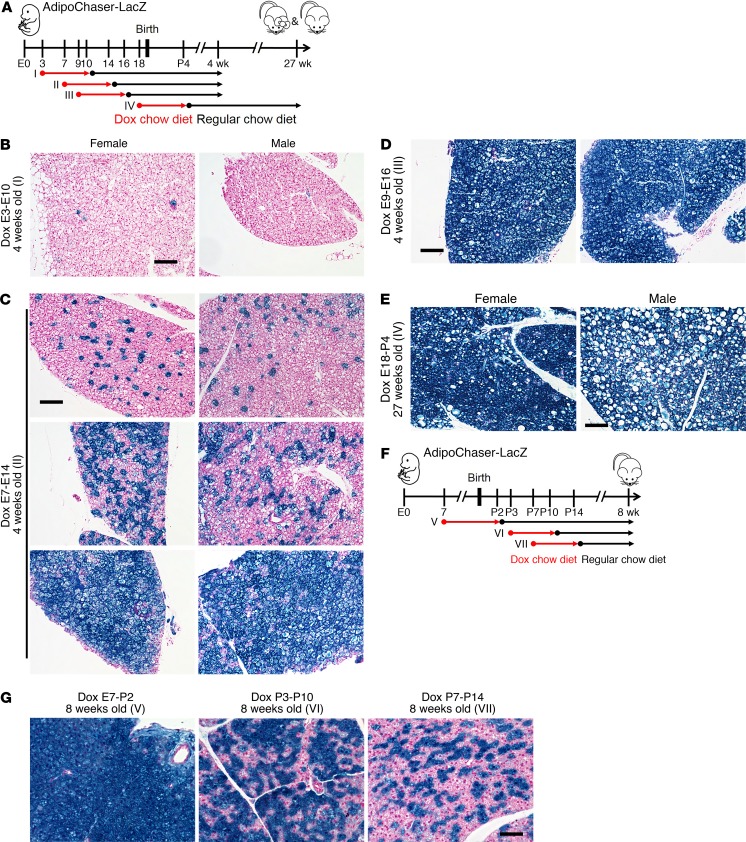
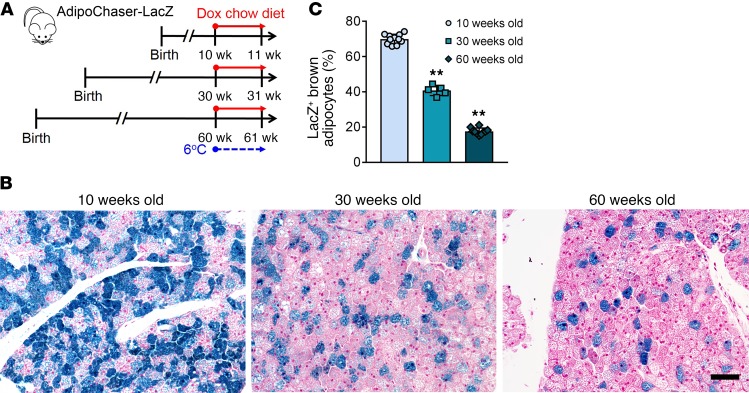
Brown adipose tissue (BAT), as the main site of adaptive thermogenesis, exerts beneficial metabolic effects on obesity and insulin resistance. BAT has been previously assumed to contain a homogeneous population of brown adipocytes. Utilizing multiple mouse models capable of genetically labeling different cellular populations, as well as single-cell RNA sequencing and 3D tissue profiling, we discovered a brown adipocyte subpopulation with low thermogenic activity coexisting with the classical high-thermogenic brown adipocytes within the BAT. Compared with the high-thermogenic brown adipocytes, these low-thermogenic brown adipocytes had substantially lower Ucp1 and Adipoq expression, larger lipid droplets, and lower mitochondrial content. Functional analyses showed that, unlike the high-thermogenic brown adipocytes, the low-thermogenic brown adipocytes have markedly lower basal mitochondrial respiration, and they are specialized in fatty acid uptake. Upon changes in environmental temperature, the 2 brown adipocyte subpopulations underwent dynamic interconversions. Cold exposure converted low-thermogenic brown adipocytes into high-thermogenic cells. A thermoneutral environment had the opposite effect. The recruitment of high-thermogenic brown adipocytes by cold stimulation is not affected by high-fat diet feeding, but it does substantially decline with age. Our results revealed a high degree of functional heterogeneity of brown adipocytes.

Keywords: Adipose tissue; Metabolism.


Conflict of interest statement

Conflict of interest: The authors have declared that no conflict of interest exists.

Figures

Figure 1
Figure 1. Two subpopulations of classical brown adipocytes undergo dynamic interconversions in vivo.
(A) Representative X-gal staining of BAT from AdipoChaser-LacZ mice exposed to different environmental temperatures while fed with dox-containing chow diet. (B) Quantification of the percentage of LacZ+ brown adipocytes in the total brown adipocytes. n = 8 mice (6°C); 6 mice (24°C); 7 mice (30°C). (CF) Representative X-gal staining of BAT from AdipoChaser-LacZ mice kept at the indicated temperatures while fed with dox-containing chow diet, followed by regular chow diet feeding at the indicated temperatures. Scale bars: 100 μm (A, CF). All data are mean ± SD of biologically independent samples; **P < 0.01. Statistical significance was assessed using a 1-way ANOVA followed by Tukey’s multiple comparisons test. All images are representative of 3 independent experiments.
Figure 2
Figure 2. The 2 brown adipocyte subpopulations have distinct morphology and Ucp1 expression.
(A) Electron micrographs of BAT from mice kept at 6°C. Arrows: LacZ crystals. Scale bar: 2 μm. (BD) Quantification of the mitochondria size, number, and lipid droplet size. n = 7 LacZ+ cells for B and C, n = 9 LacZ+ cells for D; n = 10 LacZ cells for B and C, n = 12 LacZ cells for D. (E and F) YFP (red), UCP1 (green), and DAPI (blue) immunofluorescence staining of BAT from AdipoChaser-YFP mice treated with dox-containing chow diet as indicated. Cells with yellow color are double positive with YFP and UCP1. Scale bars: 50 μm. All data represent mean ± SD of biologically independent samples; **P < 0.01. Statistical significance was assessed using a 2-tailed Student’s t test (BD). All images are representative of 3 independent experiments.
Figure 3
Figure 3. Single-cell RNA sequencing confirms the existence of 2 distinct brown adipocyte subpopulations.
(A) t-distributed stochastic neighbor embedding (tSNE) plot of 3602 primary brown adipocytes isolated from 10-week-old WT male mice. Clustering was generated using k-means = 4. These data are from a single experiment. (BF) Transcript counts represent log2 of gene expression. Each dot corresponds to one single cell, colored according to cell cluster. (B) Violin plots showing the distribution of normalized expression values of adiponectin (Adipoq) and Ucp1 across cells that belong to the 5 adipocyte clusters. (CF) Distribution of the expression of Adipoq and Ucp1 (C), Cidea, Elovl6, Cox7a1, and Ndufa12 (D), Lipe (Hsl) and Pnpla2 (Atgl) (E), and Fabp4 and Cd36 (F) within tSNE plot.
Figure 4
Figure 4. Immunofluorescence costaining of differentially expressed genes identified through single-cell RNA sequencing.
(A) AdipoChaser-YFP male mice were kept on normal chow until 10 weeks of age. Mice were then treated with dox-containing chow diet for 1 week. (BF) YFP (red) and Elovl6 (green) (B), SDHA (green) (C), COXIV (green) (D), FABP4 (green) (E), and PPARγ (green) (F) immunofluorescence staining of BAT from AdipoChaser-YFP mice treated with dox-containing chow diet as indicated. Cells with yellow color are merged from red and green. Scale bars: 50 μm. Images are representative of 2 independent experiments.
Figure 5
Figure 5. The brown adipocyte subpopulations have distinct metabolic profiles.
(A) Ucp1-GFP mice, the inducible real-time labeling system of Ucp1 promoter activity, derived from interbreeding 2 transgenic strains, Ucp1-rtTA and TRE-GFP, which allows inducible real-time labeling of the Ucp1 promoter activity. At the basal level, Ucp1-GFP mice do not express GFP in any cell type. When these mice are treated with dox, GFP expression is induced based on the Ucp1 promoter activity. (B) Fluorescent images of isolated BA-H and BA-L subpopulations from the BAT of Ucp1-GFP mice. Scale bar: 50 μm. These images are representative of 4 independent experiments. (CE) OCR in freshly isolated primary cells treated with the different compounds. Primary brown adipocytes (BA-H and BA-L) were from male WT mice housed in 6°C for 7 days. As controls, primary white adipocytes and SVF from BAT were from male WT mice housed at room temperature. (C) Plot of OCR to time measured by Seahorse. (D and E) Calculated basal and maximum respiration levels of different cell types. n = 8 mice (BA-H and BA-L); n = 5 mice (WA and SVF). (F) Plot of OCR to time measured by Seahorse in primary brown adipocytes (BA-H and BA-L) treated with the different compounds. These cells were freshly isolated from male AdipoChaser-mT/mG mice housed in 6°C for 7 days through EasySep Magnet (Stem Cell Technologies). (G) Fatty acid uptake rate in the 2 brown adipocyte subpopulations. n = 8 mice (BA-H and BA-L). For each group, cells from all mice were pooled together, and data represent mean ± SD of experimental replicates, normalized to cell numbers. **P < 0.01. Statistical significance was assessed using a 1-way ANOVA followed by Tukey’s multiple comparisons test (D and E), or a 2-tailed Student’s t test (G). (H) Ten-week-old Ucp1-GFP mice were treated with dox-containing diet for 4 days before tissue harvest. PACT-cleared BAT from Ucp1-GFP mice and immunolabeled with GFP (green) and sympathetic neuron marker tyrosine hydroxylase (TH) (purple) antibody. Scale bar: 30 μm. Images are representative of 3 independent experiments.
Figure 6
Figure 6. Brown adipocytes were born as adiponectin high expressors, and heterogeneity establishes after birth.
(A) Female mice carrying only Adn-rtTA and Rosa26-loxP-stop-loxP-LacZ were bred with AdipoChaser-LacZ male mice. When these female mice were pregnant, they were exposed to dox-containing chow diet during E3–E10 (I), E7–E14 (II), E9–E16 (III), or E18– P4(IV), and kept on regular chow diet thereafter. Offspring of the female mice were genotyped, and AdipoChaser-LacZ mice of both sexual phenotypes were used for LacZ staining when they were 4 weeks or 27 weeks old. (BD) Representative X-gal staining of BAT from 4-week-old AdipoChaser-LacZ mice that were on dox diet for the indicated number of days during development. (E) Representative X-gal staining of BAT from 27-week-old AdipoChaser-LacZ mice that were on dox diet during E18–P4. Scale bars: 100 μm (BE). (F) Female mice carrying only Adn-rtTA and Rosa26-loxP-stop-loxP-LacZ were bred with AdipoChaser-LacZ male mice. When the female mice were pregnant, they were exposed to dox-containing chow diet during E7–P2 (V), P3–P10 (VI), or P7–P14 (VII), and kept on regular chow diet thereafter. Offspring of the female mice were genotyped, and male AdipoChaser-LacZ mice were used for LacZ staining when they were 8 weeks old. (G) Representative X-gal staining of BAT from the AdipoChaser-LacZ mice that were on dox diet for the indicated number of days during development. Scale bar: 50 μm. All images are representative of 3 independent experiments.
Figure 7
Figure 7. The recruitment of BA-H during cold exposure declines with age.
(A) AdipoChaser-LacZ male mice were kept on normal chow until 30 or 60 weeks of age. Mice were then exposed to 6°C for 7 days while treated with dox-containing chow diet. (B) Representative X-gal staining of BAT from mice of different age exposed to 6°C. Scale bar: 50 μm. (C) Quantification of the percentage of LacZ+ brown adipocytes in the total brown adipocytes. n = 11 mice (10 weeks old); n = 5 mice (30 weeks old); n = 10 mice (60 weeks old). **P < 0.01. Statistical significance was assessed using a 1-way ANOVA followed by Tukey’s multiple comparisons test. All images are representative of 3 independent experiments.

Comment in

References

    1. Orava J, et al. Different metabolic responses of human brown adipose tissue to activation by cold and insulin. Cell Metab. 2011;14(2):272–279. doi: 10.1016/j.cmet.2011.06.012. - DOI - PubMed
    1. Ouellet V, et al. Brown adipose tissue oxidative metabolism contributes to energy expenditure during acute cold exposure in humans. J Clin Invest. 2012;122(2):545–552. doi: 10.1172/JCI60433. - DOI - PMC - PubMed
    1. Chondronikola M, et al. Brown adipose tissue improves whole-body glucose homeostasis and insulin sensitivity in humans. Diabetes. 2014;63(12):4089–4099. doi: 10.2337/db14-0746. - DOI - PMC - PubMed
    1. Bartelt A, et al. Brown adipose tissue activity controls triglyceride clearance. Nat Med. 2011;17(2):200–205. doi: 10.1038/nm.2297. - DOI - PubMed
    1. Stanford KI, et al. Brown adipose tissue regulates glucose homeostasis and insulin sensitivity. J Clin Invest. 2013;123(1):215–223. doi: 10.1172/JCI62308. - DOI - PMC - PubMed

Publication types

MeSH terms

LinkOut - more resources