. 2019 Dec:145:284-299.
doi: 10.1016/j.freeradbiomed.2019.09.031. Epub 2019 Sep 28.

Oxidative stress mediates ethanol-induced skeletal muscle mitochondrial dysfunction and dysregulated protein synthesis and autophagy

Affiliations

Oxidative stress mediates ethanol-induced skeletal muscle mitochondrial dysfunction and dysregulated protein synthesis and autophagy

Avinash Kumar et al. Free Radic Biol Med. 2019 Dec.

Abstract

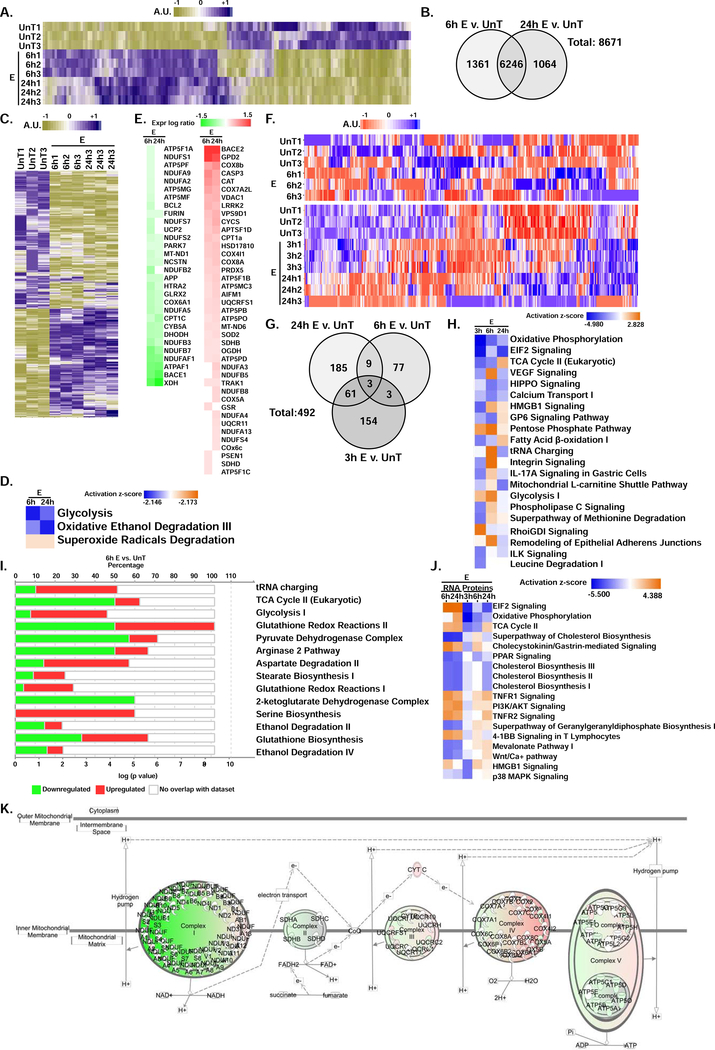
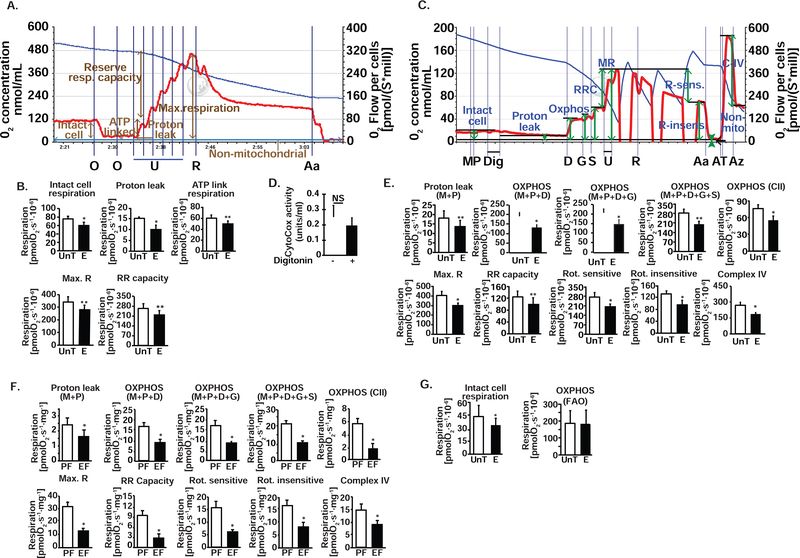
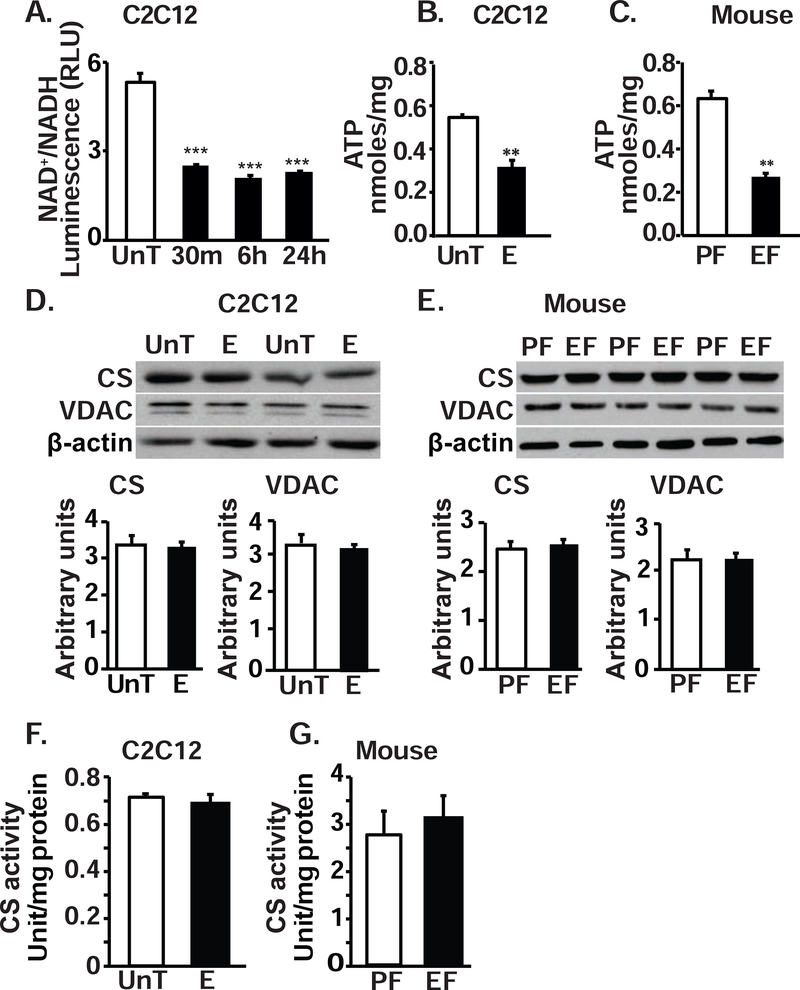
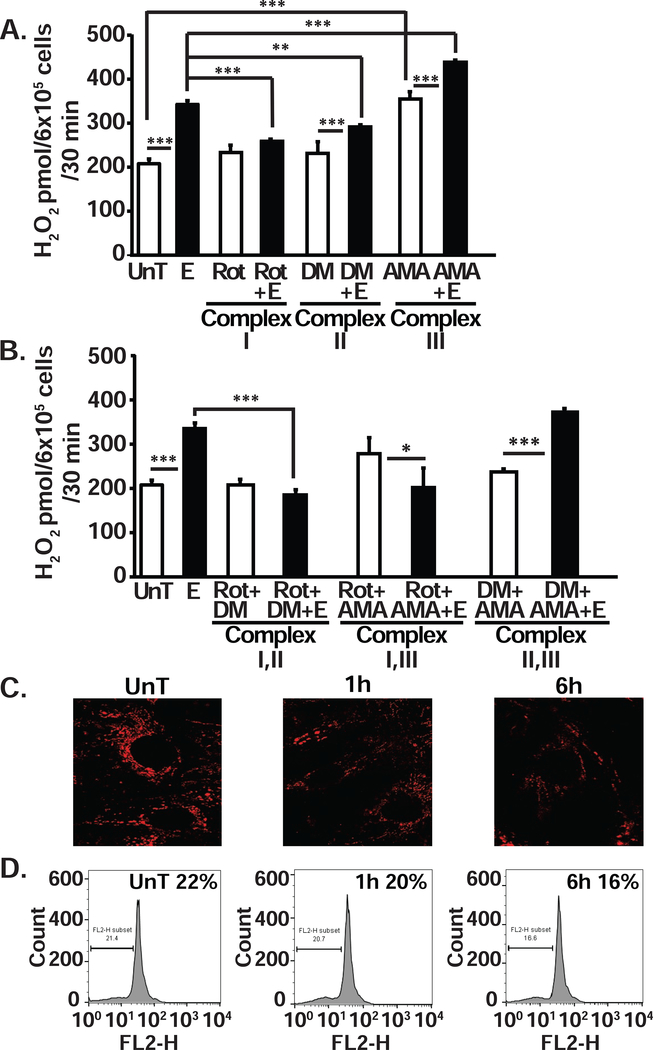
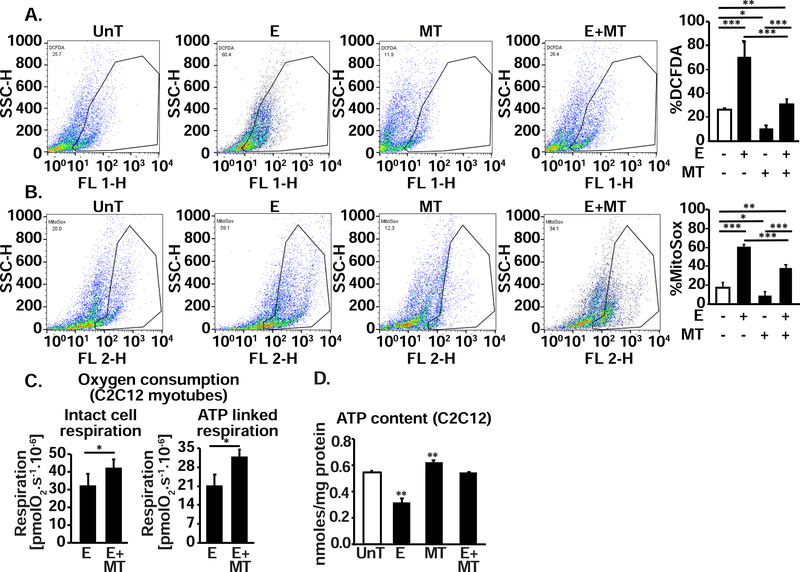
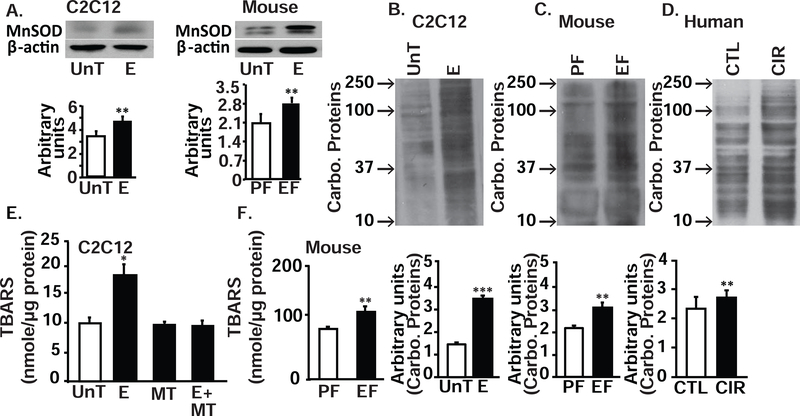
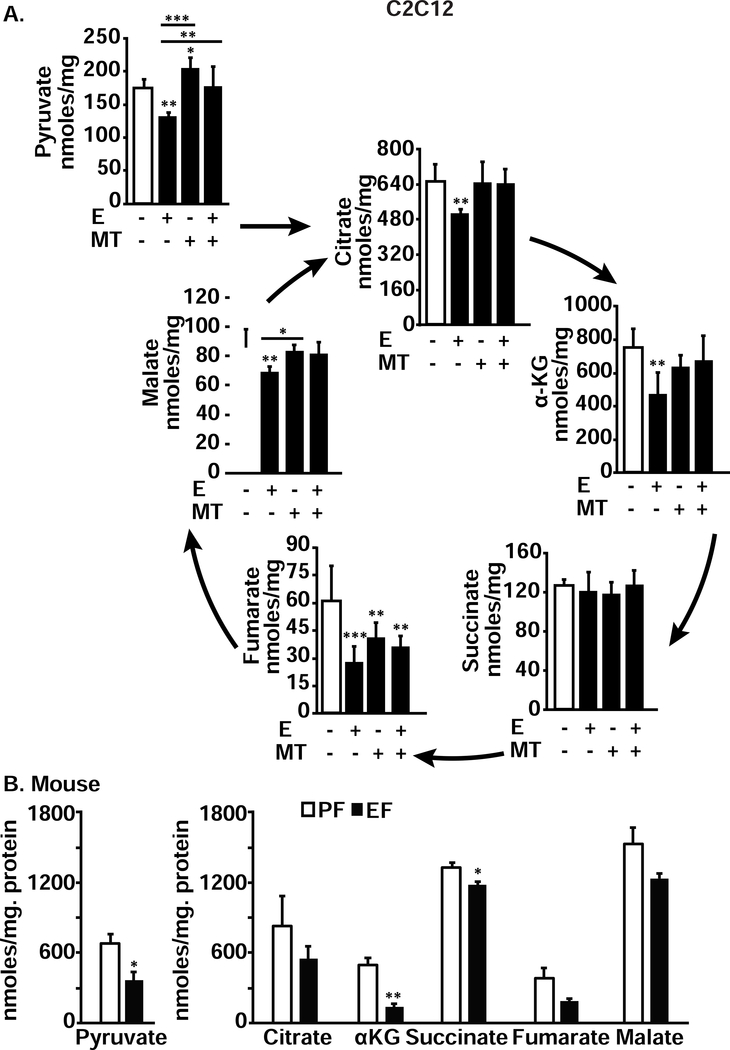
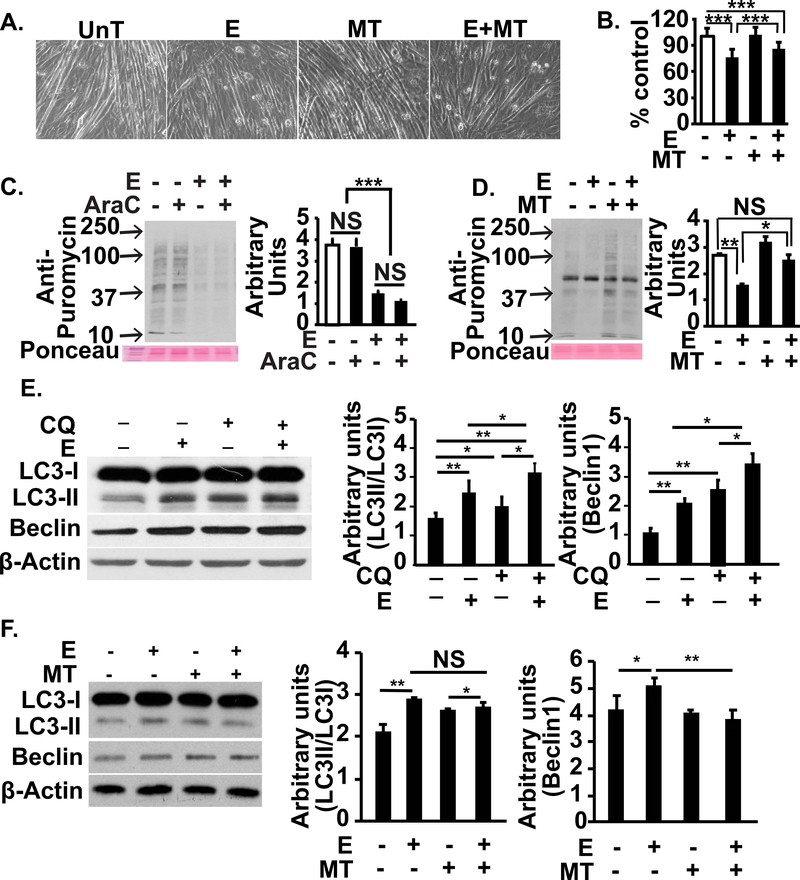
Protein synthesis and autophagy are regulated by cellular ATP content. We tested the hypothesis that mitochondrial dysfunction, including generation of reactive oxygen species (ROS), contributes to impaired protein synthesis and increased proteolysis resulting in tissue atrophy in a comprehensive array of models. In myotubes treated with ethanol, using unbiased approaches, we identified defects in mitochondrial electron transport chain components, endogenous antioxidants, and enzymes regulating the tricarboxylic acid (TCA) cycle. Using high sensitivity respirometry, we observed impaired cellular respiration, decreased function of complexes I, II, and IV, and a reduction in oxidative phosphorylation in ethanol-treated myotubes and muscle from ethanol-fed mice. These perturbations resulted in lower skeletal muscle ATP content and redox ratio (NAD+/NADH). Ethanol also caused a leak of electrons, primarily from complex III, with generation of mitochondrial ROS and reverse electron transport. Oxidant stress with lipid peroxidation (thiobarbituric acid reactive substances) and protein oxidation (carbonylated proteins) were increased in myotubes and skeletal muscle from mice and humans with alcoholic liver disease. Ethanol also impaired succinate oxidation in the TCA cycle with decreased metabolic intermediates. MitoTEMPO, a mitochondrial specific antioxidant, reversed ethanol-induced mitochondrial perturbations (including reduced oxygen consumption, generation of ROS and oxidative stress), increased TCA cycle intermediates, and reversed impaired protein synthesis and the sarcopenic phenotype. We show that ethanol causes skeletal muscle mitochondrial dysfunction, decreased protein synthesis, and increased autophagy, and that these perturbations are reversed by targeting mitochondrial ROS.

Keywords: ATP; Ethanol; Mitochondria; Oxidative stress; Skeletal muscle.


Conflict of interest statement

Conflict of interest: The authors declare that they have no conflicts of interest with the contents of this article except for the grant support from the National Institutes of Health.

Figures

Figure 1.
Figure 1.. Perturbations in transcriptomics and proteomics in ethanol-treated differentiated C2C12 myotubes.
A. Heat map of transcriptome from untreated (UnT) differentiated myotubes with those treated with 100 mM ethanol (E) for 6 h and 24 h. B. Venn diagram showing differentially expressed genes (DEG) in the transcriptome at 6 h and 24 h of 100mM E treatment compared to UnT myotubes. C. Heat map of transcripts of genes regulating mitochondrial function in UnT and 100 mM E for 6 h and 24 h treated myotubes based on Mouse MitoCarta 2.0 (Broad Institute). D. Ingenuity Pathway Knowledge base® analysis of the transcriptome for the selected pathways in UnT myotubes and those treated with 100mM E for 6 and 24 h. E. Ingenuity Pathway Knowledge base® analysis of differentially expressed genes on the transcriptome that are involved in mitochondrial function in UnT myotubes compared with those treated with 100 mM E for 6 h and 24 h. F. Heat map of the proteome in UnT differentiated C2C12 myotubes compared with those treated with 100 mM E for 3 h, 6 h and 24 h. Two separate maps are shown to avoid batch effects. G. Venn diagram showing unique and overlapping differentially expressed genes (DEG) in the proteome at 3 h, 6 h, and 24 h of 100 mM E treatment compared to untreated myotubes. H. Ingenuity Pathway Knowledge base® analysis of the proteome for the most enriched canonical metabolic and signaling pathways in UnT myotubes compared with those treated with 100 mM E for 3, 6 and 24 h. I. Differentially expressed proteins in select metabolic pathways in the Ingenuity Pathway Knowledge base® from myotubes treated with 100 mM E for 6 h. J. Ingenuity Pathway Knowledge base® analysis comparing the most enriched canonical metabolic and signaling pathways in the translatome and proteome and the activation state of the pathway in UnT and ethanol-treated myotubes for the time points shown. K. Perturbations in components of oxidative phosphorylation in the proteome from UnT myotubes compared to those treated with 100 mM E for 6 h. All data from at least 3 biological replicates from differentiated C2C12 myotubes.
Figure 2.
Figure 2.. Ethanol impairs mitochondrial respiration in differentiated C2C12 myotubes and mouse skeletal muscle tissue.
A. Representative tracings of high-resolution respirometry to quantify intact cell respiration of differentiated C2C12 myotubes. After initial stabilization, ATP synthetase inhibitor, oligomycin (O) was added at 1 μg/ml final concentration, and oxygen consumption quantified to determine the oligomycin-sensitive and -insensitive respiration. Protonophore (H+ ionophore) and uncoupler of oxidative phosphorylation, FCCP (U) at 0.5 μM increments to achieve maximum respiration was then added to quantify maximum respiratory capacity. This was followed by rotenone (R) 375 nM final concentration, to inhibit complex I of the ETC, and then 2.5 μM antimycin A (Aa), which inhibits complex III, was added to determine the non-mitochondrial respiration. B. In intact, non-permeabilized myotubes in basal DMEM medium, 100 mM E exposure for 6 h impairs basal cell respiration, ATP-linked respiration, maximum respiratory capacity (Max. R) from the response to FCCP, reserve respiratory (RR) capacity and oligomycin-sensitive oxygen consumption that reflects oxidative phosphorylation. N=6; *P <0.05; **P <0.01; ***P <0.01. S−1*Mill−1: Seconds−1.million cells for oxygen flow rate−1. C. Representative tracings of high-resolution respirometry to quantify respiration of permeabilized differentiated C2C12 myotubes. After initial stabilization, 2 mM malate (M) and 2.5 mM pyruvate (P) were added. This was followed by 4.1 μM digitonin (D) to permeabilize the cell membrane without losing the integrity of cells or mitochondria for permitting entry of mitochondrial substrates inside the cells; 2.5 mM ADP (D); 10 mM glutamate (G); 10 mM succinate (S); 2 μM increments of FCCP (U) for measuring maximum respiration; 375 nM rotenone (R); 125 nM antimycin A (Aa); 2 mM ascorbate and 2 mM TMPD (tetamethyl p-phenylene diamine) (AT) to test complex IV activity; 50 mM sodium azide (Az) to inhibit complex IV activity. D. Mitochondrial membrane integrity in permeabilized myotubes expressed by quantification of cytochrome c oxidase in the medium expressed at percentage of control, non-permeabilized cells. E. Oxygen consumption measured in intact non-permeabilized myotubes in mitochondrial respiration buffer followed by digitonin permeabilization and ETC complex specific substrates and inhibitors sequentially in the concentrations as stated above. Proton leak, oxidative phosphorylation (OXPHOS) in response to M, P, D, G and S, and Max. R and RR capacity (response to U) were quantified. Rotenone-sensitive and -insensitive respiration followed by complex IV function were measured. F. Mitochondrial oxygen consumption in permeabilized gastrocnemius muscle white fibers from ethanol fed (EF) and pair-fed (PF) mice in response to substrates and inhibitors of components of the ETC in the concentrations stated above. Saponin 50 μg/ml. was used for permeabilization of fibers. G. Fatty acid oxidation (FAO) was measured using palmitoylcarnitine as substrate was unaffected by ethanol exposure in myotubes. Histograms showing the rate of respiration in UnT and 100 mM ethanol-treated C2C12 myotubes for 6 h in the presence of 10 μM palmitoyl carnitine followed by digitonin permeabilization and addition of 2.5 mM ADP. All data expressed as mean±SD from at least 5 biological replicates for experiments in UnT and 6 h 100mM ethanol-treated myotubes and gastrocnemius muscle from at least 4 mice in EF and PF mice each group *P <0.05; **P <0.01; ***P <0.001 compared to respective controls. A ADP; Glutamate; M malate; P pyruvate; S succinate. C complexes in the ETC; E ethanol-treated myotubes; Max R maximum respiration; RR capacity reserve respiratory capacity; Rot. Rotenone; UnT untreated myotubes.
Figure 3.
Figure 3.. Ethanol reduced muscle redox ratio and ATP content in myotubes and muscle tissue.
A. Ratio of NAD+/NADH in myotubes during ethanol exposure at different time points. B. Total ATP content in murine C2C12 myotubes treated with 100mM ethanol for 6 hours. C. ATP content in gastrocnemius muscle from EF mice compared to that from PF mice. D. Representative immunoblots and densitometry of citrate synthase (CS) and voltage dependent anion channel (VDAC) in UnT and ethanol-treated myotubes. E. Representative immunoblots and densitometry of CS and VDAC in gastrocnemius muscle of PF and EF mice. F. CS activity in UnT and myotubes treated with 6 h 100 mM E. G. CS activity in gastrocnemius muscle from EF and PF mice. All data expressed as mean±SD from at least 3 biological replicates for experiments in UnT and 6 h 100 mM E myotubes and at least 4 mice in EF and PF mice in each group *P <0.05; **P <0.01; ***P <0.001 compared to respective controls.
Figure 4.
Figure 4.. Impaired electron flow through complex I and increases electron leak from complex III in ethanol-treated differentiated C2C12 myotubes.
A. Ethanol-induced generation of hydrogen peroxide measured using the amplex red fluorescence assay in differentiated C2C12 myotubes. Blocking complex III with Antimycin A (AMA) had the greatest effect on hydrogen peroxide production. Blocking complex I with rotenone (Rot.), nearly completely reversed ethanol-induced electron flow down the electrochemical gradient. B. Hydrogen peroxide generated in myotubes in the presence of blockers of a combination of complexes of the ETC (to determine the specific source of the superoxide generated in the ETC in the mitochondria) also showed that the principal source of electron leak occurs at complex III. The electron flow was mainly through complex I, because inhibition of either complex II or III increased the electron leak whereas inhibition of complex I reduces the leak. C. Representative immunofluorescence images of C2C12 myotubes stained with tetramethylrhodamine ethyl ester (TMRE, Molecular Probes). D. Flow cytometry gated TMRE fluorescence of untreated and 1 h and 6 h 100mM ethanol-treated C2C12 myotubes showed progressive reduction in inner membrane potential. UnT untreated; 100mM ethanol-treated for stated times. All data expressed as mean±SD. *P < 0.05; **P < 0.01; ***P < 0.001 compared to UnT. aP < 0.05, bP < 0.01, and cP < 0.001 compared to ethanol-treated (E) group. AMA antimycin A; DM dimethyl malonate; Rot-rotenone.
Figure 5.
Figure 5.. Ethanol alters redox status and generates mitochondrial ROS in C2C12 myotubes that is reversed by MitoTEMPO.
A. Flow cytometry gated DCFDA fluorescence and percentage of DCFDA fluorescent cells in differentiated C2C12 myotubes UnT or with 100 mM E for 6 h, with and without 25 nM MitoTEMPO (MT), a mitochondrial antioxidant. B. Flow cytometry derived fluorescence and percentage of cells stained by MitoSOX in response to 100 mM E for 6 h with and without 25 nM MT. C. Oxygen consumption in intact non-permeabilized myotubes in response to 100 mM E with and without MT. D. Whole cell ATP content in myotubes treated with 100 mM E for 6 h with and without 25nM MT. All experiments were done in at least 3 biological triplicates. UnT untreated myotubes, E 100mM ethanol; MT MitoTEMPO; Mean±SD. *P <0.05; **P <0.01; ***P <0.001.
Figure 6.
Figure 6.. Oxidative modification of protein and lipids during ethanol exposure in myotubes and skeletal muscle tissue.
A. Representative immunoblots and densitometry of manganese dependent superoxide dismutase (MnSOD), a mitochondrial specific antioxidant, in myotubes UnT and with 100 mM E for 6 h and gastrocnemius muscles of EF and PF mice. B-D. Representative immunoblots and densitometry for carbonylated (Carbo) proteins in UnT and E treated myotubes (B), Gastrocnemius muscle from PF and EF mice (C) and human patients with alcoholic cirrhosis and controls (D). E,F. Quantification of lipid peroxidation product, thiobarbituric acid reactive substances (TBARS) in 100 mM E or UnT differentiated C2C12 myotubes with and without mitochondrial antioxidant, MT (25 nM) (E) and in gastrocnemius muscle from PF and EF mice (F). All cellular experiments in at least 3 biological replicates, all mouse experiments in at least 4 mice in each group. All data expressed at mean±SD. *P <0.05; **P <0.01; ***P <0.001.
Figure 7.
Figure 7.. Ethanol exposure decreased metabolites in myotubes and skeletal muscle.
A. Pyruvate and TCA cycle intermediates in differentiated myotubes that were either UnT or treated with 100 mM E, with or without 25 nM MT for 6 hours compared to controls. B. Pyruvate and TCA cycle intermediates in gastrocnemius muscle from PF and EF mice. All data expressed as mean±SD from at least 6 biological replicates for experiments in myotubes and at least 4 mice in each group. *P <0.05; **P <0.01; ***P <0.001 compared to respective controls.
Figure 8.
Figure 8.. Reversal of ethanol-induced sarcopenic phenotype with restoration of mitochondrial ATP synthesis in differentiated C2C12 myotubes.
A, B. Representative photomicrographs (A) and diameter (B) of C2C12 myotubes that were UnT or treated with 100 mM E with and without 25 nM MT. C. Representative immunoblots and densitometry of puromycin incorporation in C2C12 myotubes that were UnT or E with or without 20μM cytosine arabinoside (AraC) for 24h. D. Representative immunoblots and densitometry of puromycin incorporation in C2C12 myotubes that were UnT or E with or without 25 nM MT. E. Representative immunoblots and densitometry of autophagy markers, LC3 lipidation and Beclin1 in murine C2C12 myotubes either UnT or with 100 mM E and 100 μM chloroquine (CQ) to quantify autophagy flux. F. Representative immunoblots and densitometry of LC3 lipidation and Beclin 1 expression in murine C2C12 myotubes treated with 100 mM E for 6 h with and without 25 nM MT. All experiments in at least 3 biological replicates. Diameter of at least 100 myotubes for each group were quantified. All data expressed as mean±SD. *P <0.05; **P <0.01; ***P <0.001.

Similar articles

Cited by

References

    1. Chen Q, Vazquez EJ, Moghaddas S, Hoppel CL, Lesnefsky EJ, Production of reactive oxygen species by mitochondria: central role of complex III, J Biol Chem 278(38) (2003) 36027–31. - PubMed
    1. Ye F, Hoppel CL, Measuring oxidative phosphorylation in human skin fibroblasts, Anal Biochem 437(1) (2013) 52–8. - PubMed
    1. Murphy MP, How mitochondria produce reactive oxygen species, Biochem J 417(1) (2009) 1–13. - PMC - PubMed
    1. Turrens JF, Mitochondrial formation of reactive oxygen species, J Physiol 552(Pt 2) (2003) 335–44. - PMC - PubMed
    1. Zorov DB, Juhaszova M, Sollott SJ, Mitochondrial reactive oxygen species (ROS) and ROS-induced ROS release, Physiol Rev 94(3) (2014) 909–50. - PMC - PubMed

Publication types

MeSH terms