. 2019 Sep 30;9(10):210.
doi: 10.3390/metabo9100210.

Plasma Metabolic Signature and Abnormalities in HIV-Infected Individuals on Long-Term Successful Antiretroviral Therapy

Affiliations

Plasma Metabolic Signature and Abnormalities in HIV-Infected Individuals on Long-Term Successful Antiretroviral Therapy

Hemalatha Babu et al. Metabolites. .

Abstract

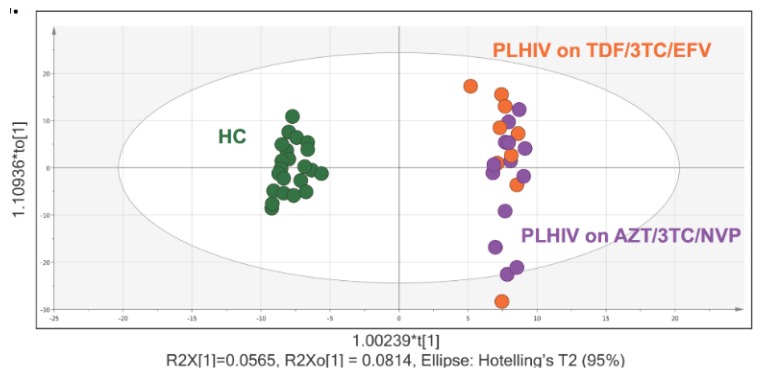
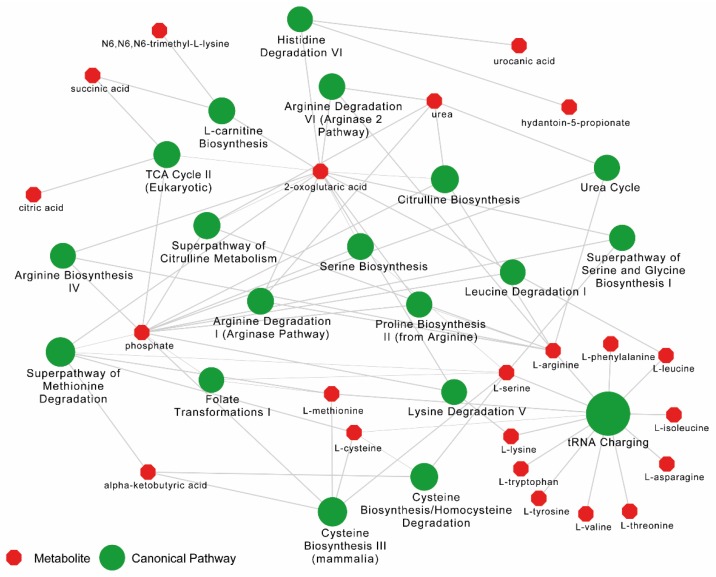
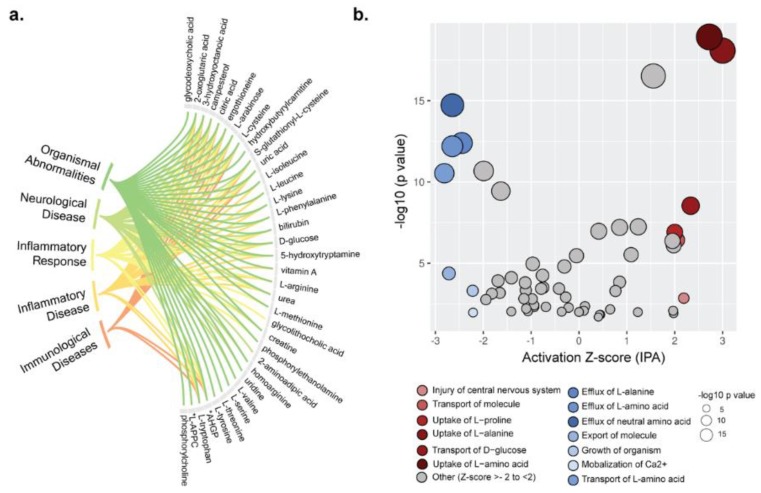
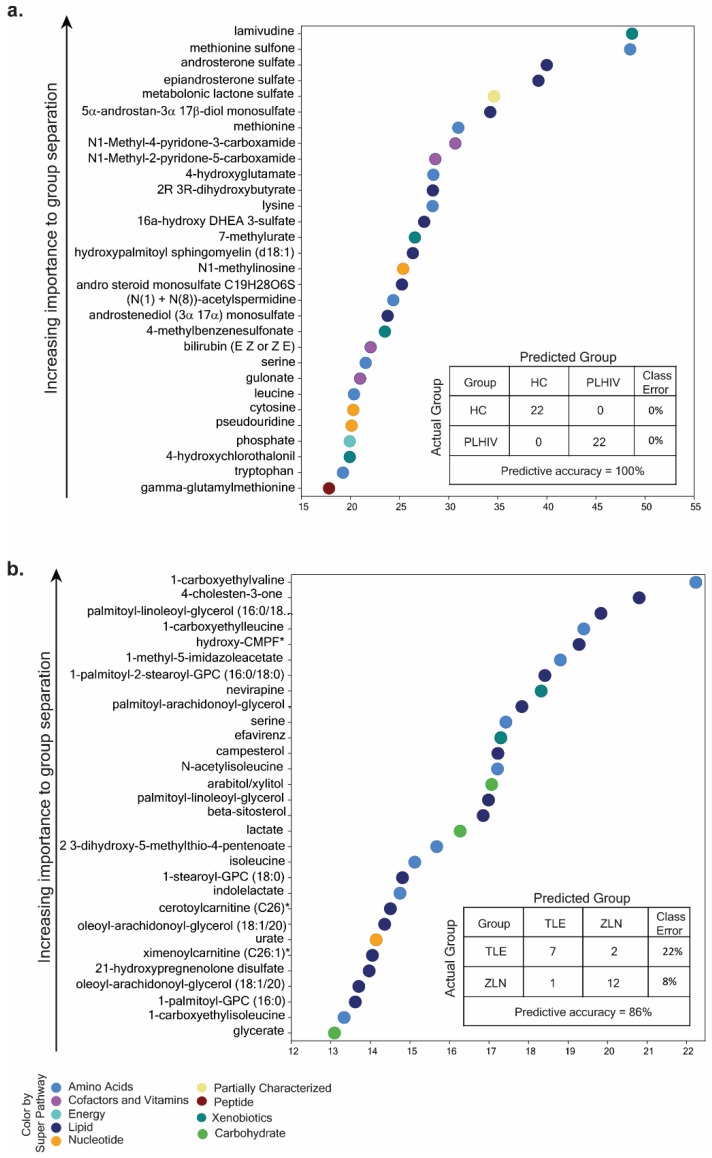
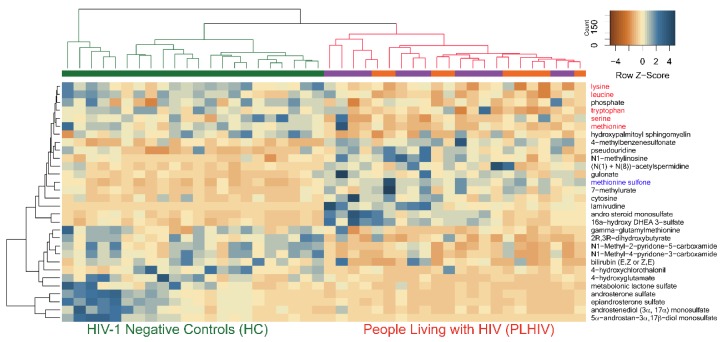
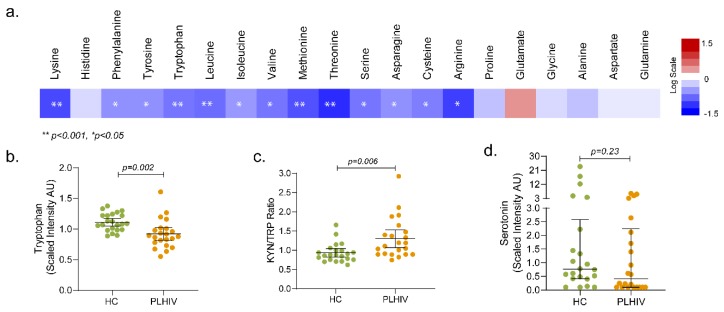
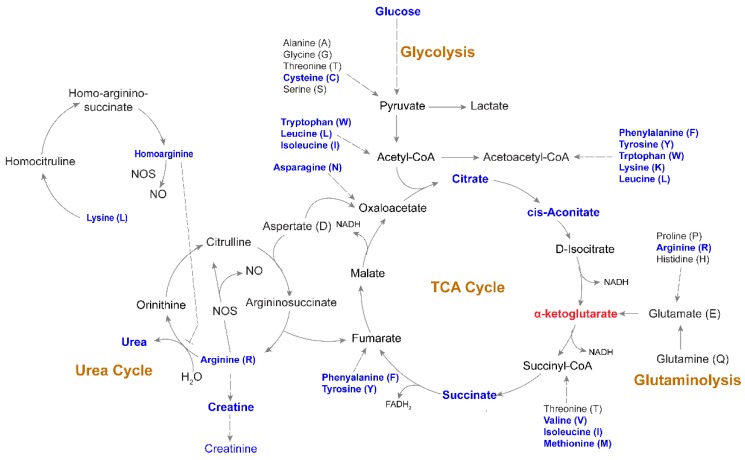
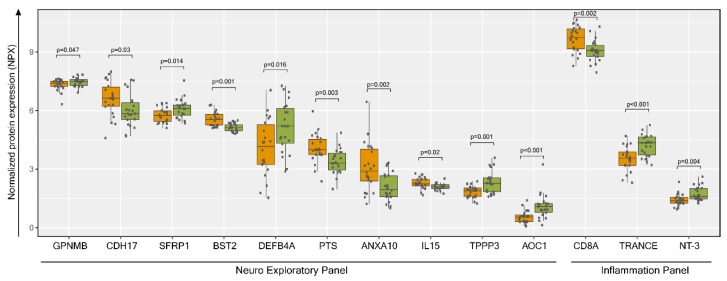
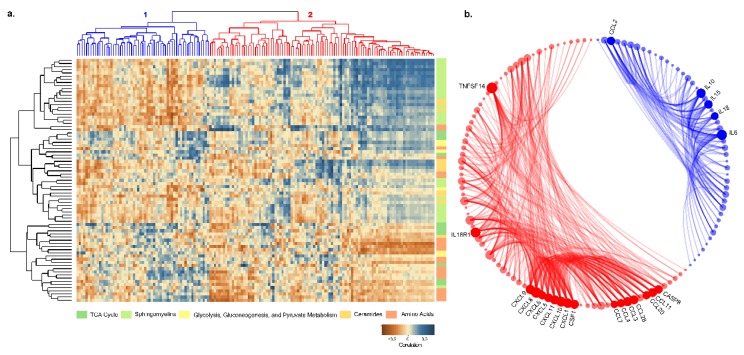
Targeted metabolomics studies reported metabolic abnormalities in both treated and untreated people living with human immunodeficiency virus (HIV) (PLHIV). The present study aimed to understand the plasma metabolomic changes and predicted the risk of accelerated aging in PLHIV on long-term suppressive antiretroviral therapy (ART) in a case-control study setting and its association with the plasma proteomics biomarkers of inflammation and neurological defects. Plasma samples were obtained from PLHIV on successful long-term ART for more than five years (n = 22) and matched HIV-negative healthy individuals (n = 22, HC herein). Untargeted metabolite profiling was carried out using ultra-high-performance liquid chromatography/mass spectrometry/mass spectrometry (UHPLC/MS/MS). Plasma proteomics profiling was performed using proximity extension assay targeting 184 plasma proteins. A total of 250 metabolites differed significantly (p < 0.05, q < 0.1) between PLHIV and HC. Plasma levels of several essential amino acids except for histidine, branched-chain amino acids, and aromatic amino acids (phenylalanine, tyrosine, tryptophan) were significantly lower in PLHIV compared to HC. Machine-learning prediction of metabolite changes indicated a higher risk of inflammatory and neurological diseases in PLHIV. Metabolic abnormalities were observed in amino-acid levels, energetics, and phospholipids and complex lipids, which may reflect known differences in lipoprotein levels in PLHIV that can resemble metabolic syndrome (MetS).

Keywords: HIV/acquired immune deficiency syndrome (AIDS); antiretroviral therapy; targeted proteomics; untargeted metabolomics.


Conflict of interest statement

The authors declare no conflicts of interest. The funders had no role in the design of the study; in the collection, analyses, or interpretation of data; in the writing of the manuscript, or in the decision to publish the results.

Figures

Figure 1
Figure 1
Orthogonal partial least square discriminant analysis (OPLS-DA) and metabolite summary: (a) OPLS plot using 1114 biochemicals, of which 901 compounds were of known identity (named biochemicals) and 213 compounds of unknown structural identity (unnamed compounds) identified group clustering of human immunodeficiency virus (HIV)-negative control (green) and people living with HIV (PLHIV) on Tenofovir/Lamivudine/Efavirenz (TDF/3TC/EFV) (orange) and PLHIV on Zidovudine/Lamivudine/Nevirapine (AZT/3TC/NVP) (purple).
Figure 2
Figure 2
Metabolite summary. Four different comparative analyses were performed on PLHIV compared to healthy control (HC vs. PLHIV), patients on Tenofovir/Lamivudine/Efavirenz (TLE) compared to HC (HC vs. TLE), patients on Zidovudine/Lamivudine/Nevirapine (ZLN) compared to HC (HC vs. ZLN), and patients on ZLN compared to patients on TLE (ZLN vs. TLE). (a) Number of metabolites that were significantly (p < 0.05, q < 0.1) lower in PLHIV, TLE, and ZLN (marked in bold) compared to HC and patients on ZLN (marked in bold) compared to patients on TLE. (b) Number of metabolites that were significantly (p < 0.05, q < 0.1) higher in PLHIV, TLE, and ZLN (marked in bold) compared to HC and patients on ZLN (marked in bold) compared to patients on TLE.
Figure 3
Figure 3
Pathway enrichment analysis results from Ingenuity Pathway Analysis (IPA) for metabolome data between PLHIV and HC. Top 20 canonical pathways (in green) are shown. Bubble sizes are relative to p-values. The metabolites (in red) related to each pathway are linked with a continuous gray line.
Figure 4
Figure 4
Metabolome annotation and biofunction analysis. (a) Metabolome annotation results obtained from ingenuity pathway analysis (IPA). The figure visualizes the most significant biological functions (p < 0.05) and corresponding metabolites. (b) Pathway enrichment analysis results from IPA for metabolome data. IPA generated activation z-scores in the x-axis and p-values in the y-axis. Bubble sizes are relative to p-values. A negative z-score implies significant downregulation of the pathway and vice versa.
Figure 5
Figure 5
(a) Random forest (RF) analysis of named biochemicals resulted in predictive accuracies of 100% for HC vs. PLHIV. The biochemical importance plots display the top 30 metabolites which most strongly contribute to the groups’ separation for HC vs. PLHIV based on amino-acid metabolism, lipid metabolism, energy metabolism, co-factors and vitamins, peptides, and xenobiotics, as indicated in different colors in the legend. (b) The RF analysis of named biochemicals resulted in predictive accuracies of 86% for PLHIV-TLE vs. PLHIV-ZLN. The biochemical importance plots display the top 30 metabolites which most strongly contribute to the groups’ separation based on amino-acid metabolism, carbohydrate metabolism, lipid metabolism, nucleotide metabolism, and xenobiotics.
Figure 6
Figure 6
The hierarchical clustering of all the samples (HC and PLHIV) indicated negative z-scores for lysine, leucine, methionine tryptophan, and serine (marked in red), indicating lower levels in PLHIV compared to HC; however, methionine sulfone (marked in blue) had a higher level with positive z-scores in PLHIV.
Figure 7
Figure 7
Metabolic pathways associated with HIV-1 infection following long-term therapy (a) Altered amino-acid metabolism. Amino acids (n = 20) that were significantly lower (in blue) or higher (in red) in PLHIV compared to HC. The level of tryptophan (b), Kyn/Trp ratio (c), and serotonin (d).
Figure 8
Figure 8
Altered metabolic pathways associated with HIV-1 infection following long-term therapy Schematic map of tricarboxylic acid (TCA) cycle, glycolysis, urea cycle, and glutaminolysis. Blue indicates a significantly (p < 0.05) lower level of metabolites in PLHIV compared to HC. α-ketoglutarate was the only metabolite that had a significantly higher level (marked in red) in PLHIV compared to HC.
Figure 9
Figure 9
Plasma proteomics profiling and protein metabolite interactions. Normalized protein expression (NPX) visualization of significantly enriched proteins (p < 0.05) from Welch’s two-sample t-test between HC (green) and PLHIV (orange) groups. GPNMB: Transmembrane glycoprotein NMB (GPNMB), CDH17: cadherin-17, SFRP1: secreted frizzled-related protein 1, BST2: bone marrow stromal antigen 2, DEFB4A: defensin beta 4, PTS: 6-pyruvoyltetrahydropterin synthase, ANXA10: annexin A 10, IL15: Interleukin 15, TPPP3: tubulin polymerization-promoting protein family member 3, AOC1: amiloride-sensitive amine oxidase (copper-containing), CD8A: T-cell surface glycoprotein CD8 alpha chain, TRANCE: Tumor Necrosis Factor (TNF)-related activation-induced cytokine, NT-3: neurotrophin-3.
Figure 10
Figure 10
(a) Pearson correlation coefficient visualization and hierarchical clustering between metabolites and proteins. Metabolites belonging to various categories were plotted in rows and proteins in columns. (b) Protein–protein interaction results between two clusters of proteins from correlation clustering. Blue elements are cluster-1 proteins, and red elements are cluster-2 proteins. Bubble size is relative to the number of interactions, and each ribbon implies an interaction.

Similar articles

Cited by

References

    1. Deeks S.G. HIV infection, inflammation, immunosenescence, and aging. Annu. Rev. Med. 2011;62:141–155. doi: 10.1146/annurev-med-042909-093756. - DOI - PMC - PubMed
    1. Smit M., Brinkman K., Geerlings S., Smit C., Thyagarajan K., Sighem A., de Wolf F., Hallett T.B. Future challenges for clinical care of an ageing population infected with HIV: A modelling study. Lancet Infect. Dis. 2015;15:810–818. doi: 10.1016/S1473-3099(15)00056-0. - DOI - PMC - PubMed
    1. Scarpellini B., Zanoni M., Sucupira M.C., Truong H.M., Janini L.M., Segurado I.D., Diaz R.S. Plasma Metabolomics Biosignature According to HIV Stage of Infection, Pace of Disease Progression, Viremia Level and Immunological Response to Treatment. PLoS ONE. 2016;11:e0161920. doi: 10.1371/journal.pone.0161920. - DOI - PMC - PubMed
    1. Siegel M.O., Borkowska A.G., Dubrovsky L., Roth M., Welti R., Roberts A.D., Parenti D.M., Simon G.L., Sviridov D., Simmens S., et al. HIV infection induces structural and functional changes in high density lipoproteins. Atherosclerosis. 2015;243:19–29. doi: 10.1016/j.atherosclerosis.2015.08.036. - DOI - PMC - PubMed
    1. Williams A.A., Sitole L.J., Meyer D. HIV/HAART-associated oxidative stress is detectable by metabonomics. Mol. Biosyst. 2017;13:2202–2217. doi: 10.1039/C7MB00336F. - DOI - PubMed

LinkOut - more resources