. 2019 Sep 30;24(19):3539.
doi: 10.3390/molecules24193539.

Bacopasides I and II Act in Synergy to Inhibit the Growth, Migration and Invasion of Breast Cancer Cell Lines

Affiliations

Bacopasides I and II Act in Synergy to Inhibit the Growth, Migration and Invasion of Breast Cancer Cell Lines

Helen M Palethorpe et al. Molecules. .

Abstract

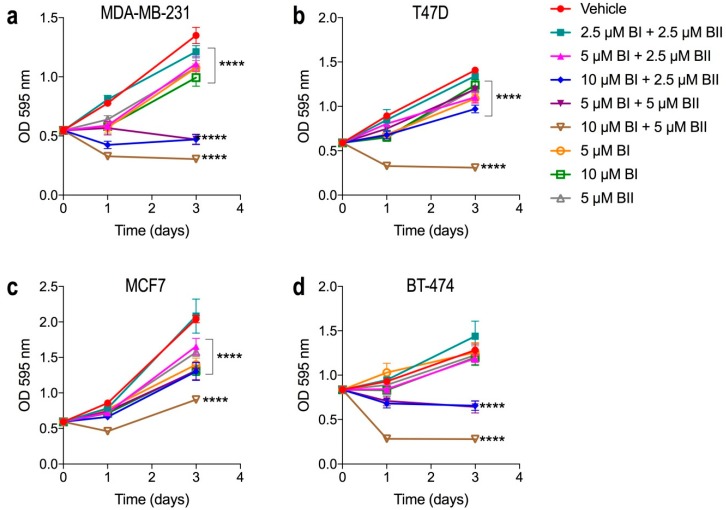
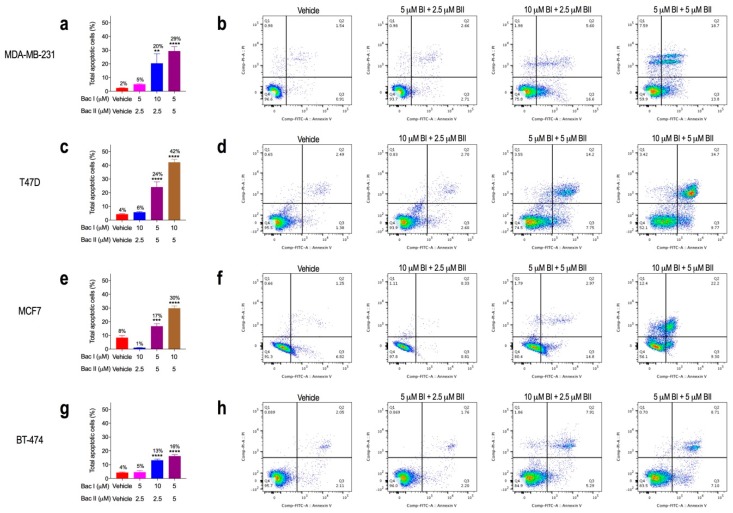
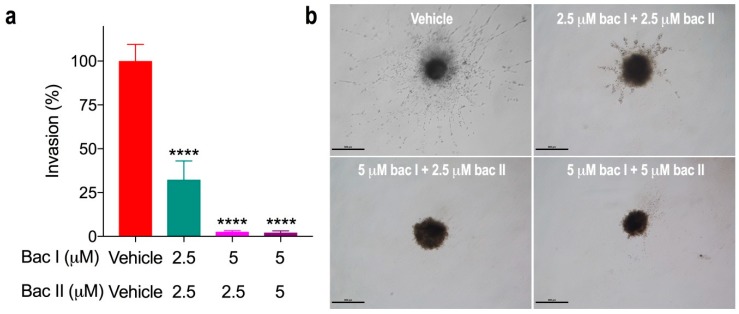
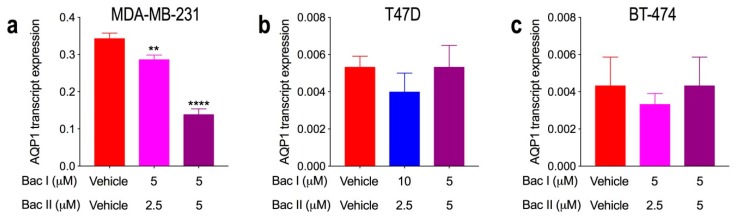
Bacopaside (bac) I and II are triterpene saponins purified from the medicinal herb Bacopa monnieri. Previously, we showed that bac II reduced endothelial cell migration and tube formation and induced apoptosis in colorectal cancer cell lines. The aim of the current study was to examine the effects of treatment with combined doses of bac I and bac II using four cell lines representative of the breast cancer subtypes: triple negative (MDA-MB-231), estrogen receptor positive (T47D and MCF7) and human epidermal growth factor receptor 2 (HER2) positive (BT-474). Drug treatment outcome measures included cell viability, proliferation, cell cycle, apoptosis, migration, and invasion assays. Relationships were analysed by one- and two-way analysis of variance with Bonferroni post-hoc analysis. Combined doses of bac I and bac II, each below their half maximal inhibitory concentration (IC50), were synergistic and reduced the viability and proliferation of the four breast cancer cell lines. Cell loss occurred at the highest dose combinations and was associated with G2/M arrest and apoptosis. Migration in the scratch wound assay was significantly reduced at apoptosis-inducing combinations, but also at non-cytotoxic combinations, for MDA-MB-231 and T47D (p < 0.0001) and BT-474 (p = 0.0003). Non-cytotoxic combinations also significantly reduced spheroid invasion of MDA-MB-231 cells by up to 97% (p < 0.0001). Combining bac I and II below their IC50 reduced the viability, proliferation, and migration and invasiveness of breast cancer cell lines, suggesting synergy between bac I and II.

Keywords: bacopaside I; bacopaside II; breast cancer; migration; spheroid invasion; synergy; triple negative breast cancer.


Conflict of interest statement

The authors declare no conflict of interest. The funders had no role in the design of the study; in the collection, analyses, or interpretation of data; in the writing of the manuscript, or in the decision to publish the results.

Figures

Figure 1
Figure 1
The IC50 for Bac I and Bac II in breast cancer cell lines. Breast cancer cell lines were treated with different doses of bac I or bac II and their cell viability determined by MTS assay. Data are the mean ± SD of six replicates from a representative experiment normalised to the vehicle control for bac I (a) and bac II (b). Non-linear regression analysis for bac I and bac II were used to calculate IC50 values for each drug. Relationships to the vehicle control were determined by one-way ANOVA with Bonferroni test. Regarding the synergy of bac I and bac II for MDA-MB-231 (c), cells were treated with varying doses of bac I combined with a constant dose of bac II (2.5 μM) for 24 h. Data are the mean ± SD of six replicates normalised to the vehicle control, with IC50 determined by non-linear regression analysis. The IC50s for each drug used individually (d) were plotted as an isobologram (red theoretical line) for MDA-MB-231. The IC50 combination of bac I and II was also plotted, with the 95% CI represented by the black line.
Figure 2
Figure 2
Bac I and II combined reduced breast cancer cell proliferation. BI: bac I; BII: bac II. Cells were seeded in 96-well plates and treated with bac I (BI) and bac II (BII), alone or in combination: a, MDA-MB-231; b, T47D; c, MCF7; d, BT-474. Plates were stained with crystal violet on days 0, 1, and 3 of treatment. Data are the mean ± SD of six replicates from a reproducible experiment. p-values shown are for absorbance on day 3, comparing treatment relative to the vehicle, as determined by two-way ANOVA with multiple comparisons and Bonferroni test (**** p < 0.0001).
Figure 3
Figure 3
Higher combinations of bac I and II induced G2/M arrest in breast cancer cell lines. Cells were treated with vehicle or combinations of bac I and bac II for 24 h. Cells were stained with propidium iodide (25 μg/mL) and bovine pancreas ribonuclease A (40 μg/mL), and analysed on the BD FACSCanto II cell analyser. The percentage of the population in G0/G1, S, and G2/M phases of the cell cycle (left) and representative histograms (right) of propidium iodide-stained DNA, also showing sub-G1 events, for MDA-MB-231 (a, b), T47D (c, d), MCF7 (e, f) and BT-474 (g, h) are shown. Data are the mean ± SD of three biological replicates. Two-way ANOVA with multiple comparisons and Bonferroni test was performed for statistical analysis. Grey-shaded regions represent the constraints applied to improve the fit of the Watson model.
Figure 4
Figure 4
Higher-dose combinations of bac I and II induced apoptosis in breast cancer cell lines. Graphs (a,c,e,g) show the effect of the vehicle or bac I and bac II combined on the percentage of total apoptotic cells (early and late), with the representative scatterplots (b,d,f,h) showing the population gates of viable cells (left lower quadrant) or cells in early apoptosis (right lower quadrant), late apoptosis (right upper quadrant), or necrosis (left upper quadrant). Results for MDA-MB-231 (a,b), T47D (c,d), MCF7 (e,f) and BT-474 (g,h) are the mean ± SD of apoptotic cells from a representative experiment (n = 3). p-values, relative to vehicle, were determined by one-way ANOVA with Bonferroni test (** p = 0.001; *** p = 0.0003; **** p < 0.0001).
Figure 5
Figure 5
Cytotoxic and non-cytotoxic combinations of bac I and II reduced breast cancer cell migration. (ad) The percentage of wound closure relative to closure at time 0, for MDA-MB-231 (a), T47D (b), MCF7 (c) and BT-474 (d). Wound area was measured using NIS-Elements software (Nikon, Tokyo, Japan). Data are the mean ± SD of six replicates from a representative experiment repeated in triplicate. P-values are for closure relative to vehicle at each time point, determined by one-way ANOVA with Bonferroni test (* p ≤ 0.045; ** p = 0.003; *** p ≤ 0.0007, **** p < 0.0001).
Figure 6
Figure 6
Non-cytotoxic combinations of bac I and II reduced MDA-MB-231 invasion in the spheroid invasion assay. MDA-MB-231 cells formed spheroids for three days prior to being embedded in the invasion matrix and treated with the vehicle, or bac I and bac II. The size of the spheroid was measured using NIS-Elements software (Nikon) daily for up to 4 days. (a) Invasion on day 3 of treatment was normalised to the average vehicle and expressed as the mean ± SD of three replicate wells. P-values are relative to the vehicle **** p < 0.0001). (b) Representative microscopic images (40× magnification; scale bar = 500 μm).
Figure 7
Figure 7
Relative aquaporin-1 (AQP1) transcript expression for breast cancer cell lines and the effect of bac I and II combined. Cells were treated for 24 h with the vehicle or bac I and II. Effect of bac I and II on transcript expression of AQP1 relative to vehicle for (a) MDA-MB-231 (** p = 0.004, **** p < 0.0001), (b) T47D, and (c) BT-474. Data are the mean ± SD of three replicates, with AQP1 transcript expression normalised to the CCSER2 reference gene and expressed as 2−ΔCt. P-values are relative to the vehicle and determined by one-way ANOVA with Bonferroni test.

Similar articles

Cited by

References

    1. Bray F., Ferlay J., Soerjomataram I., Siegel R.L., Torre L.A., Jemal A. Global cancer statistics 2018: GLOBOCAN estimates of incidence and mortality worldwide for 36 cancers in 185 countries. CA: A Cancer J. Clin. 2018;68:394–424. doi: 10.3322/caac.21492. - DOI - PubMed
    1. Yersal O., Barutca S. Biological subtypes of breast cancer: Prognostic and therapeutic implications. World J. Clin. Oncol. 2014;5:412–424. doi: 10.5306/wjco.v5.i3.412. - DOI - PMC - PubMed
    1. DeMichele A., Yee D., Esserman L. Mechanisms of Resistance to Neoadjuvant Chemotherapy in Breast Cancer. N. Engl. J. Med. 2017;377:2287–2289. doi: 10.1056/NEJMcibr1711545. - DOI - PubMed
    1. Luque-Cabal M., García-Teijido P., Fernández-Pérez Y., Sánchez-Lorenzo L., Palacio-Vázquez I. Mechanisms behind the Resistance to Trastuzumab in HER2-Amplified Breast Cancer and Strategies to Overcome It. Clin. Med. Insights Oncol. 2016;10:21–30. doi: 10.4137/CMO.S34537. - DOI - PMC - PubMed
    1. Lebert J., Lester R., Powell E., Seal M., McCarthy J. Advances in the systemic treatment of triple-negative breast cancer. Curr. Oncol. 2018;25:S142–S150. doi: 10.3747/co.25.3954. - DOI - PMC - PubMed

MeSH terms