

Iduronate-2-Sulfatase-Regulated Dermatan Sulfate Levels Potentiate the Invasion of Breast Cancer Epithelia through Collagen Matrix
- PMID: 31574977
- PMCID: PMC6832158
- DOI: 10.3390/jcm8101562
Iduronate-2-Sulfatase-Regulated Dermatan Sulfate Levels Potentiate the Invasion of Breast Cancer Epithelia through Collagen Matrix
Abstract
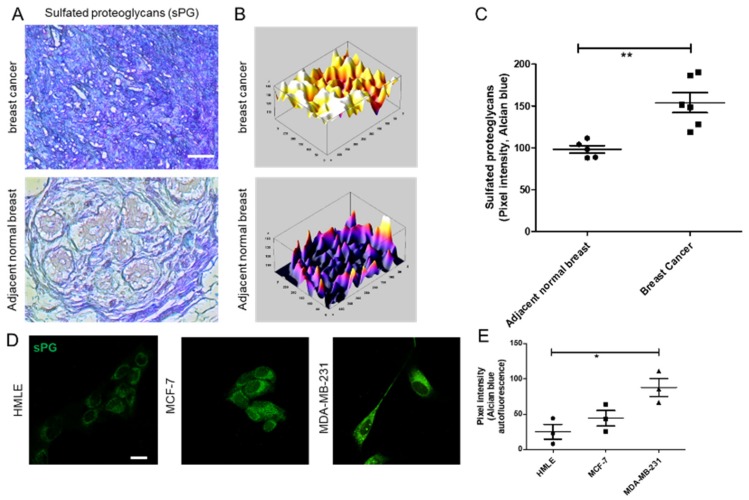
Cancer epithelia show elevation in levels of sulfated proteoglycans including dermatan sulfates (DS). The effect of increased DS on cancer cell behavior is still unclear. We hypothesized that decreased expression of the enzyme Iduronate-2-sulfatase (IDS) can lead to increased DS levels, which would enhance the invasion of cancer cells. Breast cancer sections shows depleted IDS levels in tumor epithelia, when compared with adjacent untransformed breast tissues. IDS signals showed a progressive decrease in the non-transformed HMLE, transformed but non-invasive MCF-7 and transformed and invasive MDA-MB-231 cells, respectively, when cultured on Type 1 collagen scaffolds. DS levels measured by ELISA increased in an inverse-association with IDS levels. Knockdown of IDS in MCF-7 epithelia also increased the levels of DS. MCF-7 cells with depleted IDS expression, when imaged using two photon-excited fluorescence and second harmonic generation microscopy, exhibited a mesenchymal morphology with multiple cytoplasmic projections compared with epithelioid control cells, interacted with their surrounding matrix, and showed increased invasion through Type 1 collagen matrices. Both these traits were phenocopied when control MCF-7 cells were cultivated on Type 1 collagen gels polymerized in the presence of DS. In monolayer cultures, DS had no effect on MCF-7 migration. In the context of our demonstration that DS enhances the elastic modulus of Type 1 collagen gels, we propose that a decrease of IDS expression leads to accumulation within cancer epithelia of DS: the latter remodels the collagen around cancer cells leading to changes in cell shape and invasiveness through fibrillar matrix milieu.
Keywords: breast cancer; dermatan sulfate; iduronate-2-sulfatase.
Conflict of interest statement
The authors declare no conflict of interest. The funders had no role in the design of the study; in the collection, analyses, or interpretation of data; in the writing of the manuscript, or in the decision to publish the results.
Figures


Similar articles
-
A biphasic response of polymerized Type 1 collagen architectures to dermatan sulfate.J Biomed Mater Res A. 2021 Sep;109(9):1646-1656. doi: 10.1002/jbm.a.37160. Epub 2021 Mar 9. J Biomed Mater Res A. 2021. PMID: 33687134
-
Evaluation of cerebrospinal fluid heparan sulfate as a biomarker of neuropathology in a murine model of mucopolysaccharidosis type II using high-sensitivity LC/MS/MS.Mol Genet Metab. 2018 Sep;125(1-2):53-58. doi: 10.1016/j.ymgme.2018.07.013. Epub 2018 Jul 23. Mol Genet Metab. 2018. PMID: 30064964
-
Identification of the iduronate-2-sulfatase proteome in wild-type mouse brain.Heliyon. 2019 May 10;5(5):e01667. doi: 10.1016/j.heliyon.2019.e01667. eCollection 2019 May. Heliyon. 2019. PMID: 31193135 Free PMC article.
-
Recent Advances in the Pathophysiology of Musculocontractural Ehlers-Danlos Syndrome.Genes (Basel). 2019 Dec 29;11(1):43. doi: 10.3390/genes11010043. Genes (Basel). 2019. PMID: 31905796 Free PMC article. Review.
-
Genetic heterogeneity and clinical variability in musculocontractural Ehlers-Danlos syndrome caused by impaired dermatan sulfate biosynthesis.Hum Mutat. 2015 May;36(5):535-47. doi: 10.1002/humu.22774. Epub 2015 Apr 6. Hum Mutat. 2015. PMID: 25703627 Review.
Cited by
-
Three-Dimensional Models as a New Frontier for Studying the Role of Proteoglycans in the Normal and Malignant Breast Microenvironment.Front Cell Dev Biol. 2020 Oct 9;8:569454. doi: 10.3389/fcell.2020.569454. eCollection 2020. Front Cell Dev Biol. 2020. PMID: 33163489 Free PMC article. Review.
-
Investigation of the effects of overexpression of jumping translocation breakpoint (JTB) protein in MCF7 cells for potential use as a biomarker in breast cancer.Am J Cancer Res. 2022 Apr 15;12(4):1784-1823. eCollection 2022. Am J Cancer Res. 2022. PMID: 35530281 Free PMC article.
-
Exploitation of Sulfated Glycosaminoglycan Status for Precision Medicine of Triplatin in Triple-Negative Breast Cancer.Mol Cancer Ther. 2022 Feb;21(2):271-281. doi: 10.1158/1535-7163.MCT-20-0969. Epub 2021 Nov 23. Mol Cancer Ther. 2022. PMID: 34815360 Free PMC article.
-
Genetics of enzymatic dysfunctions in metabolic disorders and cancer.Front Oncol. 2023 Aug 2;13:1230934. doi: 10.3389/fonc.2023.1230934. eCollection 2023. Front Oncol. 2023. PMID: 37601653 Free PMC article. Review.
-
Dysostosis in mucopolysaccharidosis type 2: A case of longitudinal follow up and literature review.Radiol Case Rep. 2021 Jan 8;16(3):656-660. doi: 10.1016/j.radcr.2021.01.003. eCollection 2021 Mar. Radiol Case Rep. 2021. PMID: 33488893 Free PMC article.
References
Grants and funding
LinkOut - more resources
Full Text Sources
Miscellaneous
