

Temperature accounts for the biodiversity of a hyperdiverse group of insects in urban Los Angeles
- PMID: 31575368
- PMCID: PMC6790764
- DOI: 10.1098/rspb.2019.1818
Temperature accounts for the biodiversity of a hyperdiverse group of insects in urban Los Angeles
Abstract
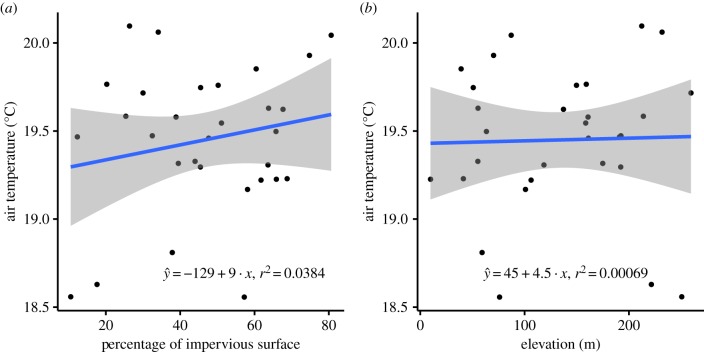
The urban heat island effect is a worldwide phenomenon that has been linked to species distributions and abundances in cities. However, effects of urban heat on biotic communities are nearly impossible to disentangle from effects of land cover in most cases because hotter urban sites also have less vegetation and more impervious surfaces than cooler sites within cities. We sampled phorid flies, one of the largest, most biologically diverse families of true flies (Insecta: Diptera: Phoridae), at 30 sites distributed within the central Los Angeles Basin, where we found that temperature and the density of urban land cover are decoupled. Abundance, richness, and community composition of phorids inside urban Los Angeles were most parsimoniously accounted for by mean air temperature in the week preceding sampling. Sites with intermediate mean temperatures had more phorid fly individuals and higher richness. Communities were more even at urban sites with lower minimum temperatures and sites located further away from natural areas, suggesting that communities separated from natural source populations may be more homogenized. Species composition was best explained by minimum temperature. Inasmuch as warmer areas within cities can predict future effects of climate change, phorid fly communities are likely to shift nonlinearly under future climates in more natural areas. Exhaustive surveys of biotic communities within cities, such as the one we describe here, can provide baselines for determining the effects of urban and global climate warming as they intensify.
Keywords: climate change; phorid fly; species richness; urban heat island.
Conflict of interest statement
We declare we have no competing interests.
Figures


Similar articles
-
Local- and landscape-scale variables shape insect diversity in an urban biodiversity hot spot.Ecol Appl. 2020 Jun;30(4):e02089. doi: 10.1002/eap.2089. Epub 2020 Mar 5. Ecol Appl. 2020. PMID: 32017294 Free PMC article.
-
Urban warming trumps natural enemy regulation of herbivorous pests.Ecol Appl. 2014;24(7):1596-607. doi: 10.1890/13-1961.1. Ecol Appl. 2014. PMID: 29210225
-
Drivers of arthropod biodiversity in an urban ecosystem.Sci Rep. 2024 Jan 3;14(1):390. doi: 10.1038/s41598-023-50675-3. Sci Rep. 2024. PMID: 38172148 Free PMC article.
-
Responses of terrestrial arthropods to air pollution: a meta-analysis.Environ Sci Pollut Res Int. 2010 Feb;17(2):297-311. doi: 10.1007/s11356-009-0138-0. Epub 2009 Mar 25. Environ Sci Pollut Res Int. 2010. PMID: 19319587 Review.
-
Exploring urban green packages as part of Nature-based Solutions for climate change adaptation measures in rapidly growing cities of the Global South.J Environ Manage. 2022 May 15;310:114786. doi: 10.1016/j.jenvman.2022.114786. Epub 2022 Feb 28. J Environ Manage. 2022. PMID: 35240569 Review.
Cited by
-
Feather macrostructure is marginally correlated with temperature range but not urbanization across California.Sci Rep. 2025 Jul 7;15(1):24291. doi: 10.1038/s41598-025-04378-6. Sci Rep. 2025. PMID: 40624026 Free PMC article.
-
Resolving biology's dark matter: species richness, spatiotemporal distribution, and community composition of a dark taxon.BMC Biol. 2024 Sep 27;22(1):215. doi: 10.1186/s12915-024-02010-z. BMC Biol. 2024. PMID: 39334308 Free PMC article.
-
Landscape and Season Influence Bat Activity and Richness in a Mediterranean Metropolitan Area.Ecol Evol. 2025 Aug 13;15(8):e71978. doi: 10.1002/ece3.71978. eCollection 2025 Aug. Ecol Evol. 2025. PMID: 40809820 Free PMC article.
-
Local- and landscape-scale variables shape insect diversity in an urban biodiversity hot spot.Ecol Appl. 2020 Jun;30(4):e02089. doi: 10.1002/eap.2089. Epub 2020 Mar 5. Ecol Appl. 2020. PMID: 32017294 Free PMC article.
-
Anthropogenic effects on the body size of two neotropical orchid bees.BMC Ecol Evol. 2022 Aug 2;22(1):94. doi: 10.1186/s12862-022-02048-z. BMC Ecol Evol. 2022. PMID: 35918637 Free PMC article.
References
-
- Lundholm JT, Marlin A. 2006. Habitat origins and microhabitat preferences of urban plant species. Urban Ecosyst. 9, 139–159. (10.1007/s11252-006-8587-4) - DOI
-
- Gómez-Baggethun E, et al. . 2013. Urban ecosystem services. In Urbanization, biodiversity and ecosystem services: challenges and opportunities (eds Elmqvist T, et al.). Dordrecht, The Netherlands: Springer; (10.1007/978-94-007-7088-1) - DOI
-
- Potter A, LeBuhn G. 2015. Pollination service to urban agriculture in San Francisco, CA. Urban Ecosyst. 18, 885–893. (10.1007/s11252-015-0435-y - DOI
