. 2019 Dec;181(4):1587-1599.
doi: 10.1104/pp.19.00197. Epub 2019 Oct 1.

The TCP4 Transcription Factor Directly Activates TRICHOMELESS1 and 2 and Suppresses Trichome Initiation

Affiliations

The TCP4 Transcription Factor Directly Activates TRICHOMELESS1 and 2 and Suppresses Trichome Initiation

Batthula Vijaya Lakshmi Vadde et al. Plant Physiol. 2019 Dec.

Abstract

Trichomes are the first line of defense on the outer surface of plants against biotic and abiotic stresses. Because trichomes on leaf surfaces originate from the common epidermal progenitor cells that also give rise to pavement cells and stomata, their density and distribution are under strict genetic control. Regulators of trichome initiation have been identified and incorporated into a biochemical pathway wherein an initiator complex promotes trichome fate in an epidermal progenitor cell, while an inhibitor complex suppresses it in the neighboring cells. However, it is unclear how these regulator proteins, especially the negative regulators, are induced by upstream transcription factors and integrated with leaf morphogenesis. Here, we show that the Arabidopsis (Arabidopsis thaliana) class II TCP proteins activate TRICHOMELESS1 (TCL1) and TCL2, the two established negative regulators of trichome initiation, and reduce trichome density on leaves. Loss-of-function of these TCP proteins increased trichome density whereas TCP4 gain-of-function reduced trichome number. TCP4 binds to the upstream regulatory elements of both TCL1 and TCL 2 and directly promotes their transcription. Further, the TCP-induced trichome suppression is independent of the SQUAMOSA PROMOTER BINDING PROTEIN LIKE family of transcription factors, proteins that also reduce trichome density at later stages of plant development. Our work demonstrates that the class II TCP proteins couple leaf morphogenesis with epidermal cell fate determination.


Figures

Figure 1.
Figure 1.
Trichome density in class II TCP mutant lines. A, Top-view of 9-d–old seedlings (from left to right) of Col-0, tcp2;tcp4;tcp10, jaw-d, TCP4:VP16 (pTCP4::TCP4:VP16), and pBLS::rTCP4:GFP to highlight the trichomes on the first pair of leaves. Scale bars = 1 mm. B to D and F, Trichome density as expressed in number in unit area on the adaxial surface of mature first (B, C, and F) or eighth (D) leaf in TCP loss (B) and gain-of-function (C, D, and F) mutants. Averages of four to seven leaf pairs (B, C, and F; total 60–300 trichomes) or three leaves (D; 250–1000 trichomes) are shown. “Mock” and “DEX” indicate the absence and presence of 12-μm DEX, respectively. E and G, Trichome density as expressed in number of trichomes per pavement cell on the adaxial surface of first pair of leaves of indicated genotypes (E) and in the absence (Mock) and presence (DEX) of 12-μm DEX (G). Sample number is four to five leaves for (E) and (G). jaw-d;GR indicates pTCP4::mTCP4:GR in jaw-D backgrounds. Error bars in (B–G) indicate sd. *P ≤ 0.05; unpaired Student’s t test was performed.
Figure 2.
Figure 2.
Expression of trichome initiation genes in TCP mutants. A, “Genevestigator” (https://genevestigator.com/gv/) analysis of the trichome initiation genes. GL1 expression levels are highlighted with a red outline. B, Heat map representation of the expression levels of trichome initiation genes, estimated by RT-qPCR, in 12-d–old jaw-d;GR seedlings grown without (Mock) or with (DEX) 12-μm DEX. Averages of biological triplicates are shown. C and E, Differential interference contrast microscopic images of 14-d–old jaw-d;GR;pGL2::GUS (C) and jaw-d;GR;pTRY::GUS (E) homozygous seedlings, grown in the absence (Mock) or presence (DEX) of 12-μm DEX, to show GUS activity. Scale bars = 200 μm. D and F, Quantification of GUS activity in 14-d–old jaw-d;GR;pGL2::GUS (D) and jaw-d;GR;pTRY::GUS (F) seedlings, grown in the absence (Mock) or presence (DEX) of 12-μm DEX. Averages of biological triplicates are shown. G, Percentage of trichome cluster on the adaxial surface of the first pair of mature leaves of indicated genotypes. Average of five leaf pairs are plotted (total 50–230 trichomes). jaw-d;GR indicates pTCP4::mTCP4:GR in the jaw-d background. Error bars indicate mean ± sd. *P ≤ 0.05; unpaired Student’s t test was performed. ns, not significant.
Figure 3.
Figure 3.
Expression analyses of trichome genes in TCP mutants. A, Relative transcript levels of genes involved in trichome initiation as determined by RT-qPCR analysis in 12-d–old Col-0 and pTCP4::TCP4:VP16 seedlings. GIS and LOX2 were used as positive controls. Averages of biological triplicates are shown. B, Transcript level of trichome initiation genes detected in the microarray experiment of the jaw-d;GR seedlings upon TCP4 induction for 2 h and 4 h (Challa et al., 2016). C, Relative transcript levels of TCL1 and TCL2 in 12-d–old jaw-d;GR seedlings grown without (Mock) or with (DEX) 12-μm DEX. GIS was used as a positive control (Vadde et al., 2018). D, Relative transcript levels of TCL1, TCL2 and GL1 in 12-d–old p35S::mTCP4:GR seedlings after 0, 2, 4, and 8 h of TCP4 induction by DEX. Averages of biological triplicates are shown. y axis label for (C) and (D) are the same as that of (B). E and F, Relative transcript levels of TCL1 and TCL2 in TCP gain (E) and loss-of-function (F) lines compared to Col-0. Averages of biological triplicates are shown. GIS was used as a positive control in (E; Vadde et al., 2018).G, Relative levels of TCL1 and TCL2 transcripts determined by RT-qPCR analysis in 12-d–old jaw-d;GR seedlings in the absence (Mock) or presence (DEX) of 20-μm DEX along with (CHX+DEX) or (CHX) 40-μm CHX for the 4-h y axis label for (F) and (G) are the same as that of (E). GIS was used as a positive control. Averages of biological triplicates are shown. jaw-d;GR indicates pTCP4::mTCP4:GR in the jaw-d background. Error bars indicate mean ± sd.
Figure 4.
Figure 4.
TCL1 and TCL2 are direct targets of TCP4. A and B, Schematic representation of TCL1 (A) and TCL2 (B) genomic loci showing the TCP4 consensus binding sequences. BS1.1, BS2.1, and BS2.2 represent oligonucleotides used in the EMSA experiments described below to test TCP4 binding. Exons are indicated by black solid boxes with intervening introns and upstream regions are represented by black lines. Arrows indicate the translation start site. Gray solid boxes (R1.1, R1.2, R2.1, R2.2, and R2.3) indicate the regions used for PCR amplification in ChIP and FAIRE experiments. C, EMSA autoradiogram showing the retardation of the radio-labeled oligonucleotides corresponding to BS1.1 and BS2.1, but not of BS2.2, by recombinant His6-TCP4 fusion protein. Bands corresponding to free oligonucleotides and DNA–protein complex are indicated by an arrow and an asterisk, respectively. A 150- to 300-fold higher concentration of unlabeled BS1.1 and BS2.1 oligonucleotides were used for competition assay (autoradiograms in the middle and on the right), respectively. Anti-His6 antibody was used for the supershift experiment. The translucent, horizontal white strip seen in the middle was a consequence of gel processing, but does not hide any bands underneath. A replicate of the gel is shown in Supplemental Figure S4. D, ChIP analysis to test the binding of TCP4 protein to the putative TCP4-binding sites marked in (A) and (B). qPCR analysis results from two biological replicates for the enriched cis-elements in Col-0 and p35S::TCP4-3F6H seedlings are shown. TA3 and LOX2 were used as negative and positive controls, respectively. *P ≤ 0.05. ns = no significance. E and F, qPCR analysis of FAIRE samples showing the fold enrichment of various genomic regions shown in (A) and (B) upon 4 h of DEX induction in p35S::mTCP4;GR seedlings. Averages of biological triplicates were used. G and H, Schematics of various constructs used in the transient protoplast assay (G) and the relative luciferase activity (H) driven by the wild-type (WT Mock, WT DEX) or mutant (SDM Mock, SDM DEX) pTCL1::LUC construct without (WT Mock, SDM Mock) or with (WT DEX, SDM DEX) TCP4 induction by 12 μm of DEX. The 35S::mTCP4:GR effector construct was used to drive TCP4. “WT-Effector” indicates pTCL1::LUC construct alone without 35S::mTCP4:GR. 35S::GUS was used as transfection control. For (H), averages of biological duplicates are shown. Error bars indicate mean ± sd. Unpaired Student’s t test was performed.
Figure 5.
Figure 5.
pTCL1::GUS expression in TCP4 gain of function lines. A, Differential interference contrast microscopic images of third rosette leaves from 14-d–old Col-0 × pTCL1::GUS (Col-0) and pTCP4::TCP4:VP16 × pTCL1::GUS (TCP4:VP16) seedlings. Scale bars = 100 μm. B and C, Quantification of pTCL1::GUS expression by 4-methylumbelliferyl-β-d-glucuronide assay in the Col-0 × pTCL1::GUS (Col-0) and pTCP4::TCP4:VP16 × pTCL1::GUS (TCP4:VP16) seedlings (B) and in jaw-d;GR × pTCL1::GUS seedlings (C) grown in the absence (Mock) or presence (DEX) of 12-μm DEX. Averages of biological triplicates are shown. D and E, Trichome density on the adaxial surface of first pair of leaves. Averages of trichomes from four to seven leaf pairs are shown. jaw-d;GR indicates pTCP4::mTCP4:GR in the jaw-d background. Error bars indicate mean ± sd. Unpaired Student’s t test was performed. *P ≤ 0.05 and **P ≤ 0.01.
Figure 6.
Figure 6.
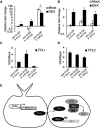
TCP activates TCL1 independent of SPL. A and B, Relative transcript levels of TCL1 (A) and TCL2 (B) determined by RT-qPCR in 12-d–old F1 seedlings of indicated genotypes. Averages of biological triplicates are shown. Error bars indicate mean ± sd. Unpaired Student’s t test was performed. *P ≤ 0.05. C and D, Levels of TCL1 and TCL2 transcripts upon DEX induction relative to mock-induction calculated from the data shown in (A) and (B). Averages of biological triplicates are shown. E, A proposed model for the regulation of trichome initiation by TCP4. TCP4 binds to the upstream regulatory region of TCLs and activates their transcription. The TCL proteins bind to GL3 (Gan et al., 2011), as do the other single-repeat MYB-transcription factors such as TRY, CPC, and ETC1, ETC2, and ETC3, and dislocate GL1 from the trichome initiation complex (TTG1-GL3/EG3-GL1), thus rendering it inactive. TCL1 also binds to the GL1 locus and represses its transcription, thereby reducing the level of GL1, which is required for trichome initiation (Wang et al., 2007).

Comment in

References

    1. Aggarwal P, Challa KR, Rath M, Sunkara P, Nath U (2018) Generation of inducible transgenic lines of Arabidopsis transcription factors regulated by microRNAs. Methods Mol Biol 1830: 61–79 - PubMed
    1. Aggarwal P, Das Gupta M, Joseph AP, Chatterjee N, Srinivasan N, Nath U (2010) Identification of specific DNA binding residues in the TCP family of transcription factors in Arabidopsis. Plant Cell 22: 1174–1189 - PMC - PubMed
    1. Alvarez JP, Furumizu C, Efroni I, Eshed Y, Bowman JL (2016) Active suppression of a leaf meristem orchestrates determinate leaf growth. eLife 5: e15023. - PMC - PubMed
    1. Balkunde R, Pesch M, Hülskamp M (2010) Trichome patterning in Arabidopsis thaliana from genetic to molecular models. Curr Top Dev Biol 91: 299–321 - PubMed
    1. Challa KR, Aggarwal P, Nath U (2016) Activation of YUCCA5 by the transcription factor TCP4 integrates developmental and environmental signals to promote hypocotyl elongation in Arabidopsis. Plant Cell 28: 2117–2130 - PMC - PubMed

Publication types

MeSH terms