. 2020 Feb;19(2):602-613.
doi: 10.1158/1535-7163.MCT-17-0256. Epub 2019 Oct 1.

Amplification of the Mutation-Carrying BRCA2 Allele Promotes RAD51 Loading and PARP Inhibitor Resistance in the Absence of Reversion Mutations

Affiliations

Amplification of the Mutation-Carrying BRCA2 Allele Promotes RAD51 Loading and PARP Inhibitor Resistance in the Absence of Reversion Mutations

Pyoung Hwa Park et al. Mol Cancer Ther. 2020 Feb.

Abstract

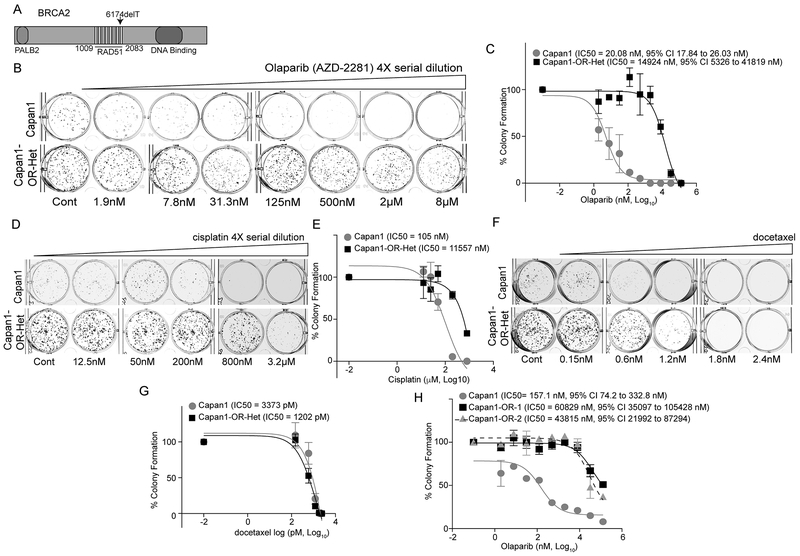
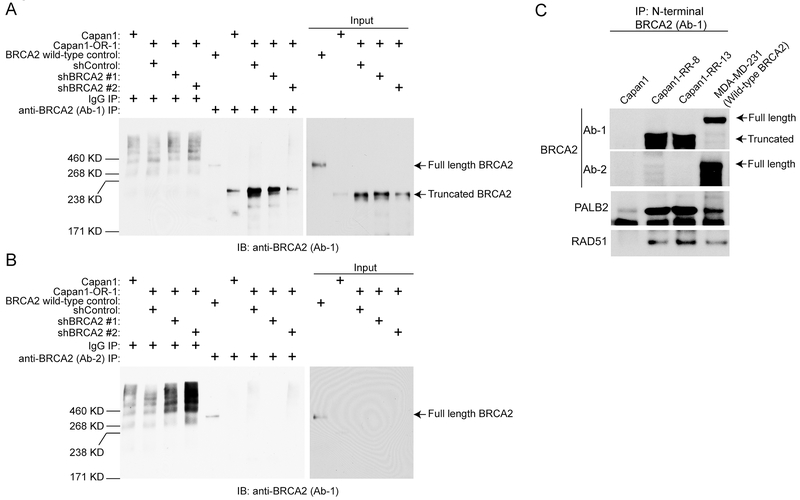
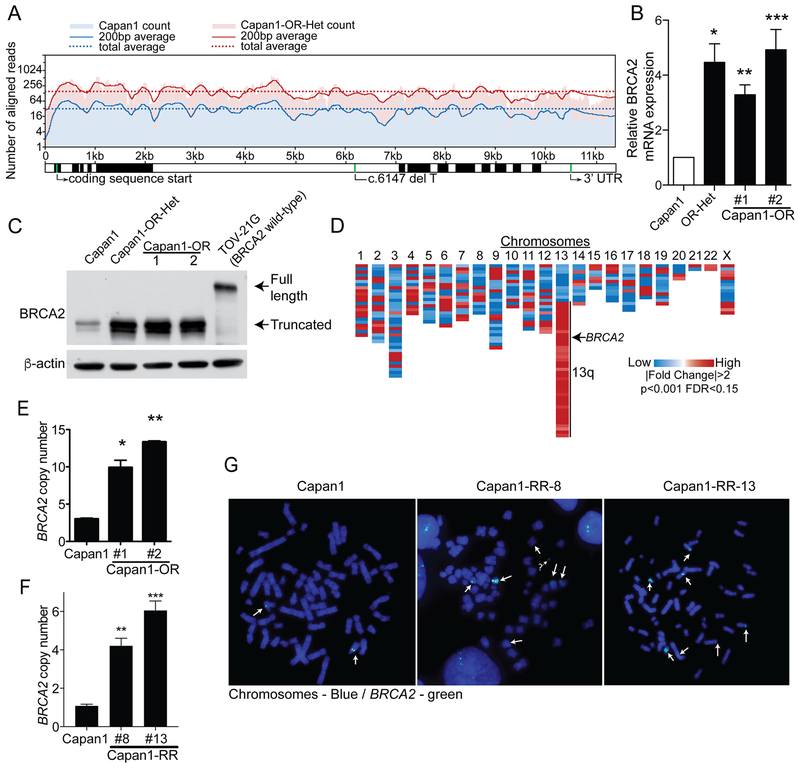
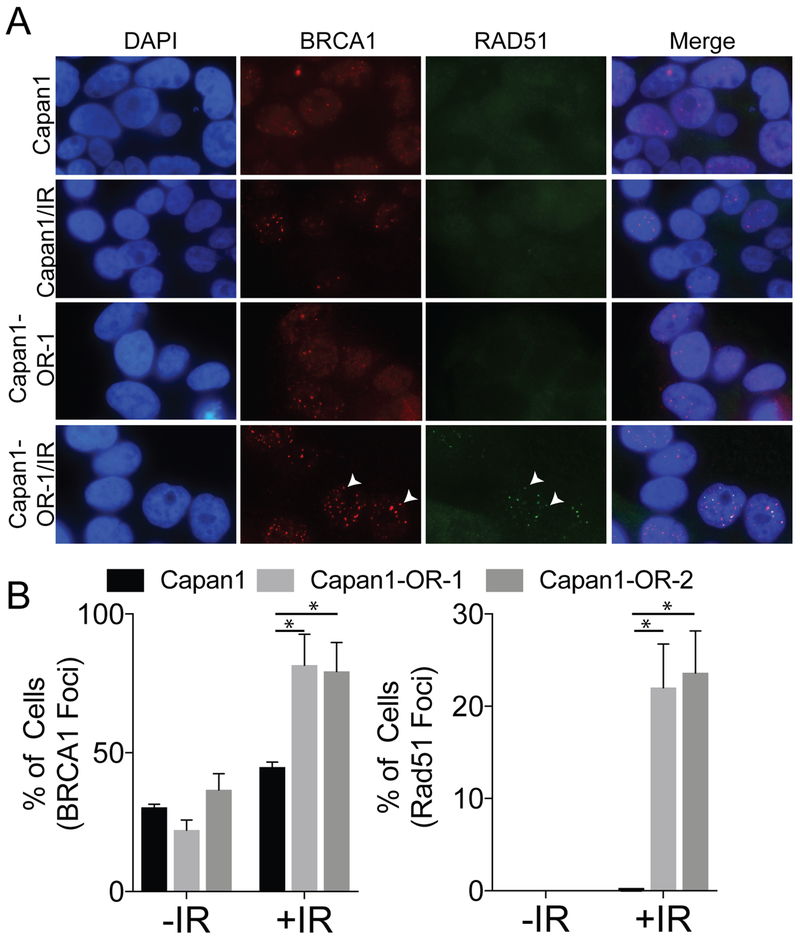
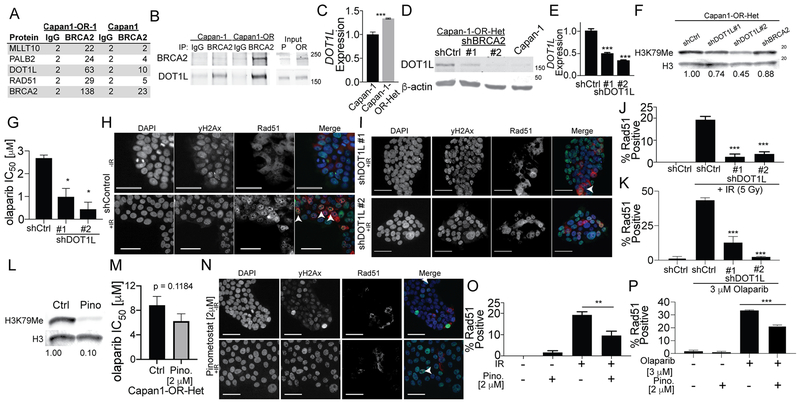
Patients harboring germline breast cancer susceptibility genes 1 and 2 (BRCA1/2) mutations are predisposed to developing breast, pancreatic, and ovarian cancers. BRCA2 plays a critical role in homologous recombination (HR) DNA repair and deleterious mutations in BRCA2 confer sensitivity to PARP inhibition. Recently, the PARP inhibitors olaparib and rucaparib were FDA approved for the treatment of metastatic breast cancer and patients with recurrent ovarian cancer with mutations in BRCA1/2. Despite their initial antitumor activity, the development of resistance limits the clinical utility of PARP inhibitor therapy. Multiple resistance mechanisms have been described, including reversion mutations that restore the reading frame of the BRCA2 gene. In this study, we generated olaparib- and rucaparib-resistant BRCA2-mutant Capan1 cell lines. We did not detect secondary reversion mutations in the olaparib- or rucaparib-resistant clones. Several of the resistant clones had gene duplication and amplification of the mutant BRCA2 allele, with a corresponding increase in expression of a truncated BRCA2 protein. In addition, HR-mediated DNA repair was rescued, as evidenced by the restoration of RAD51 foci formation. Using mass spectrometry, we identified Disruptor Of Telomeric silencing 1-Like (DOT1L), as an interacting partner of truncated BRCA2. RNAi-mediated knockdown of BRCA2 or DOT1L was sufficient to resensitize cells to olaparib. The results demonstrate that independent of a BRCA2 reversion, mutation amplification of a mutant-carrying BRCA2 contributes to PARP inhibitor resistance.


Conflict of interest statement

The authors declare no potential conflicts of interest.

Figures

Figure 1.
Figure 1.. PARP inhibitor resistant cells are cross resistant to DNA damaging agent.
A) The Capan1 pancreatic adenocarcinoma cell line has a deletion at position 6174. B) Capan1 and heterogeneous population of olaparib resistant Capan1 (Capan1-OR-Het) cells were plated on 24-well plates, treated with indicated doses of olaparib, and subjected to colony formation after 12 days. Representative images of colony formation are shown. C) Dose response curve was calculated with Capan1 (gray) and Capan1-OR-Het (black). Calculated IC50 values with 95% Confidence Intervals (CI) are indicated. D) Same as B, but examined the sensitivity to a DNA damaging agent, cisplatin, in Capan1and Capan1-OR-Het cells. Cells were treated with indicated doses. Representative images of foci formation assay are shown. E) Same as C, but a cisplatin dose response curve for Capan1 (gray) and Capan1-OR-Het (black) was calculated. F) Same as B, but sensitivity to a microtubule stabilization agent, docetaxel, was assessed in Capan1and Capan1-OR-Het cells. Cells were treated with indicated doses. Representative images of foci formation assay are shown. G) Same as C, but a docetaxel dose response curve for Capan1 (gray) and Capan1-OR-Het (black) was calculated. H) Same as C, but clonal olaparib resistant populations (Capan1-OR-1 [squares] and -2 [triangles]) were isolated and examined for olaparib sensitivity compared to Capan1 cells (circles). Colonies were counted with ImageJ software. Data is representative of 3 independent experiments. Error bars = S.E.M.
Figure 2.
Figure 2.. PARP resistant cells express truncated BRCA2.
A) Capan1-OR-1 cells were transduced with shControl and shBRCA2 (#1 and #2). Protein was extracted from Capan1, Capan1-OR-1 (shControl, shBRCA2 #1 and #2) and BRCA2-wildtype control (TOV-21G) cells. Protein was used for immunoprecipitation (IP) against isotype control (IgG) and BRCA2 (N-terminus, Ab-1). IPed protein was used for immunoblot against BRCA2. B) Same as A, but IP against BRCA2 (C-terminus, Ab-2). C) Nuclear protein was extracted from Capan1, Capan1-RR clones 8 and 13, and a BRCA2-wildtype control. Protein was used for IP against BRCA2 (N-terminus, Ab-1). IP protein was used for immunoblot against BRCA2 (Ab-1 and Ab-2), RAD51, and PALB2.
Figure 3.
Figure 3.. Truncated BRCA2 is overexpressed in CAPAN1 PARP inhibitor resistant cells.
A) Total RNA was isolated from Capan1 and Capan1-OR-Het cells and subsequently used for next generation sequencing (RNA-seq). Aligned-reads for the BRCA2 gene are shown for Capan1 (parental, blue) and Capan1-OR-Het (resistant, red) cells. B) RNA was isolated from Capan1, Capan1-OR-Het, Capan1-OR-1 and 2 and used for qPCR against BRCA2 (B2M = internal control). ANOVA, *p=0.0068, **p=0.007 and ***p=0.0027. C) Protein was extracted from Capan1, Capan1-OR-Het, Capan1-OR-1 and 2, and BRCA2-wildtype control (TOV-21G) cells. Protein was immunoblotted against BRCA2 (N-terminus). Arrows indicate full-length and truncated BRCA2. β-actin = loading control. D) RNA-seq analysis of Capan1 versus Capan1-OR-Het detected 411 differentially expressed genes (|Fold Change| >2 and False Discovery Rate [FDR] <0.15). Differentially regulated genes were mapped based on genomic location. E) Genomic DNA was isolated from Capan1, CAPAN1-OR-1 and 2 and used for qPCR on BRCA2 intron-exon junction to determine changes in gene copy number. RNase P = internal control. ANOVA, *p=0.0004 and **p<0.0001. F) Genomic DNA was isolated from Capan1, Capan1-RR-8 and 13 and utilized for qPCR BRCA2 to determine changes in gene copy number. RNase P = internal control. ANOVA, **p=0.0024 and ***p=0.0002. G) Fluorescence in situ hybridization against BRCA2 (green) in Capan1 and Capan1-RR-8 and -13 cells. Chromosomes = DAPI/blue. White arrows = positive BRCA2 regions. ? = possible extrachromosomal DNA. Data is representative of 3 independent experiments. Error bars = S.E.M.
Figure 4.
Figure 4.. Irradiated PARP resistant cells demonstrate restored homologous recombination DNA repair.
A) Capan1 (parental) and Capan1-OR-1 cells were irradiated (5 Gy) and used for immunofluorescence against BRCA1 (red) and RAD51 (green). White arrowheads indicate BRCA1 and RAD51 foci. B) Quantified BRCA1 and RAD51 foci in 200 Capan1, Capan1-OR 1 or 2 cells treated without (−IR) or with (+IR) 5 Gy and graphed as a percentage. Statistical test = ANOVA, *p < 0.05. Data is representative of at least 3 independent experiments. Error bars = S.E.M.
Figure 5.
Figure 5.. BRCA2 knockdown in CAPAN1-PR cells restores sensitivity to DNA damaging agents.
A) Capan1-OR-1 cells were transduced with shControl or shBRCA2 (#1 or #2). After drug selection RNA was collected and followed by quantitative PCR for BRCA2. ANOVA, *p < 0.001. B) Same as A, but protein was extracted and immunoblotted for BRCA2. GAPDH = loading control. C) Capan1, Capan1-OR-1 shCtrl, or Capan1-OR-1 shBRCA2 (#1 and #2) cells were plated in 24-well plates, treated with increasing doses of olaparib, and cultured for 12 days. Cells were then fixed and used for colony formation assays. Dose response curve shown with indicated IC50 values. D) Same as C, but cells were treated with cisplatin. Dose response curve shown with indicated IC50 values. E) DLD-1 BRCA2−/− cells were transduced with mCherry or GFP/HA-tagged full length (BRCA2-HA) or truncated BRCA2 (BRCA2(del6174T)-HA). RNA was isolated and BRCA2 expression was measured via qPCR. ANOVA, ***p< 0.001. F) Same as E, but cells were used for a colony formation assay with increasing doses of olaparib. FL = full length. Colonies were counted with ImageJ software. Data is representative of 3 independent experiments. Error bars = S.E.M.
Figure 6.
Figure 6.. BRCA2 interacts with DOT1L and DOT1L contributes to olaparib resistance.
A) Protein from irradiated (5 Gy, 4 hrs) Capan1-OR 1 cells was used for an immunoprecipitation (IP) against BRCA2 (Ab-1) and isotype control (Rb IgG). IPed protein was separated on a SDS-PAGE and used for mass spectrometry. Peptide count table of Capan1-OR-1 and Capan1 cells. B) Capan1 and Capan1-OR-Het cells used for IP against BRCA2 (Ab-1) and isotype control (Rb IgG). IPed protein was separated on a SDS-PAGE and immunoblotted for DOT1L and BRCA2. C) RNA extracted from Capan1 and Capan1-OR-Het was used for qPCR against DOT1L. Internal control = B2M. Two-sided t-test, ***p < 0.001. D) Protein from Capan1, Capan1-OR-Het shControl or shBRCA2 (#1 and #2) was separated on a SDS-PAGE and immunoblotted for DOT1L. Loading control = β-actin. E) Capan1-OR-Het cells were transduced with a control shRNA (shCtrl) and two DOT1L specific-shRNAs (#1 and #2). RNA was extracted from cells and used for qPCR against DOT1L. Internal control = B2M. ANOVA, ***p < 0.001. F) Total histones were extracted and immunoblotted for H3K79Me. Loading control = Histone H3 (H3). G) Capan1-OR-Het shCtrl and shDOTL1 (#1 and #2) cells were used for an olaparib dose response colony formation. IC50 were calculated and graphed. ANOVA, *p < 0.05. H) Immunofluorescence (IF) on non-irradiated (−IR) and irradiated (5 Gy, +IR) Capan1-OR-Het cells against γH2Ax (green) and RAD51 (red). White arrowheads = RAD51-foci positive cell. I) Same as I, but examined Capan1-OR-Het shDOT1L #1 and #2 cells. J) Quantification of RAD51-foci positive cells of H and I. At least 200 cells were counted in triplicate. ANOVA, ***p < 0.001. K) Capan1-OR-Het shCtrl and shDOTL1 (#1 and #2) cells incubated with olaparib [3 μM for 48 hrs] used for IF against RAD51. At least 200 cells were counted in triplicate. ANOVA, ***p < 0.001. L) Capan1-OR-Het cells treated with vehicle control (Ctrl) or 2 μM pinometostat (Pino). Histones were extracted and immunoblotted for H3K79Me. Loading control = Histone H3. M) Capan1-OR-Het shCtrl cells were treated with vehicle control or 2 μM pinometostat and cells were used for an olaparib dose response colony formation. IC50 were calculated and graphed. P-value calculated with a two-sided t-test. N) Non-irradiated (−IR) and irradiated (5 Gy, +IR) Capan1-OR-Het cells treated with pinometostat [2 μM]. IF against γH2Ax (green) and RAD51 (red). White arrowheads = RAD51-foci positive cell. O) Quantification of RAD51-foci positive cells. At least 200 cells were counted in triplicate. ANOVA, **p < 0.01. P) Capan1-OR-Het shCtrl cells were treated with vehicle control or 2 μM pinometostat followed by olaparib [3 μM for 48 hrs] used for IF against RAD51. Quantification of RAD51-foci positive cells. At least 200 cells were counted in triplicate. ANOVA, ***p < 0.001. Data is representative of 3 independent experiments. Colony formation was quantified by dissolving crystal violet. Error bars = S.E.M.

Similar articles

Cited by

References

    1. Narod SA. Modifiers of risk of hereditary breast and ovarian cancer. Nat Rev Cancer 2002;2:113–23 - PubMed
    1. Gudmundsdottir K, Ashworth A. The roles of BRCA1 and BRCA2 and associated proteins in the maintenance of genomic stability. Oncogene 2006;25:5864–74 - PubMed
    1. Ying S, Hamdy FC, Helleday T. Mre11-dependent degradation of stalled DNA replication forks is prevented by BRCA2 and PARP1. Cancer Res 2012;72:2814–21 - PubMed
    1. Bitler BG, Watson ZL, Wheeler LJ, Behbakht K. PARP inhibitors: Clinical utility and possibilities of overcoming resistance. Gynecol Oncol 2017;147:695–704 - PMC - PubMed
    1. Robson M, Im SA, Senkus E, Xu B, Domchek SM, Masuda N, et al. Olaparib for Metastatic Breast Cancer in Patients with a Germline BRCA Mutation. N Engl J Med 2017;377:523–33 - PubMed

Publication types