. 2020 Jan;19(1):258-269.
doi: 10.1158/1535-7163.MCT-19-0600. Epub 2019 Oct 1.

Targeting Histone Chaperone FACT Complex Overcomes 5-Fluorouracil Resistance in Colon Cancer

Affiliations

Targeting Histone Chaperone FACT Complex Overcomes 5-Fluorouracil Resistance in Colon Cancer

Heyu Song et al. Mol Cancer Ther. 2020 Jan.

Abstract

Fluorouracil (5-FU) remains a first-line chemotherapeutic agent for colorectal cancer. However, a subset of colorectal cancer patients who have defective mismatch-repair (dMMR) pathway show resistance to 5-FU. Here, we demonstrate that the efficacy of 5-FU in dMMR colorectal cancer cells is largely dependent on the DNA base excision repair (BER) pathway. Downregulation of APE1, a key enzyme in the BER pathway, decreases IC50 of 5-FU in dMMR colorectal cancer cells by 10-fold. Furthermore, we discover that the facilitates chromatin transcription (FACT) complex facilitates 5-FU repair in DNA via promoting the recruitment and acetylation of APE1 (AcAPE1) to damage sites in chromatin. Downregulation of FACT affects 5-FU damage repair in DNA and sensitizes dMMR colorectal cancer cells to 5-FU. Targeting the FACT complex with curaxins, a class of small molecules, significantly improves the 5-FU efficacy in dMMR colorectal cancer in vitro (∼50-fold decrease in IC50) and in vivo xenograft models. We show that primary tumor tissues of colorectal cancer patients have higher FACT and AcAPE1 levels compared with adjacent nontumor tissues. Additionally, there is a strong clinical correlation of FACT and AcAPE1 levels with colorectal cancer patients' response to chemotherapy. Together, our study demonstrates that targeting FACT with curaxins is a promising strategy to overcome 5-FU resistance in dMMR colorectal cancer patients.


Conflict of interest statement

Disclosures: The authors declare no potential conflicts of interest.

Figures

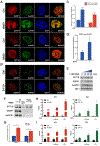
Figure 1.
Figure 1.. APE1 plays a pivotal role in inducing 5-FU resistance in dMMR-CRC cells and interacts with SSRP1 and SPT16.
A. HCT116 cells stably expressing control (ctrl) shRNA or APE1-shRNA were treated with various doses of 5-FU and viable cells were quantitated by MTT assay. APE1 levels in these cells were measured by Immunoblot analysis. B. APE1 level in HCT116 and DLD-1 was downregulated by siRNA transfection and cells were treated with 5-FU. Cell viability was measured by MTT. Immunoblot image showing the levels of APE1 after siRNAs transfection. Yellow asterisks mark the comparison between HCT116-ctrl siRNA and HCT116-APE1 siRNA. Red asterisks mark the comparison between DLD1-ctrl siRNA and DLD1-APE1 siRNA. C. Endogenous AcAPE1 in chromatin extracts was immunoprecipitated (IP) and resolved in SDS-PAGE gel followed by MALDI-TOF-TOF analysis. D & E. Co-IP followed by Western blot analysis showed the presence of SSRP1 and SPT16 in AcAPE1 IP complex from nuclear and chromatin extracts. F. Colocalization of AcAPE1 with SPT16 and SSRP1 in nuclei was visualized using confocal microscope. Bar = 50 μm. G. Schematic diagram showing the mutation (red) and deletion sites in the N-terminus of APE1. H. Cells were transfected with FLAG-tagged WT-APE1 or mutant APE1 expression plasmids and cell extracts were immunoprecipitated with FLAG antibody followed by Western blot analysis with SSRP1 and SPT16 antibodies.
Figure 2.
Figure 2.. Interaction of AcAPE1 with FACT complex enhances upon induction of DNA damages.
A & B. Colocalization of SSRP1 or SPT16 with AcAPE1 in HCT116 cells before and after treatment with MMS or 5-FU was examined by Structured-Illumination Microscopy (SIM). Representative images are shown. Bar = 5 μm. C & D. Pearson correlation coefficient was used to quantify the colocalization of AcAPE1 with SSRP1 and SPT16. * p=0.035; *** p<0.001. E. Cells were treated with 1 mM MMS for various time periods as indicated. AcAPE1, SSRP1 and SPT16 proteins levels were examined in chromatin extracts. F. AcAPE1 was immunoprecipitated after MMS treatment and immunoblotted with SSRP1 or SPT16 antibodies. G. Quantification SPT16 and SSRP1 in IP from F showing the fold change of SSRP1 and SPT16 levels before and after MMS treatment. H & I. Occupancy of AcAPE1 and SPT16 to p21 and DTL promoter regions was examined before and after treatment with MMS by ChIP analysis.
Figure 3.
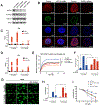
Figure 3.. FACT complex facilitates AP site and SSB repair by facilitating APE1 access and acetylation in chromatin.
A. SPT16 or SSRP1 level individually or both together (FACT) was downregulated by siRNA for 24 hours and the levels of AcAPE1 and APE1 were measured by Immunoblot analysis. Note that FACT siRNA means siRNAs of SSRP1 plus SPT16. B. AcAPE1 level was examined in SPT16 and SSRP1 downregulated cells by SIM. C & D. Occupancy of AcAPE1 to p21 and DTL promoters was examined before and after treatment with MMS by ChIP analysis. Yellow asterisks mark the comparisons between ctrl siRNA and FACT siRNA without MMS treatment. Red asterisks mark the comparisons between ctrl siRNA and FACT siRNA at the presence of MMS. E. GFP-tagged APE1 expression plasmid was transfected in control or FACT downregulated cells and specific regions were bleached with laser and the recovery of GFP fluorescence was examined. F. Control and FACT downregulated cells were treated with MMS and then release for 6 hours. The number of AP sites in the genomic DNA was quantitated using aldehyde reactive probe. G. Control and FACT downregulated cells were treated with MMS and release for 6 hours. DNA damage was examined by single cell alkaline comet assay H. Average tail moment before and after MMS treatment was shown. I. Cell viability were examined after FACT KD in HCT116 and RKO cells. *** p<0.001, **** p<0.0001 (t test).
Figure 4.
Figure 4.. FACT inhibitor Curaxin inhibits efficient repair of 5-FU induced DNA damages and sensitizes dMMR CRC cells to 5-FU in vitro.
A - C. HCT116 cells were treated with indicated doses of QC or CBL0137 for 1 hour and whole cell extract (WCE), soluble nuclear and chromatin-bound fractions were prepared. SSRP1 and SPT16 levels in theses extracts were examined by immunoblot analysis. D. Cells were treated with indicated doses of CBL0137 for 1 hour and the AcAPE1 level in cells was examined by SIM. E. HCT116 cells, pretreated with or without CBL0137 for 1 hour, were exposed to 5-FU for 6 hours and then allow to recover for 26 hours. DNA damage was examined by alkaline comet assay. F. Average tail moment before and after 5-FU treatment was shown. G & H. HCT116 and RKO were treated with and without QC or CBL0137 for 1 hour then exposed to various doses of 5-FU. Cell viability was measure by MTT assay. Yellow asterisks mark the comparisons between HCT116 and HCT116/CBL0137 (G) or HCT116 and HCT116/QC (H). Red asterisks mark the comparisons between RKO and RKO/CBL0137 (G) or RKO and RKO/QC (H).
Figure 5.
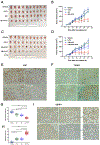
Figure 5.. FACT inhibitor Curaxin sensitizes dMMR-CRC tumor growth in vivo.
A & C. Vehicle, 5-FU, QC and combination of 5-FU and QC were administered to mice intraperitoneally for 3 weeks (A). In a separate experiment, 5-FU, CBL0137 and combination of 5-FU and CBL0137 were used (C). Resected xenograft tumor after completion of treatment were shown. B & D. Tumor volume was measured at indicated days and tumor growth curve was plotted. E. Paraformaldehyde-fixed xenograft tumor section from each treatment groups were stained for Ki67 to examine cell proliferation. F. TUNEL assay was performed in tumor sections and the representative images are shown. G&H. Box chart depicting the Ki67 or TUNEL positive cell percentage among groups. Data report the median, 25th and 75th percentiles of percentages of positive cells. I. Tumor sections from each treatment groups were stained with SSRP1 antibody. Zoomed images of portions of the IHC staining indicate the chromatin trapping of FACT due to QC treatment.
Figure 6.
Figure 6.. AcAPE1 and SSRP1 levels are elevated in human CRC samples and CRC cell lines.
A. Levels of APE1, AcAPE1, SSRP1 and SPT16 in paired adjacent normal (N) and tumor (T) tissue extracts of CRC patients. B. The expression level of each protein in tumor was presented in fold change compared to normal adjacent tissues. Data were expressed as mean ± SEM of three independent experiments. C. The levels of AcAPE1, SSRP1, and SPT16 were analyzed in various colon cancer cell lines as compared to normal colon cell line HCEC. D. Bar graph showing elevated levels of SPT16, SSRP1 and AcAPE1 in multiple CRC cell lines compared to normal HCEC cells. Expression levels were presented in fold change with respect to normal HCEC cells. E. IHC staining of AcAPE1 and SSRP1 from a total of 39 CRC patients with different T stages were performed. Representative images are shown. F & G. The percentage of cells positive for AcAPE1 or SSRP1 from ten random high field in each sample was pooled. H & I. The percentage of cells with low, medium and high staining intensity in each group was analyzed and plotted.
Figure 7.
Figure 7.. Elevated level of AcAPE1 or SSRP1 in CRC patients is associated with poor treatment response to chemotherapy.
A. The expression of AcAPE1 and SSRP1 was analyzed using linear regression. B. Representative images of AcAPE1 and SSRP1 staining in patients with moderate and minimal/none response to chemotherapy are shown. C & D. The percentages of cells with positive AcAPE1 and SSRP1 staining were compared between moderate and minimal/none response groups.

Similar articles

Cited by

References

    1. Andre T, Boni C, Mounedji-Boudiaf L, Navarro M, Tabernero J, Hickish T, et al. Oxaliplatin, fluorouracil, and leucovorin as adjuvant treatment for colon cancer. N Engl J Med 2004;350(23):2343–51 doi 10.1056/NEJMoa032709. - DOI - PubMed
    1. Ribic CM, Sargent DJ, Moore MJ, Thibodeau SN, French AJ, Goldberg RM, et al. Tumor microsatellite-instability status as a predictor of benefit from fluorouracil-based adjuvant chemotherapy for colon cancer. N Engl J Med 2003;349(3):247–57 doi 10.1056/NEJMoa022289. - DOI - PMC - PubMed
    1. Carethers JM, Smith EJ, Behling CA, Nguyen L, Tajima A, Doctolero RT, et al. Use of 5-fluorouracil and survival in patients with microsatellite-unstable colorectal cancer. Gastroenterology 2004;126(2):394–401. - PubMed
    1. Sinicrope FA, Mahoney MR, Smyrk TC, Thibodeau SN, Warren RS, Bertagnolli MM, et al. Prognostic impact of deficient DNA mismatch repair in patients with stage III colon cancer from a randomized trial of FOLFOX-based adjuvant chemotherapy. J Clin Oncol 2013;31(29):3664–72 doi 10.1200/JCO.2013.48.9591. - DOI - PMC - PubMed
    1. Bracht K, Nicholls AM, Liu Y, Bodmer WF. 5-Fluorouracil response in a large panel of colorectal cancer cell lines is associated with mismatch repair deficiency. Br J Cancer 2010;103(3):340–6 doi 10.1038/sj.bjc.6605780. - DOI - PMC - PubMed

Publication types

MeSH terms