. 2020 Jan;19(1):112-122.
doi: 10.1158/1535-7163.MCT-19-0233. Epub 2019 Oct 1.

Molecular Inhibitor of QSOX1 Suppresses Tumor Growth In Vivo

Affiliations

Molecular Inhibitor of QSOX1 Suppresses Tumor Growth In Vivo

Amber L Fifield et al. Mol Cancer Ther. 2020 Jan.

Abstract

Quiescin sulfhydryl oxidase 1 (QSOX1) is an enzyme overexpressed by many different tumor types. QSOX1 catalyzes the formation of disulfide bonds in proteins. Because short hairpin knockdowns (KD) of QSOX1 have been shown to suppress tumor growth and invasion in vitro and in vivo, we hypothesized that chemical compounds inhibiting QSOX1 enzymatic activity would also suppress tumor growth, invasion, and metastasis. High throughput screening using a QSOX1-based enzymatic assay revealed multiple potential QSOX1 inhibitors. One of the inhibitors, known as "SBI-183," suppresses tumor cell growth in a Matrigel-based spheroid assay and inhibits invasion in a modified Boyden chamber, but does not affect viability of nonmalignant cells. Oral administration of SBI-183 inhibits tumor growth in 2 independent human xenograft mouse models of renal cell carcinoma. We conclude that SBI-183 warrants further exploration as a useful tool for understanding QSOX1 biology and as a potential novel anticancer agent in tumors that overexpress QSOX1.


Conflict of interest statement

Conflict of Interest: The authors declare no conflict of interest.

Figures

Figure 1.
Figure 1.
SBI-183 binds to and inhibits the enzymatic activity of QSOX1. A) Data were recorded in triplicate at time = 15 minutes (steady state) after addition of DTT substrate. Error represents SEM. Significance was determined by two-way ANOVA and *p<.05, ****p<.0001. B) MST titrations of rQSOX1 with SBI-183. Red and blue data sets represent two independent titrations of 50 nM Dylight650-labeled QSOX1 with increasing amounts of SBI-183 (.0076 to 250 μM). Fitting the data yielded Kd= 20 ± 7 μM. C) QSOX1 is shown with predicted binding Sites 1 and 2 indicated by arrows. The boxed gray area for Site 1 is where SBI-183 was shown to bind and is zoomed into for panel D. Atom colors are by atom type (C-gray, N-blue, O-red, S-yellow, H-white) and ribbons are colored by secondary structure (red-helix, cyan-sheet, gray-random coil/loop). D) SBI-183 docked with QSOX1 is given. Key interacting residues within 6Å cutoff are labeled and shown in licorice stick rendering. Dashed lines indicating hydrogen bonds, pi-cloud interactions, or electrostatics are shown.
Figure 2.
Figure 2.
SBI-183 inhibits proliferation of tumor cells, but does not kill fibroblasts or rapidly proliferating PBMC. Inhibition of proliferation of A) 786-O, B) RCJ-41T2, C) MDA-MB-231, D) A549, and E) MIA PaCa2 with SBI-183 exhibits a dose response. This phenotype is similar to that seen in the QSOX1 stable KD cell line F) 786-O sh742.E11. Significance was determined by two-way ANOVA. No significant toxicity was observed when fibroblasts (G) or PHA-stimulated PBMC (H) were incubated with SBI-183 for 5 days. Significance was determined by one-way ANOVA, Kruskal-Wallis Test. Experiments were performed in triplicate and error represents SEM. Cells incubated with DMSO vehicle alone were used to calculate % growth with the following equation: ((Cells + SBI-183)/(Cells + .4% DMSO))x100. % growth of QSOX1 sh742 KD was calculated against shScr. and *p<.05, **p<.01, ***p<.001, ****p<.0001.
Figure 3.
Figure 3.
3D & 2D Invasion. Inhibition of invasion in 3D of (i) 786-O, (ii) RCJ-41T2, (iii) MDA-MB-231, (iv) A549, and (v) MIA PaCa2 exhibits a dose response relationship. This phenotype is similar to that seen in the QSOX1 stable KD cell line (vi) 786-O sh742.E11. Representative images of 3D invasion on day 0 (C, F, I, L, O) and day 4 or day 6 (cell line dependent) with no compound (.4% DMSO vehicle only) (A, D, G, J, M), or 20 μM SBI-183 (B, E, H, K, N). Images of 786-O cells transduced with GFP-expressing shRNA scramble (shScr) and QSOX1 KD (sh742.E11) on day 0 (P, R) or day 6 (Q, S). Data are representative of three experiments performed in triplicate. Scale bar = 300 μm. 786-O sh742.E11 forms smaller spheroids than 786-O shScr. To account for this 786-O shScr spheroids at all time points were normalized against 786-O sh742.E11 as follows: (Calculated Area shScr) - (Average Area Day 0 shScr – Average Area Day 0 sh742.E11). Invasion of all cell lines through a matrigel coated membrane (2D) was significantly inhibited (vii, viii, ix, x, xi and T, U, V, W, X, Y, Z, Ai, Aii, Aiii) Experiments were performed in triplicate. Error represents SEM. Significance was determined by two-way ANOVA and *p<.05, **p<.01, ***p<.001, ****p<.0001.
Figure 4.
Figure 4.
Partial rescue of invasive phenotype by addition of exogenous rQSOX1. Addition of 5 μM rQSOX1 increased invasion of 786-O (A) by 10% by day 6. By day 4, 5 μM rQSOX1 increased invasion of RCJ-41T2 (B) by 17% and increased invasion of MDA-MB-231 (C) by 20%. Experiment was performed in triplicate. Error represents SEM. Significance was determined by two-way ANOVA and **p<.01, ***p<.001, ****p<.0001.
Figure 5.
Figure 5.
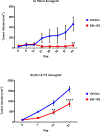
Treatment with SBI-183 suppresses 786-O and RCJ-41T2 growth in mice. A) 786-O cells were subcutaneously injected into 4 nude mice per group and tumors were established before initiation of daily oral gavage of 400 μg/mouse/day SBI-183 or DMSO vehicle. Percentage of decrease was calculated with the following formula: 100-((Average SBI-183)/(Average Vehicle))x100. B) Daily treatment with SBI-183 suppresses RCJ-41T2 growth in NSG mice. Data are from 9 control mice and 6 experimental mice. Percentage decrease was calculated as above. Error bars represent SEM. Significance was determined by two-way ANOVA and **p<.01, ****p<.0001.
Figure 6.
Figure 6.
Treatment with SBI-183 reduced laminin-α4 deposition in RCJ-41T2 mouse xenografts. DAB staining intensity (Log OD) due to laminin-α4 deposition was .115 ± .022 for vehicle treated mice and .088 ± .008 for SBI-183 treated mice (p=.0101). Optical density (OD) was estimated from three unique images from each of two tumors per group with the following formula: OD = Log(max intensity/mean intensity), where max intensity = 255 [46]. Error represents SEM and was calculated in Microsoft Excel. Scale bar = 50 μm. Significance was determined using Welch’s t-test.

References

    1. Venning FA, Wullkopf L, and Erler JT, “Targeting ECM Disrupts Cancer Progression,” Front. Oncol, vol. 5, p. 224, Oct. 2015. - PMC - PubMed
    1. T. E Gilles C, Newgreen DF, Sato H, “Matrix Metalloproteases and Epithelial-to-Mesenchymal Transition: Implications for Carcinoma Metastasis,” in Madame Curie Bioscience Database [Internet]., Austin (TX): Landes Bioscience.
    1. Lamouille S, Xu J, and Derynck R, “Molecular mechanisms of epithelial-mesenchymal transition,” Nat. Rev. Mol. Cell Biol, vol. 15, no. 3, pp. 178–196, Mar. 2014. - PMC - PubMed
    1. Kalluri R and Weinberg RA, “The basics of epithelial-mesenchymal transition,” J. Clin. Invest, vol. 119, no. 6, pp. 1420–1428, Jun. 2009. - PMC - PubMed
    1. Ho TH et al., “Differential gene expression profiling of matched primary renal cell carcinoma and metastases reveals upregulation of extracellular matrix genes,” Ann. Oncol. Off. J. Eur. Soc. Med. Oncol, vol. 28, no. 3, pp. 604–610, Mar. 2017. - PMC - PubMed

Publication types

Substances