. 2019 Oct 1;10(5):e02244-19.
doi: 10.1128/mBio.02244-19.

Increased Epithelial Oxygenation Links Colitis to an Expansion of Tumorigenic Bacteria

Affiliations

Increased Epithelial Oxygenation Links Colitis to an Expansion of Tumorigenic Bacteria

Stephanie A Cevallos et al. mBio. .

Abstract

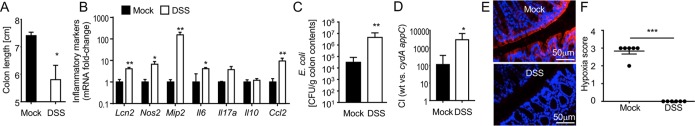
Intestinal inflammation is a risk factor for colorectal cancer formation, but the underlying mechanisms remain unknown. Here, we investigated whether colitis alters the colonic microbiota to enhance its cancer-inducing activity. Colitis increased epithelial oxygenation in the colon of mice and drove an expansion of Escherichia coli within the gut-associated microbial community through aerobic respiration. An aerobic expansion of colibactin-producing E. coli was required for the cancer-inducing activity of this pathobiont in a mouse model of colitis-associated colorectal cancer formation. We conclude that increased epithelial oxygenation in the colon is associated with an expansion of a prooncogenic driver species, thereby increasing the cancer-inducing activity of the microbiota.IMPORTANCE One of the environmental factors important for colorectal cancer formation is the gut microbiota, but the habitat filters that control its cancer-inducing activity remain unknown. Here, we show that chemically induced colitis elevates epithelial oxygenation in the colon, thereby driving an expansion of colibactin-producing Escherichia coli, a prooncogenic driver species. These data suggest that elevated epithelial oxygenation is a potential risk factor for colorectal cancer formation because the consequent changes in the gut habitat escalate the cancer-inducing activity of the microbiota.

Keywords: Escherichia coli; colibactin; colorectal cancer; microbiome.


Figures

FIG 1
FIG 1
DSS-induced colitis increases epithelial oxygenation. Mice receiving 3% dextran sulfate sodium (DSS) in their drinking water were inoculated with commensal E. coli indicator strains (i.e., with a 1:1 mixture of E. coli Nissle 1917 wild type and an isogenic cydA appC mutant) 2 days after the beginning of DSS treatment. Organs were collected 4 days after the beginning of DSS treatment. (A) Colon length was determined at necropsy. (B) Transcript levels of the indicated inflammatory genes were determined in RNA isolated from the colonic epithelium using quantitative real-time PCR. (C) Numbers of E. coli bacteria recovered from colon contents. (D) The fitness advantage conferred by aerobic respiration was assessed by determining the competitive index (CI) of E. coli wild type (wt) and a cydA appC mutant recovered from colon contents. (E and F) Binding of pimonidazole was detected using Hypoxyprobe-1 primary antibody and a Cy3-conjugated goat anti-mouse secondary antibody (red fluorescence) in sections of the colon that were counterstained with DAPI nuclear stain (blue fluorescence). representative images are shown (E). Blinded sections of the colon were scored for intensity of hypoxia staining. Each dot represents data from one animal (F). For data in panels A to D, bars represent geometric means ± standard errors. *, P < 0.05; **, P < 0.01; ***, P < 0.001.
FIG 2
FIG 2
A DSS-induced increase in epithelial oxygenation promotes aerobic growth of E. coli. Mice received TUDCA daily by oral gavage. One day after the first TUDCA treatment, mice received drinking water containing 3% DSS. Two days after the beginning of DSS treatment, mice were inoculated with commensal E. coli indicator strains (i.e., with a 1:1 mixture of E. coli Nissle 1917 wild type and an isogenic cydA appA mutant). Organs were collected 4 or 8 days after the beginning of DSS treatment. (A) Transcript levels of the indicated UPR markers were determined in RNA isolated from the colonic epithelium using quantitative real-time PCR. (B) Colon length was determined at necropsy. (C and D) Histopathological scoring of blinded colonic sections was performed by a veterinary pathologist. The histopathological score for each animal (bar) is shown. Representative images of H&E-stained colonic sections are shown. (E) The fitness advantage conferred by aerobic respiration was assessed by determining the competitive index (CI) of E. coli wild type and a cydA appA mutant recovered from colon contents. For data in panels A, B, and E, bars represent geometric means ± standard errors. *, P < 0.05; **, P < 0.01; ***, P < 0.001; ****, P < 0.0001; ns, not statistically significantly different.
FIG 3
FIG 3
Short-term AOM/DSS treatment increases epithelial oxygenation. (A to G) Mice were treated with AOM, and 1 day later mice received 3% DSS in their drinking water for 1 week. Organs were collected 1 day after the end of DSS treatment. Transcript levels of the indicated UPR markers were determined in RNA isolated from the colonic epithelium using quantitative real-time PCR (A). (B and C) Binding of pimonidazole was detected using Hypoxyprobe-1 primary antibody and a Cy3-conjugated goat anti-mouse secondary antibody (red fluorescence) in sections of the colon that were counter stained with DAPI nuclear stain (blue fluorescence). Representative images are shown. Blinded sections of the colon were scored for intensity of hypoxia staining. Each dot represents data from one animal. (D and E) Crypt length was measured in H&E-stained histological sections from the colon. Representative images and a quantification of the average crypt lengths are shown. (F) Transcript levels of the indicated epithelial maturation markers were determined in RNA isolated from the colonic epithelium using quantitative real-time PCR. (G and H) Goblet cells were visualized histologically by alcian blue (mucin stain) staining, which is specific for sulfated and carboxylated acid mucopolysaccharides and sulfated and carboxylated sialomucins. Representative images and a quantification of the number of goblet cells are shown. (I and J) Mice were mock treated or treated with AOM and 1 day later inoculated with colibactin-producing E. coli strain SP15 (WT) or with a colibactin-deficient mutant (clbA strain). One day after inoculation with E. coli, AOM-treated mice received 3% DSS in their drinking water for 1 week. Organs were collected 1 day after the end of DSS treatment. Numbers of E. coli recovered from colon contents are indicated. (J) Colon length was determined at necropsy. *, P < 0.05; **, P < 0.01; ***, P < 0.001; ****, P < 0.0001.
FIG 4
FIG 4
Expansion by aerobic respiration is required for the cancer-inducing activity of colibactin-producing E. coli. Mice were mock treated or treated with AOM and 1 day later inoculated with colibactin-producing E. coli strain SP15 (WT), with a colibactin-deficient mutant (clbA strain), with a cytochrome bd oxidase-deficient mutant (cydA strain), or with a mutant deficient for aerobic respiration under microaerophilic conditions (cydA appC strain). (A) Mice received courses of 3% DSS for 7 days starting at the indicated time intervals. (B) The number of polyps detected at necropsy by gross pathological inspection was recorded. The boxes in the whisker plot represent the first to third quartiles, and the mean value of the gross pathology scores is indicated by a line. Bars in the whisker plot represent the minimum and maximum data points within each treatment group. (C and D) The histopathology score was determined by a veterinary pathologist by scoring of blinded H&E-stained Swiss rolls of the colon. (C) Representative images of sections are shown. (D) The boxes in the whisker plot represent the first to third quartiles, and the mean value of the gross pathology scores is indicated by a line. Bars in the whisker pot represent the minimum and maximum data points within each treatment group. (E) E. coli numbers were determined in the colon contents collected during necropsy. Bars represent geometric means. Each dot represents data from one animal. *, P < 0.05; **, P < 0.01; ***, P < 0.001; ns, not statistically significantly different.

References

    1. Rustgi AK. 2007. The genetics of hereditary colon cancer. Genes Dev 21:2525–2538. doi:10.1101/gad.1593107. - DOI - PubMed
    1. Sears CL, Garrett WS. 2014. Microbes, microbiota, and colon cancer. Cell Host Microbe 15:317–328. doi:10.1016/j.chom.2014.02.007. - DOI - PMC - PubMed
    1. Arthur JC, Perez-Chanona E, Muhlbauer M, Tomkovich S, Uronis JM, Fan TJ, Campbell BJ, Abujamel T, Dogan B, Rogers AB, Rhodes JM, Stintzi A, Simpson KW, Hansen JJ, Keku TO, Fodor AA, Jobin C. 2012. Intestinal inflammation targets cancer-inducing activity of the microbiota. Science 338:120–123. doi:10.1126/science.1224820. - DOI - PMC - PubMed
    1. Dejea CM, Fathi P, Craig JM, Boleij A, Taddese R, Geis AL, Wu X, DeStefano Shields CE, Hechenbleikner EM, Huso DL, Anders RA, Giardiello FM, Wick EC, Wang H, Wu S, Pardoll DM, Housseau F, Sears CL. 2018. Patients with familial adenomatous polyposis harbor colonic biofilms containing tumorigenic bacteria. Science 359:592–597. doi:10.1126/science.aah3648. - DOI - PMC - PubMed
    1. Ullman TA, Itzkowitz SH. 2011. Intestinal inflammation and cancer. Gastroenterology 140:1807–1816. doi:10.1053/j.gastro.2011.01.057. - DOI - PubMed

Publication types