. 2019 Oct 1;10(1):4460.
doi: 10.1038/s41467-019-12411-2.

Glycan-mediated enhancement of reovirus receptor binding

Affiliations

Glycan-mediated enhancement of reovirus receptor binding

Melanie Koehler et al. Nat Commun. .

Abstract

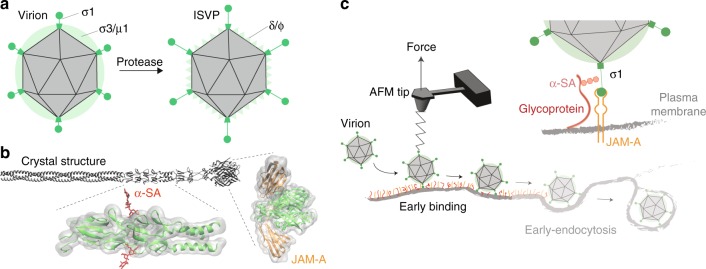
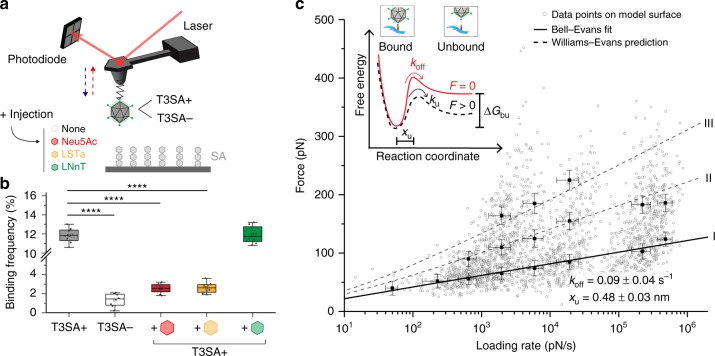
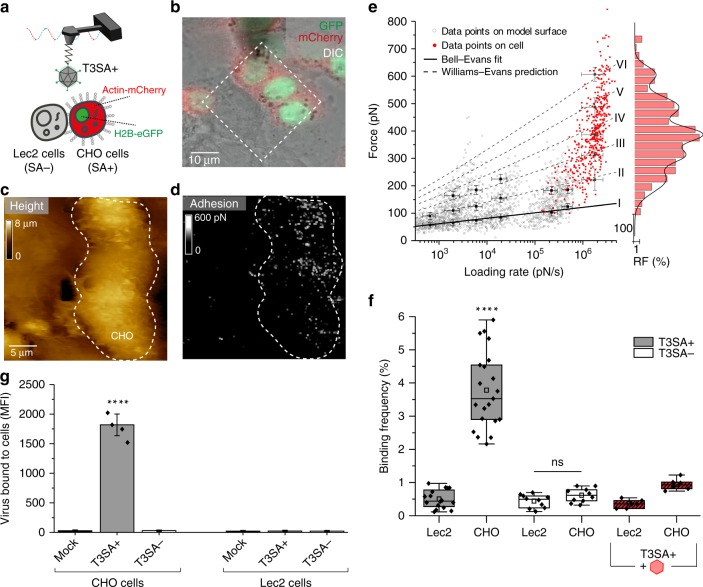
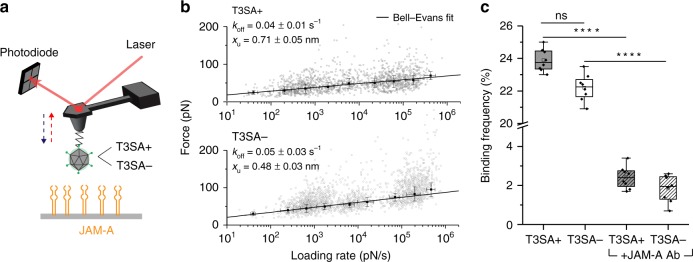
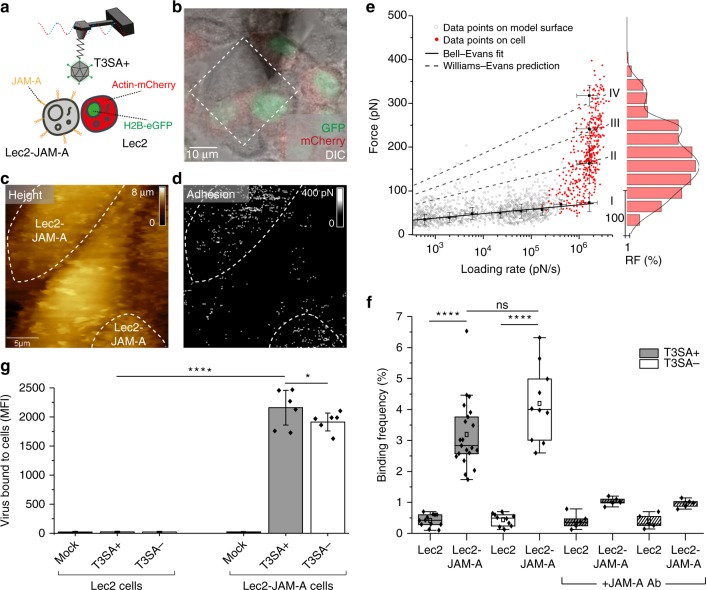
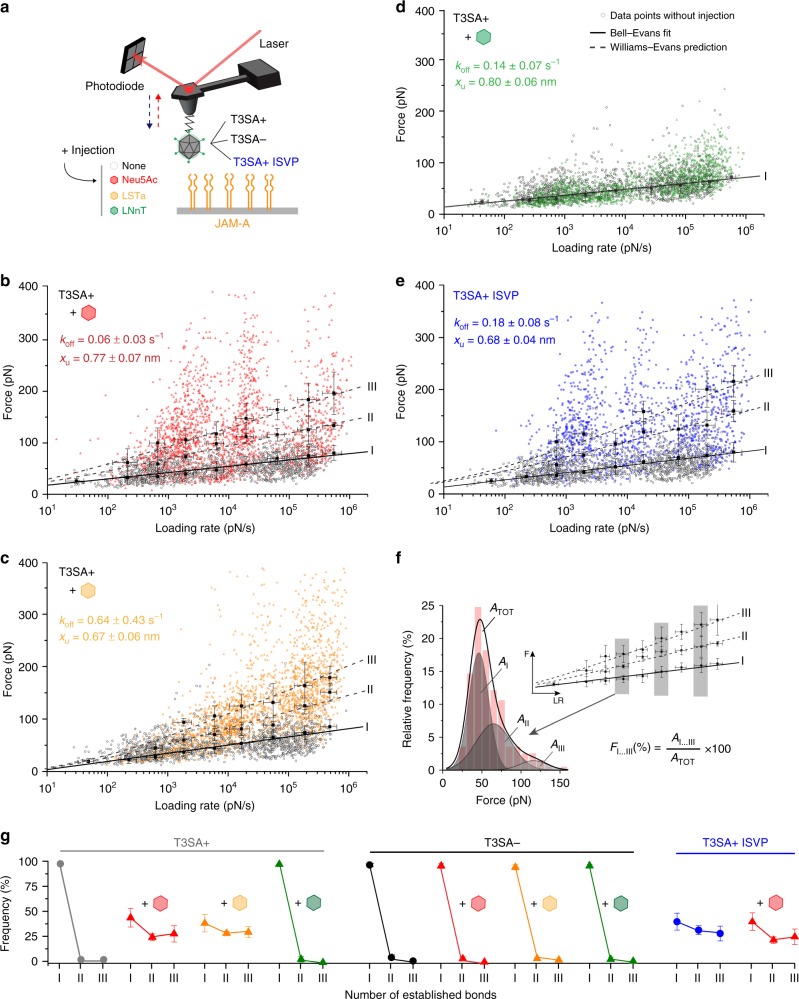
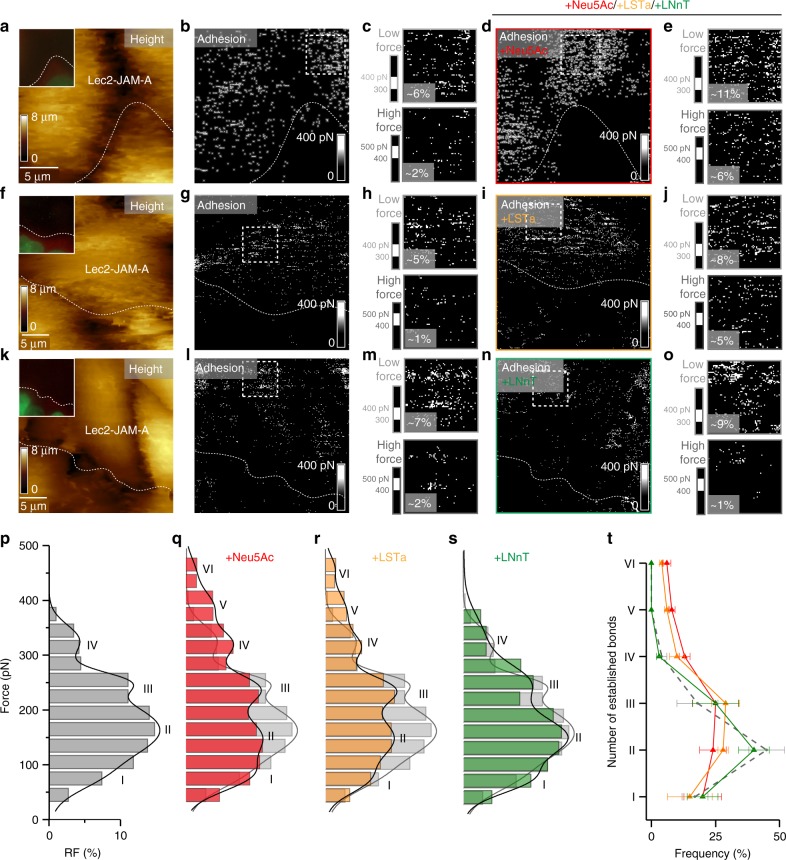
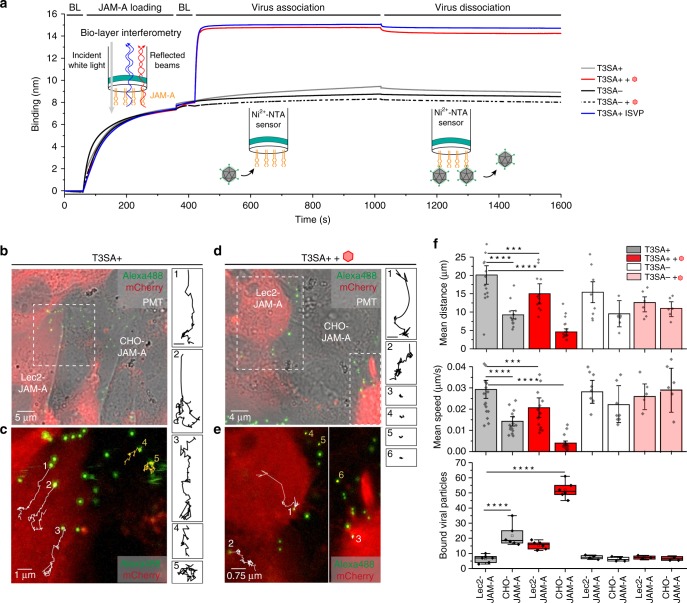
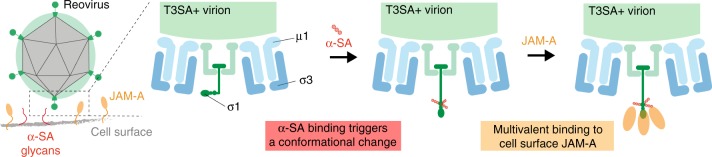
Viral infection is an intricate process that requires the concerted action of both viral and host cell components. Entry of viruses into cells is initiated by interactions between viral proteins and their cell surface receptors. Despite recent progress, the molecular mechanisms underlying the multistep reovirus entry process are poorly understood. Using atomic force microscopy, we investigated how the reovirus σ1 attachment protein binds to both α-linked sialic acid (α-SA) and JAM-A cell-surface receptors. We discovered that initial σ1 binding to α-SA favors a strong multivalent anchorage to JAM-A. The enhanced JAM-A binding by virions following α-SA engagement is comparable to JAM-A binding by infectious subvirion particles (ISVPs) in the absence of α-SA. Since ISVPs have an extended σ1 conformer, this finding suggests that α-SA binding triggers a conformational change in σ1. These results provide new insights into the function of viral attachment proteins in the initiation of infection and open new avenues for the use of reoviruses as oncolytic agents.


Conflict of interest statement

M.K. and D.A. have applied for a patent for the use of sialylated glycans in combination with reoviruses (EP19152640.9). The remaining authors declare no competing interests.

Figures

Fig. 1
Fig. 1
Probing reovirus binding to living cells. a Schematic of reovirus particles with outer-capsid proteins labeled before (virion) and after (infectious subvirion particle [ISVP]) proteolytic processing. The cartoon shows the arrangement of outer-capsid proteins in the double-layered shell of virions, the formation of ISVPs by removal of σ3 and cleavage of µ1 to yield δ and ϕ, and rearrangement of σ1 into a more elongated conformation. b Full-length model of reovirus σ1 protein, which functions as the viral attachment protein that binds to cell-surface glycans (in particular, to terminal α-linked sialic acid [α-SA] residues) and junctional adhesion molecule-A (JAM-A). Regions of the molecule that interact with α-SA and JAM-A are indicated. c Schematic of probing reovirus entry using AFM. The initial attachment of reovirus to cells involves specific binding between the viral σ1 protein and the receptor, JAM-A. Cell-surface glycans serve as attachment factors, and virus binding to their α-SA groups function in the initial association of virus to cells and further facilitates high-affinity binding to JAM-A
Fig. 2
Fig. 2
Probing T3 reovirus binding to sialylated glycans on model surfaces. a Binding of single virions is probed on an SA-coated surface in the presence or absence of α-SA glycan derivatives: N-acetylneuraminic acid (Neu5Ac), sialyl-lacto-N-tetraose a (LSTa), and a derivative without α-SA (lacto-N-neotetraose [LNnT]). b Box plot of specific binding frequencies measured by AFM between virions and α-SA before and after injection of 1 mM glycans. The horizontal line within the box indicates the median, boundaries of the box indicate the 25th and 75th percentile, and the whiskers indicate the highest and lowest values of the results. The square in the box indicates the mean. c Dynamic force spectroscopy (DFS) plot showing the distribution of rupture forces measured between T3SA+ and the SA-coated surface (gray dots) with average rupture forces determined for eight distinct loading rate (LR) ranges. Data corresponding to single interactions are fitted with the Bell-Evans (BE) model describing a ligand-receptor bond as a simple two-state model (I, black curve). Dashed lines represent the predicted binding forces for two (II) and three (III) simultaneous uncorrelated interactions (Williams-Evans model [WEM]). Inset: BE model describing a ligand-receptor bond as a simple two-state model. The bound state is separated from the unbound state by an energy barrier located at distance xu. ku and koff represent the transition rate and transition at thermal equilibrium, respectively. Error bars indicate s.d. of the mean value. For all experiments, data are representative of n = 5 independent experiments. ****P< 0.0001; determined by two-sample t-test in Origin. Source data are provided as a Source Data file
Fig. 3
Fig. 3
Probing T3 reovirus binding to sialylated glycans on living cells. a Combined optical microscopy and FD-based AFM of T3SA+ binding to cells expressing (CHO) or lacking (Lec2) α-SA on the cell surface. b Overlay of DIC, eGFP, and mCherry signals of a confluent layer of co-cultured fluorescent CHO cells (actin-mCherry and H2B-eGFP) and Lec2 cells. c, d FD-based AFM topography image (c) and corresponding adhesion map (d) from probing of adjacent cells indicated in the dashed square in b. The adhesion map shows interactions mainly on CHO cells (α-SA-expressing cells) (white pixels). For higher visibility, the pixel size in the adhesion image was enlarged two-fold. e DFS plot of data from α-SA model surfaces (grey circles, from Fig. 2c) and living cells (red dots). Histogram of the force distribution observed on cells fitted with a multi-peak Gaussian distribution (n = 700 data points) is shown at the side. f Box plot of BF observed for T3SA+ (gray) and T3SA− (white) virions as well as T3SA+ virions following injection of 1 mM Neu5Ac (red). The horizontal line within the box indicates the median, boundaries of the box indicate the 25th and 75th percentile, and the whiskers indicate the highest and lowest values of the results. The square in the box indicates the mean. For all experiments, data are representative of at least n = 5 independent experiments. g Influence of SA on virus binding determined by flow cytometry. Cells were incubated with either PBS (Mock) or Alexa Flour 488-labeled T3SA+ or T3SA− virions (105 particles per cell), and the median fluorescence intensity (MFI) of cell-bound virus was determined by flow cytometry as shown in Supplementary Fig. 3a. Error bars indicate s.d. of the mean value. Experiments were repeated twice (n = 2 independent experiments, each with duplicate samples). ns, P> 0.05; ****P< 0.0001; determined by two-sample t-test in Origin (f) and by two-way ANOVA corrected for multiple comparisons using Tukey’s test in GraphPad Prism (g), respectively. Source data are provided as a Source Data file
Fig. 4
Fig. 4
Probing reovirus binding to JAM-A on model surfaces. a Binding of single virions (T3SA+ or T3SA−) to JAM-A probed on a model surface. b DFS plot showing the force required to separate T3SA+ (upper panel) or T3SA− (lower panel) virions from JAM-A and fitted with the BE model. Error bars indicate s.d. of the mean value. For all experiments, data are representative of at least n = 5 independent experiments. c Box plot of the binding frequency of reovirus to JAM-A model surface. T3SA+ interactions are shown in grey, T3SA− in white, and hatched boxes represent injection of 10 µg/mL JAM-A antibody (Ab). The horizontal line within the box indicates the median, boundaries of the box indicate the 25th and 75th percentile, and the whiskers indicate the highest and lowest values of the results. The square in the box indicates the mean. ns, P> 0.05; ****P < 0.0001; determined by two-sample t-test in Origin. Source data are provided as a Source Data file
Fig. 5
Fig. 5
Probing reovirus binding to JAM-A on living cells. a Combined optical microscopy and FD-based AFM of T3SA+ interaction with JAM-A on living Lec2 cells. b Overlay of DIC, eGFP, and mCherry signals of a confluent layer of co-cultured fluorescent Lec2 cells (actin-mCherry and H2B-eGFP) and unlabeled Lec2-JAM-A cells. c, d FD-based AFM topography image (c) and corresponding adhesion map (d) of adjacent cells indicated in the dashed square in b. The adhesion map shows interactions mainly between T3SA+ particles and Lec2-JAM-A cells (white pixels). For higher visibility, the pixel size in the adhesion image was enlarged two-fold. e DFS plot of T3SA+ interactions with JAM-A on model surfaces (grey circles, taken from Fig. 4b—upper panel) and living cells (red dots). Histogram of the force distribution observed on cells fitted with a multi-peak Gaussian distribution (n = 600 data points) is shown on the side. f Box plot of BF observed for T3SA+ (grey) and T3SA− (white) virions, with (hatched lines) and without injection of JAM-A Ab (10 µg/ml). The horizontal line within the box indicates the median, boundaries of the box indicate the 25th and 75th percentile, and the whiskers indicate the highest and lowest values of the results. The square in the box indicates the mean. For all experiments, data are representative of at least n = 5 independent experiments. g Influence of JAM-A on virus binding determined using flow cytometry. Cells were incubated with either no virions (Mock) or Alexa Flour 488-labeled T3SA+ or T3SA− virions (105 particles per cell), and the median fluorescence intensity (MFI) of cell-bound virus was determined by flow cytometry as shown in Supplementary Fig. 3a. Error bars indicate s.d. of the mean value. Experiments were repeated twice (n = 2 independent experiments, each with duplicate samples). ns, P> 0.05; *P < 0.05; ****P < 0.0001; determined by two-sample t-test in Origin (f) and by two-way ANOVA corrected for multiple comparisons using Tukey’s test in GraphPad Prism (g), respectively. Source data are provided as a Source Data file
Fig. 6
Fig. 6
Influence of sialylated glycans on reovirus binding to JAM-A. a Binding of T3SA+ or T3SA− virions, or T3SA+ ISVPs to JAM-A was monitored following injection of 1 mM α-SA glycans (Neu5Ac [b, red] and LSTa [c, yellow]) or non-sialylated glycan (LNnT [d, green]). bd DFS plots of interaction forces measured between T3SA+ and JAM-A after adding 1 mM glycan (Neu5Ac in b, LSTa in c, and LNnT in d). Grey dots represent the measured binding forces before injection. e DFS plot of the interaction forces between JAM-A and T3SA+ ISVPs, which display a more extended conformation of the σ1 protein. Multivalent interactions are observed for T3SA+ ISVPs (blue) in comparison to T3SA+ virions (gray) without injection of free SA. f Example for analysis of the number of established bonds shown in panel g. Relative frequency of single and multiple bonds before and after adding free glycans was determined from areas under respective peaks (AI, AII, AIII; grey shaded) within force distribution histograms (red bars with cumulative peak, ATOT). g Number of bonds established between JAM-A and T3SA+ (left panel) or T3SA− (middle panel) virions or T3SA+ ISVPs (right panel), before and after injection of sialylated (Neu5Ac—red, LSTa—yellow) or non-sialylated (LNnT—green) glycans. Error bars indicate s.d. of the mean value. For all experiments, data are representative of at least n = 3 independent experiments. Source data are provided as a Source Data file
Fig. 7
Fig. 7
Monitoring the effect of SA addition on reovirus binding to living cells. T3SA+ binding to Lec2-JAM-A cells was assessed before and after adding 1 mM Neu5Ac (ae), 1 mM LSTa (fj), or 1 mM LNnT (ko). a, f, k AFM topography image of adjacent Lec2 and Lec2-JAM-A cells with fluorescent image (20 × 20 µm) inset showing fluorescently-tagged Lec2 cell lacking JAM-A expression. b, g, l Corresponding adhesion map recorded before injection of glycan. c, h, m Enlarged images of adhesion maps recorded on Lec2-JAM-A cells (dashed square in adhesion map). The upper images display the lower force range (300 to 400 pN), whereas the lower images display the higher force range (400 to 500 pN), with significantly fewer adhesion events. d, i, n Adhesion maps recorded following injection of free Neu5Ac (d), LSTa (i), or LNnT (n). The area probed is similar to the area recorded before glycan injection. e, j, o Enlarged images of adhesion maps recorded on Lec2-JAM-A cells (dashed square in adhesion map and similar areas as in b, g, i show more adhesion events in the high-force range upon injection of sialylated glycan [Neu5a and LSTa] and no significant change for non-sialylated glycan [LNnT]). The frequency of adhesion events is indicated. (ps) Histogram of the force distribution extracted on Lec2-JAM-A cells (dashed square in adhesion map) before (p) and after adding Neu5Ac (q), LSTa (r), and LNnT (s) (n > 700 for each condition). Histograms were fitted with a multi-peak Gaussian distribution. t Number of bonds established between JAM-A cell-surface receptors and T3SA+ before (grey dashed) and after injection of sialylated or non-sialylated glycans (colored). Error bars indicate s.d. of the mean value. The statistical analysis is shown in Supplementary Table 1. For all experiments, data are representative of at least n = 15 cells from n = 5 independent experiments. Source data are provided as a Source Data file
Fig. 8
Fig. 8
Multivalent anchorage of virions alters diffusion potential and binding behavior. a Biolayer interferometry data for the binding of reovirus (T3SA−, T3SA+ and T3SA+ ISVP) to JAM-A receptor immobilized on NTA-coated biosensors. The effect of addition of 1 mM Neu5Ac in solution was tested for both T3SA− and T3SA+. Sensorgram starts with baseline (BL) measurement following by the immobilization of JAM-A to the NTA biosensor (loading), the addition of the virions (association), and finally by the dissociation phase. bf Real-time confocal fluorescence imaging of reovirus particles (labeled with Alexa Fluor 488 dye) incubated with co-cultured CHO-JAM-A and fluorescently labeled Lec2-JAM-A cells in the absence (b, c) and presence (d, e) of 1 mM Neu5Ac. b, d Overlay images of Alexa Fluor 488 (virions), mCherry-actin (Lec2-Jam-A), and PMT signals. c, e Time-lapse trajectories of T3SA+ particles. White and yellow trajectories represent the movement on Lec2-JAM-A cells and CHO-JAM-A cells, respectively. Magnification of each trajectory is shown on the right side with the corresponding number (scale bar: 1 µm). f Analysis of the mean travelled distance (top panel), mean travel speed (middle panel), and bound viral particles (bottom panel) for T3SA+ binding in the absence (grey) or presence (red) of Neu5Ac as well as for T3SA− binding in the absence (white) or presence (light red) of Neu5Ac following adsorption to the cell mixture. The horizontal line within the box plot (bottom panel) indicates the median, boundaries of the box indicate the 25th and 75th percentile, and the whiskers indicate the highest and lowest values of the results. The square in the box indicates the mean. Data are representative of at least n = 3 independent experiments, with a minimum of n = 15 analyzed trajectories each. ***P < 0.001; ****P< 0.0001; determined by two-sample t-test in Origin. Error bars indicate s.d. of the mean value. Source data are provided as a Source Data file
Fig. 9
Fig. 9
Glycan-mediated enhancement of reovirus receptor binding. Upon binding of α-SA, the σ1 outer capsid proteins undergo a conformational change leading to a more extended conformation. This results in an increased affinity for JAM-A

References

    1. Grove J, Marsh M. The cell biology of receptor-mediated virus entry. J. Cell Biol. 2011;195:1071–1082. doi: 10.1083/jcb.201108131. - DOI - PMC - PubMed
    1. Pelkmans L, Helenius A. Insider information: what viruses tell us about endocytosis. Curr. Opin. Cell Biol. 2003;15:414–422. doi: 10.1016/S0955-0674(03)00081-4. - DOI - PubMed
    1. Boulant S, Stanifer M, Lozach PY. Dynamics of virus-receptor interactions in virus binding, signaling, and endocytosis. Viruses. 2015;7:2794–2815. doi: 10.3390/v7062747. - DOI - PMC - PubMed
    1. Snijder B, et al. Population context determines cell-to-cell variability in endocytosis and virus infection. Nature. 2009;461:520–523. doi: 10.1038/nature08282. - DOI - PubMed
    1. Bouziat R, et al. Reovirus infection triggers inflammatory responses to dietary antigens and development of celiac disease. Science. 2017;356:44–50. doi: 10.1126/science.aah5298. - DOI - PMC - PubMed

Publication types

MeSH terms