. 2019 Oct 1;9(1):14107.
doi: 10.1038/s41598-019-50531-3.

Unraveling FATP1, regulated by ER-β, as a targeted breast cancer innovative therapy

Affiliations

Unraveling FATP1, regulated by ER-β, as a targeted breast cancer innovative therapy

Cindy Mendes et al. Sci Rep. .

Abstract

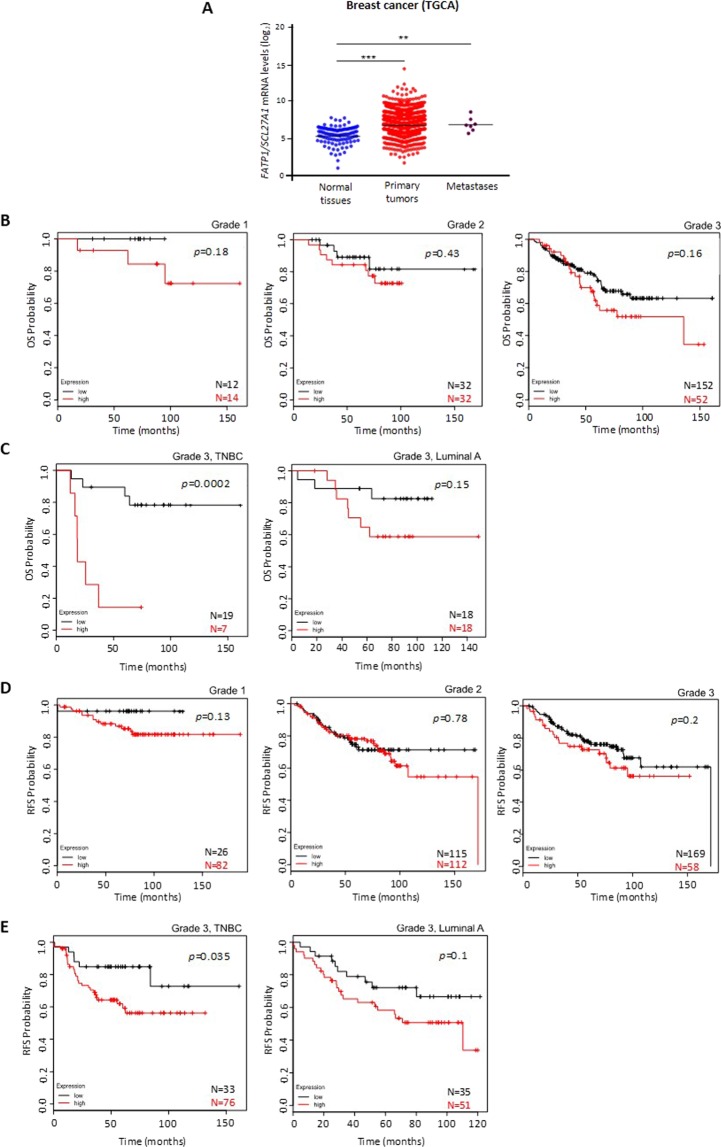
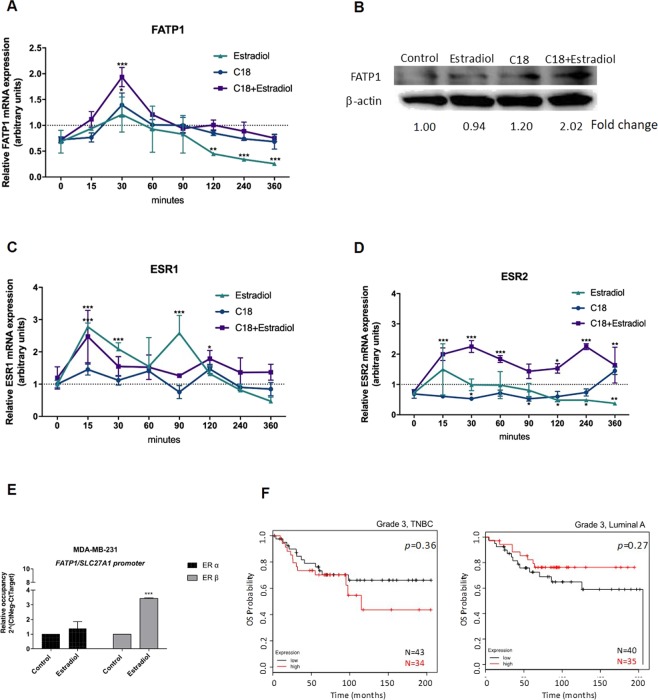
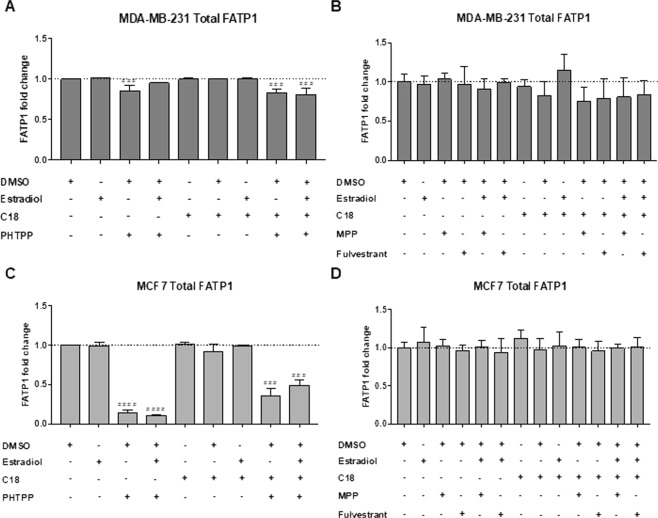
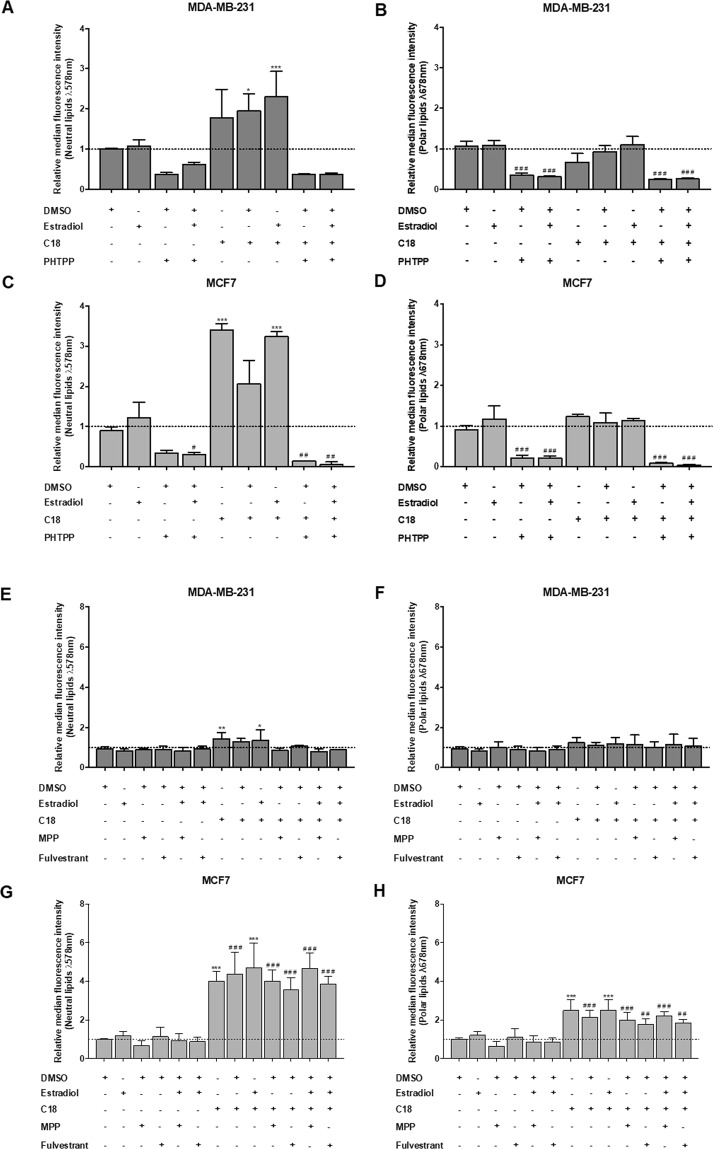
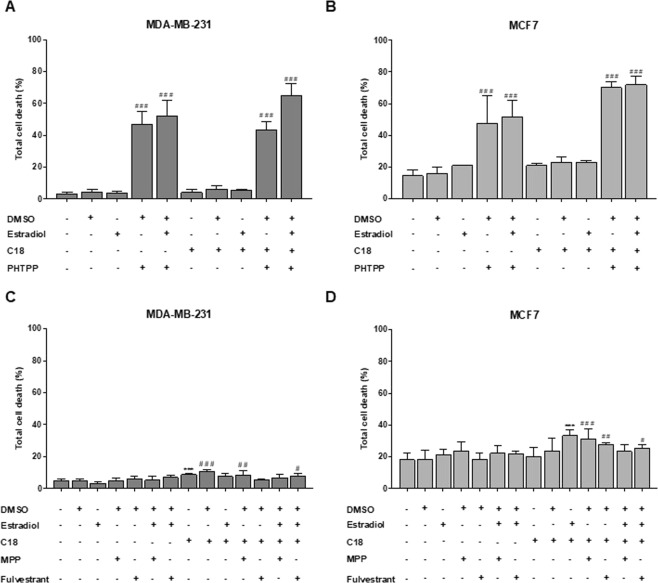
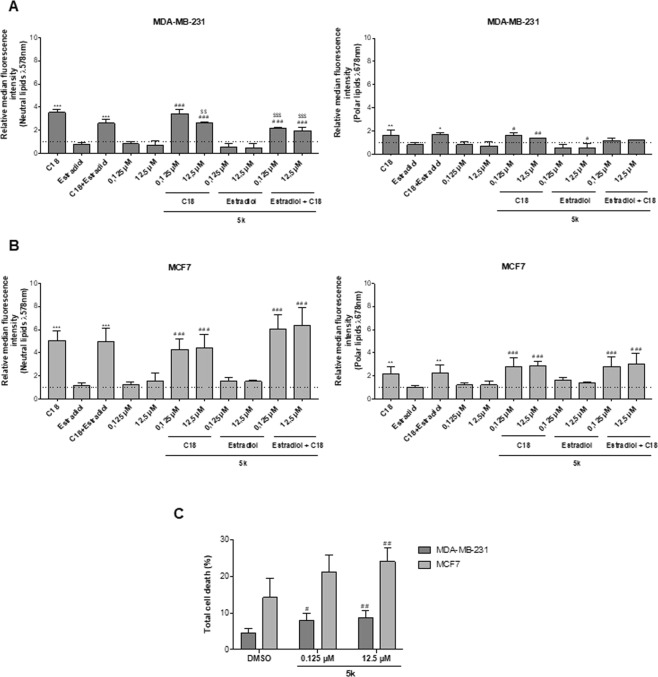
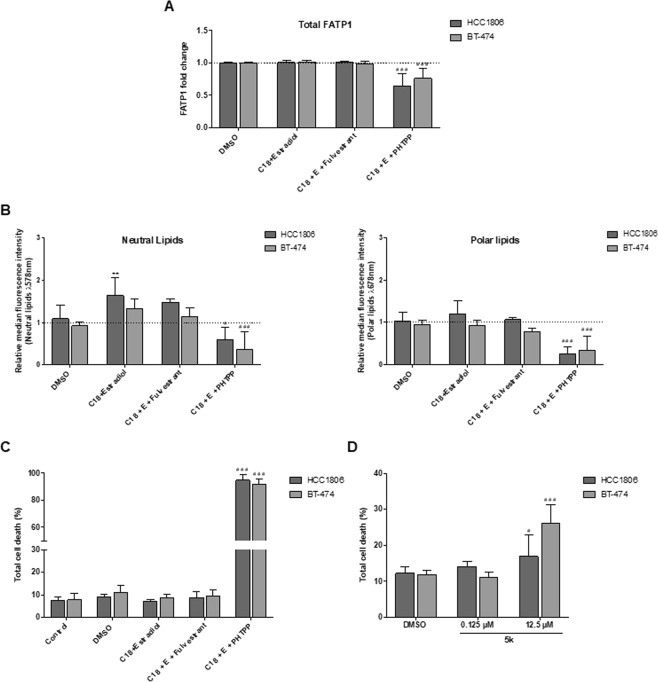
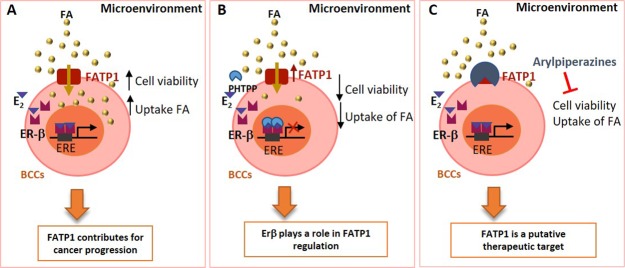
The biochemical demands associated with tumor proliferation prompt neoplastic cells to augment the import of nutrients to sustain their survival and fuel cell growth, with a consequent metabolic remodeling. Fatty acids (FA) are crucial in this process, since they have a dual role as energetic coins and building blocks. Recently, our team has shown that FATP1 has a pivotal role in FA transfer between breast cancer cells (BCCs) and non-cancerous cells in the microenvironment. We aimed to investigate the role of FATP1 in BCCs and also to explore if FATP1 inhibition is a promising therapeutic strategy. In patients' data, we showed a higher expression of FATP1/SLC27A1 in TNBC, which correlated with a significant decreased overall survival (OS). In vitro, we verified that FA and estradiol stimulated FATP1/SLC27A1 expression in BCCs. Additionally, experiments with estradiol and PHTPP (ER-β antagonist) showed that estrogen receptor-β (ER-β) regulates FATP1/SLC27A1 expression, the uptake of FA and cell viability, in four BCC lines. Furthermore, the inhibition of FATP1 with arylpiperazine 5k (DS22420314) interfered with the uptake of FA and cell viability. Our study, unraveled FATP1 as a putative therapeutic target in breast cancer (BC).


Conflict of interest statement

The authors declare no competing interests.

Figures

Figure 1
Figure 1
Patients with higher levels of FATP1/SLC27A1 expression have a lower OS and RFS. (A) Analysis of FATP1/SLC27A1 expression profiles in normal breast tissue, primary carcinomas and metastasis, data extracted from the TCGA database. A two-tailed unpaired Student’s t-test with Welch’s correction was used. Comparison of the overall survival (OS) and relapse free survival (RFS) curves of GEO database patients with high levels of FATP1 (red line) and low levels of FATP1 (black line) expression using Kaplan-Meier method. (B) Kaplan-Meier survival curves for patients with BC grade 1 (n = 26), grade 2 (n = 64) and grade 3 (n = 204). (C) Kaplan-Meier survival curves for patients with grade 3, TNBC BC (n = 26) and grade 3, luminal A BC (n = 36). (D) Kaplan-Meier RFS curves for patients with BC grade 1 (n = 108), grade 2 (n = 227) and grade 3 (n = 227). (E) Kaplan-Meier survival curves for patients with grade 3, TNBC BC (n = 108) and grade 3, luminal A BC (n = 86).
Figure 2
Figure 2
Linoleic acid (C18) and estradiol stimulate FATP1/SLC27A1 expression and estradiol stimulates the binding of ER-β to FATP1/SLC27A1 promoter (A) FATP1/SLC27A1, (C) ESR1 and (D) ESR2 expression levels in MDA-MB-231 cells in a pulse chase experiment referenced to the control condition. (B) Western blotting for FATP1 detection, the numbers are indicative of fold change of each condition (normalized for the respective β-actin) in relation to control. (C) ESR1 and (D) ESR2 expression levels in MDA-MB-231 cells in a pulse chase experiment referenced to the control condition. In relative qPCR, hypoxanthine-guanine phosphoribosyltransferase (HPRT) gene was used as housekeeping gene. (E) Relative occupancy of ER-α and ER-β at FATP1/SLC27A1 promoter. Cells were cultured in control and in estradiol conditions and ER-α and ER-β binding was assessed by ChIP. Data are mean ± error bars of biological triplicates, only adherent cells were analyzed, dead cells in culture media were discarded. (F) Kaplan-Meier survival curves for patients with grade 3, TNBC (n = 77) and grade 3, luminal A BC (n = 75) for the ESR2 gene. *p < 0.05 **p < 0.01 ***p < 0.001. (*) represents the statistical analysis in relation to control condition (dot line). For pulse chase qPCR experiments a Two-way ANOVA with Tukey’s test was used.
Figure 3
Figure 3
FATP1 is downregulated in BCCs treated with PHTPP. BCCs were cultured in control (baseline culture medium represented by the dot line), control DMSO, estradiol and/or C18 conditions, in the presence or absence of PHTPP (A,C) and in the presence or absence of MPP and Fulvestrant (B,D), being analyzed by flow cytometry. Values are referenced to control/DMSO conditions within each cell line. Biological triplicates were tested, only adherent cells were analyzed and dead cells in culture media were discarded. Results are shown as mean ± SD. *p < 0.05, **p < 0.01, ***p < 0.001, ****p < 0.0001. (*) represents the statistical analysis in relation to control condition and (#) represents the statistical analysis in relation to DMSO condition. One-way ANOVA with Dunnett’s multiple comparisons test.
Figure 4
Figure 4
MDA-MB-231 and MCF7 cells exposed to PHTPP accumulate less FA. Cells were cultured in control (baseline culture medium represented by the dot line), control DMSO, estradiol and/or C18 conditions, in the presence or absence of PHTPP (A–D) or in the presence or absence of MPP and Fulvestrant (E–H). A flow cytometry analysis of Nile red staining was performed to evaluate the accumulation of neutral (λ 578 nm) and polar (λ 678 nm) lipids. Values are referenced to control/DMSO conditions within each cell line. Biological triplicates were tested, only adherent cells were analyzed and dead cells in culture media were discarded. Results are shown as mean ± SD. *p < 0.05, **p < 0.01, ***p < 0.001. (*) represents the statistical analysis in relation to control condition and (#) represents the statistical analysis in relation to control DMSO condition. One-way ANOVA with Dunnett’s multiple comparisons test.
Figure 5
Figure 5
PHTPP affects cell viability of MDA-MB-231 and MCF7. Cells were cultured in control, control DMSO, estradiol and/or C18 conditions, in the presence or absence of PHTPP (A,B) or in the presence or absence of MPP and Fulvestrant (C,D) and were analyzed by flow cytometry. Results are shown as mean ± SD. *p < 0.05, **p < 0.01, ***p < 0.001. (#) represents the statistical analysis in relation to DMSO condition. Biological triplicates were tested, adherent cells were dead cells in culture media were analyzed. One-way ANOVA with Dunnett’s multiple comparisons test.
Figure 6
Figure 6
Arylpiperazine 5k (DS22420314) interferes with FA uptake and cell viability. Cells were cultured in control, control DMSO, estradiol with and without C18 and exposed to arylpiperazine 5k (DS22420314). Nile red labelling was analyzed by flow cytometry in MDA-MB-231 cells (A) and MCF7 cells (B). Cell death assay was performed in cells exposed to arylpiperazine 5k (DS22420314) and compared to control and control DMSO, using flow cytometry using Annexin V and PI (C). Values are referenced to control/DMSO conditions within each cell line. Data are means of biological triplicates. Results are shown as mean ± SD. *p < 0.05, **p < 0.01, ***p < 0.001. (*) represents the statistical analysis in relation to the control condition; (#) statistical analysis in relation to the DMSO condition; ($) statistical analysis in relation to the C18 condition. Biological triplicates were tested, adherent cells were dead cells in culture media were analyzed. The dot line defines the relative median fluorescence intensity for the control conditions. Multiple comparisons were performed using One-way ANOVA with Dunnett’s or Tukey’s test.
Figure 7
Figure 7
ER-β signaling regulates the expression of FATP1 and FA uptake in BT-474 and HCC1806 cells. BT-474 and HCC1806 cells were cultured in control, control DMSO, estradiol and C18 conditions, in the presence or absence of Fulvestrant and PHTPP (AC). Cells were also exposed to arylpiperazine 5k and compared to control DMSO (D). Total FATP1/SLC27A1 expression was analyzed by flow cytometry (a). Nile red labelling was analyzed to evaluate the accumulation of neutral (λ 578 nm) and polar (λ 678 nm) lipids by flow cytometry (B). Cell death assay was performed with flow cytometry using Annexin V and PI (C,D). Values are referenced to control/DMSO conditions within each cell line. Results are shown as mean ± SD. *p < 0.05, **p < 0.01, ***p < 0.001. (*) represents the statistical analysis in relation to control condition and (#) represents the statistical analysis in relation to DMSO condition. Biological triplicates were tested, only adherent cells were analyzed and dead cells in culture media were discarded; except in cell death analysis in which adherent and dead cells were analyzed together. Multiple comparisons were performed using One-way ANOVA with Dunnett’s or Tukey’s test.
Figure 8
Figure 8
Stimulation of ER-β by estradiol contributes to FATP1/SLC27A1 expression and cell survival of breast cancer cells (BCCs). FATP1, whose expression may be controlled by estradiol via ER-β that is a pro-survival element, mediating the transport of Fatty acids (FA), which are essential for BCCs (A). BCCs exposed to PHTPP (ER-β antagonist) show a decreased cell viability and lower uptake of FA suggesting that ER-β controls FATP1/SLC27A1 expression (B). The inhibition of FATP1 with arylpiperazine 5k (DS22420314) interferes with the uptake of FA and cell viability indicating that FATP1 is a putative therapeutic target in BC (C).

Similar articles

Cited by

References

    1. Torre LA, et al. Global Cancer Statistics, 2012. CA Cancer J Clin. 2015;65:87–108. doi: 10.3322/caac.21262. - DOI - PubMed
    1. Whiteside TL. The tumor microenvironment and its role in promoting tumor growth. Oncogene. 2008;27:5904–5912. doi: 10.1038/onc.2008.271. - DOI - PMC - PubMed
    1. Serpa J, Dias S. Metabolic cues from the microenvironment act as a major selective factor for cancer progression and metastases formation. Cell Cycle. 2011;10:180–181. doi: 10.4161/cc.10.2.14476. - DOI - PubMed
    1. Yamaguchi Y. Microenvironmental regulation of estrogen signals in breast cancer. Breast Cancer. 2007;14:175–81. doi: 10.2325/jbcs.975. - DOI - PubMed
    1. Russo J, Russo IH. The role of estrogen in the initiation of breast cancer. J. Steroid Biochem. Mol. Biol. 2006;102:89–96. doi: 10.1016/j.jsbmb.2006.09.004. - DOI - PMC - PubMed

Publication types

MeSH terms