. 2019 Oct 1;9(1):14065.
doi: 10.1038/s41598-019-50547-9.

CD98hc (SLC3A2) sustains amino acid and nucleotide availability for cell cycle progression

Affiliations

CD98hc (SLC3A2) sustains amino acid and nucleotide availability for cell cycle progression

Sara Cano-Crespo et al. Sci Rep. .

Abstract

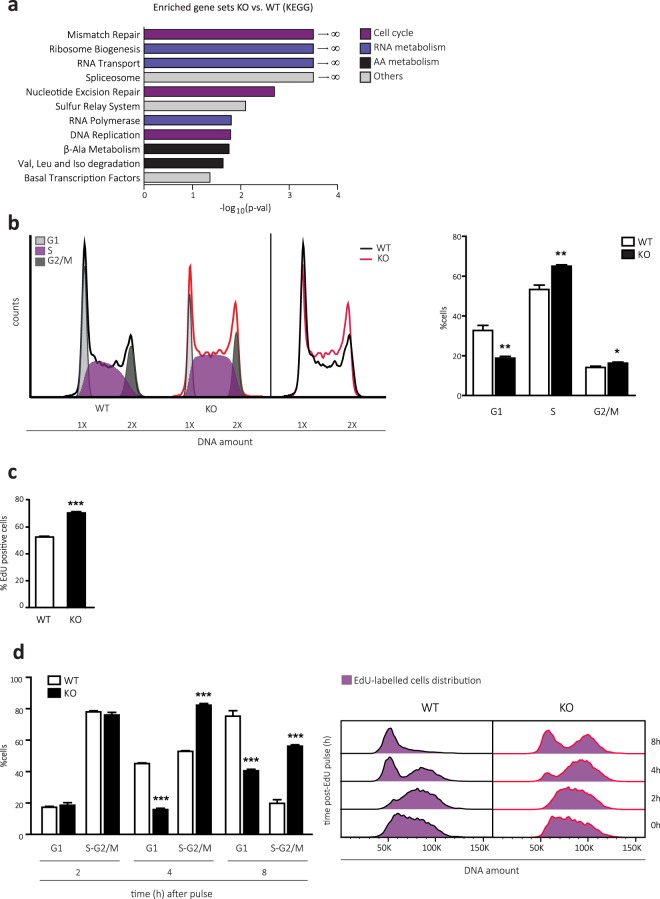
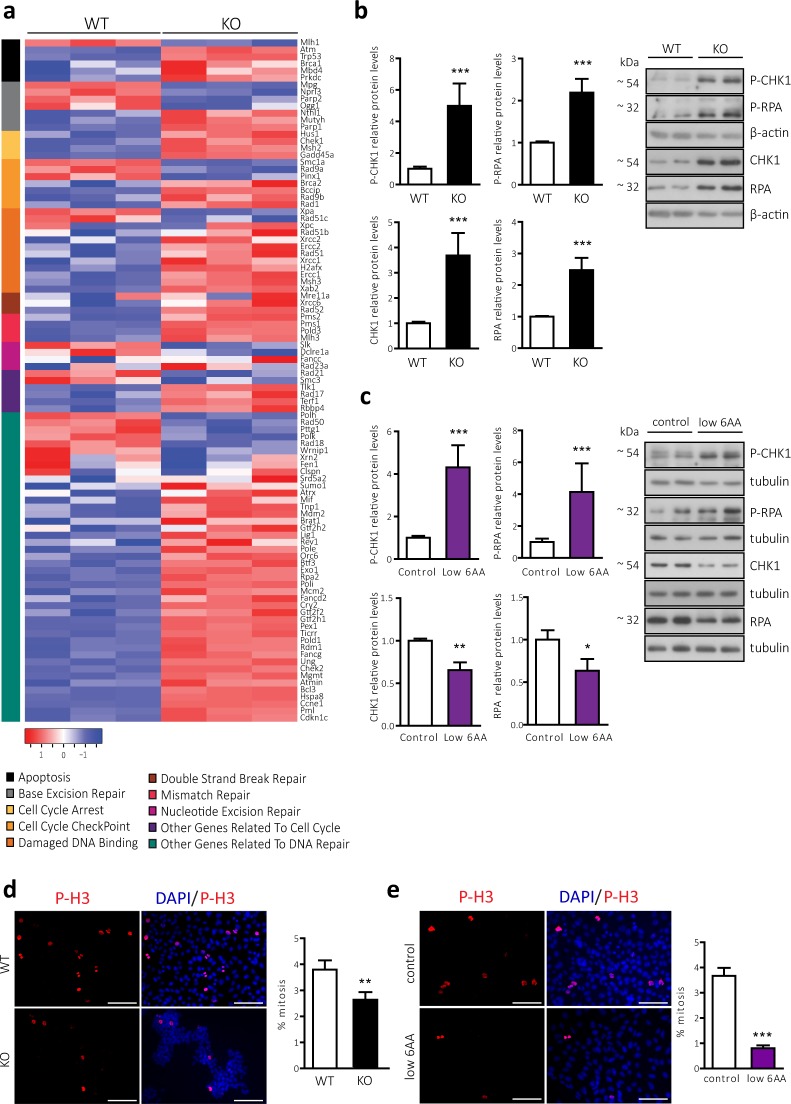
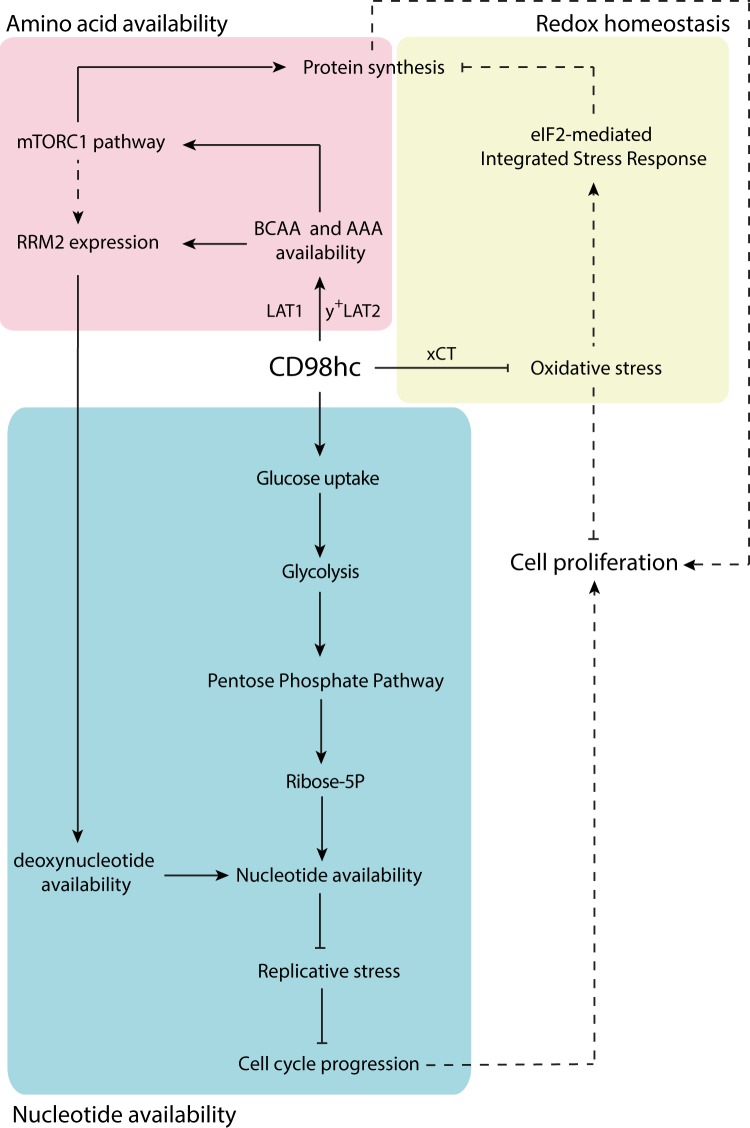
CD98 heavy chain (CD98hc) forms heteromeric amino acid (AA) transporters by interacting with different light chains. Cancer cells overexpress CD98hc-transporters in order to meet their increased nutritional and antioxidant demands, since they provide branched-chain AA (BCAA) and aromatic AA (AAA) availability while protecting cells from oxidative stress. Here we show that BCAA and AAA shortage phenocopies the inhibition of mTORC1 signalling, protein synthesis and cell proliferation caused by CD98hc ablation. Furthermore, our data indicate that CD98hc sustains glucose uptake and glycolysis, and, as a consequence, the pentose phosphate pathway (PPP). Thus, loss of CD98hc triggers a dramatic reduction in the nucleotide pool, which leads to replicative stress in these cells, as evidenced by the enhanced DNA Damage Response (DDR), S-phase delay and diminished rate of mitosis, all recovered by nucleoside supplementation. In addition, proper BCAA and AAA availability sustains the expression of the enzyme ribonucleotide reductase. In this regard, BCAA and AAA shortage results in decreased content of deoxynucleotides that triggers replicative stress, also recovered by nucleoside supplementation. On the basis of our findings, we conclude that CD98hc plays a central role in AA and glucose cellular nutrition, redox homeostasis and nucleotide availability, all key for cell proliferation.


Conflict of interest statement

The authors declare no competing interests.

Figures

Figure 1
Figure 1
CD98hc ablation leads to BCAA and AAA shortage-dependent mTORC1 inactivation and –independent eIF2-mediated integrated stress response with reduced general protein synthesis. (a) Proliferation of control and low 6AA cells. n = 3. (b) Intracellular AA content in control and low 6AA cells. AAs are grouped by side chain properties as indicated. n = 5. (c) ROS levels quantified by flow cytometry using the fluorescent free radical sensor H2DCFDA in control, low 6AA, WT and CD98hc KO cells. a.u., arbitrary units. n = 3. (d) Nrf2 protein expression in control and low 6AA cells (left panels). n = 4. Tert-butylhydroquinone (BHQ) treatment (50 µM, 1 h) and CD98 KO cells were used as positive controls of oxidative stress (right panel, representative experiment). 50 μg of protein extracts were loaded in each lane. Data are normalised by β-actin and tubulin expression (left and right panels, respectively). Full-length blots are presented in Supplementary Fig. S2. (e) S6 phosphorylation in WT and CD98hc KO cells with no additives or in the presence of BCAA- and AAA- containing dipeptides. Data are normalised by total levels of S6 protein and tubulin expression. n = 4. Full-length blots are presented in Supplementary Fig. S2. (f) S6 phosphorylation in control and low 6AA cells. Data are normalised by total levels of S6 protein and tubulin expression. n = 4. Full-length blots are presented in Supplementary Fig. S2. (g) eIF2α phosphorylation in WT and CD98hc KO cells with no additives or in the presence of BCAA- and AAA- containing dipeptides. Data are normalised by total levels of eIF2α protein and tubulin expression. n = 3. Full-length blots are presented in Supplementary Fig. S2. (h) eIF2α phosphorylation in control and low 6AA cells. Data are normalised by total levels of eIF2α protein and tubulin expression. n = 3. Full-length blots are presented in Supplementary Fig. S2. (i,j) 35S-methionine incorporation into protein in WT and CD98hc KO cells (i) and control and low 6AA cells (j). DPM, disintegrations per minute. n = 4. Data quantification correspond to the mean ± SEM of the independent experiments (n) indicated for each graph normalised to control or WT cells. Statistical significance *p ≤ 0.05; **p ≤ 0.01; ***p ≤ 0.001 vs. control or WT cells, #p ≤ 0.05; ##p ≤ 0.01; ###p ≤ 0.001 vs. CD98hc KO cells was analysed using a Student’s t‐test (panels a, b, c, i and j) or a linear model (panels d, e, f, g and h).
Figure 2
Figure 2
CD98hc depletion leads to delayed S-phase. (a) Gene Set Enrichment Analysis (GSEA) of transcriptional data from WT and CD98hc KO cells. Bars represent significantly positively enriched gene sets (nominal p-value < 5%, FDR < 25%) in CD98hc KO cells compared to WT cells according to the KEGG data base. Bars are coloured following the functional characterisation as indicated. X-axis: -log10 (p-val). (b) Cell cycle distribution measured by flow cytometry using propidium iodide (PI) staining. 10,000 cells/condition were analysed. A representative cell cycle profile of WT and CD98hc KO cells is shown, along with the overlap of their profiles (left panel). The graphical representation of cell cycle distribution (right panel) shows the percentage of cells in G1, S and G2/M phases in WT and CD98hc KO cells. n = 4. (c) Percentage of EdU-positive cells. WT and CD98hc KO cells were pulsed with 10 μM EdU for 1 h and EdU incorporation was quantified by FACS from the corresponding gates displayed in Supplementary Fig. S4 at 0 h. 10,000 cells/condition were analysed. n = 3. (d) EdU pulse-chase time course showing the dynamics WT and CD98hc KO cells over 8 h. Cells were pulsed with 10 μM EdU for 1 h and stained with propidium iodide (PI) and fluorescent azide. EdU incorporation and PI staining were quantified by FACS. Left panel, the percentage of Edu-positive WT and CD98hc KO cells in G1 and S-G2/M phases out of total was quantified from the corresponding gates displayed in Supplementary Fig. S4 at the indicated time points. 10,000 cells/condition were analysed. n = 3. Right panel, representative histogram overlay plot of DNA (PI) from the EdU-positive cells over varying time points. Data quantification correspond to the mean ± SEM of the independent experiments (n) indicated for each graph. Statistical significance *p ≤ 0.05; **p ≤ 0.01; ***p ≤ 0.001 vs. WT cells was analysed using a Student’s t‐test.
Figure 3
Figure 3
CD98hc deletion and BCAA and AAA shortage lead to replicative stress and impaired mitotic rate (a) Heat map of RNA expression level of 97 genes involved in DNA damage signalling pathways (see Methods) in WT and CD98hc KO cells grouped in the specified categories. Rows: genes; columns: samples. Range of colours (red/high to blue/low) shows the range of expression values after scaling within each sample. (b) Phosphorylated and total protein levels of CHK1 an RPA in WT and CD98hc KO cells. Data are normalised by β-actin expression. n = 5. Full-length blots are presented in Supplementary Fig. S6. (c) Phosphorylated and total protein levels of CHK1 an RPA in control and low 6AA cells. Data are normalised by tubulin expression. n = 3. Full-length blots are presented in Supplementary Figs. S6 and S2 (lowest panel, tubulin corresponding to CHK1). (d) Mitotic rate in WT and CD98hc KO by immunofluorescence. The phosphorylation of Histone H3 (P-H3, red) was used as a marker for cells undergoing mitosis. DNA was stained with DAPI (blue) (left panel). Scale bar is 50 microns. More than 30,000 nuclei/condition were analysed. The percentage of mitotic cells is shown (right panel). n = 7. (e) Mitotic rate in control and low 6AA cells by immunofluorescence. The phosphorylation of Histone H3 (P-H3, red) was used as a marker for cells undergoing mitosis. DNA was stained with DAPI (blue) (left panel). Scale bar is 50 microns. More than 30,000 nuclei/condition were analysed. The percentage of mitotic cells is shown (right panel). n = 7. Data quantification correspond to the mean ± SEM of the independent experiments (n) indicated for each graph normalised to WT or control cells. Statistical significance *p ≤ 0.05; **p ≤ 0.01; ***p ≤ 0.001 vs. WT or control cells was analysed using a linear model (panels b and c) or a Student’s t‐test (panels d and e).
Figure 4
Figure 4
CD98hc and BCAA and AAA availability are required for correct maintenance of the intracellular nucleotide pool (a) Content of nucleotides in WT and CD98hc KO cells. Data are normalized to cell number. n = 5. (b) PPP activity was analysed by stable isotope tracer-based metabolomics in WT and CD98 KO cells. Total content of ribose-5P and 13C-ribose-5P (M + 5; five 13C carbon atoms) in WT and CD98hc KO cells. Data are normalized to cell number. n = 5. (c) GLUT1 protein expression in total membranes of WT and CD98hc KO cells. Data are normalized by β-actin expression. n = 4. Full-length blots are presented in Supplementary Fig. S7. (d) Glucose uptake measured by using the fluorescent glucose analogue 2-NBDG in WT and CD98hc KO cells. a.u., arbitrary units. n = 4. (e) Glycolysis analysed by stable isotope tracer-based metabolomics in WT and CD98hc KO cells. Total content of lactate and 13C-lactate (M + 3; three 13C carbon atoms) (left panel) and total content of pyruvate and 13C-pyruvate (M + 3; three 13C carbon atoms) (right panel) in CD98hc KO and WT cells. n = 5. (f) Content of nucleotides in control and low 6AA cells. Deoxynucleotides are highlighted. Data are normalized to cell number. n = 5. (g) RRM2 protein expression in control and low 6AA cells. Data are normalised by vinculin expression. n = 4. Full-length blots are presented in Supplementary Fig. S7. (h) PPP activity was analysed by stable isotope tracer-based metabolomics in control and low 6AA cells. 13C-Ribose-5P (M + 5; five 13C carbon atoms) in control and low 6AA cells. n = 5. For isotope tracer-based metabolomics analysis (b,e,h) cells were cultured with 5 mM fully labelled glucose (U-13C6-Glucose) for 16 h. Data quantification correspond to the mean ± SEM of the independent experiments (n) indicated for each graph normalised to WT or control cells. Statistical significance *p ≤ 0.05; **p ≤ 0.01; ***p ≤ 0.001 vs. WT or control cells was analysed using a Student’s t‐test (panels a, b, d, e, f and h) or a linear model (panels c and g).
Figure 5
Figure 5
Nucleosides reverse cell cycle alterations in CD98hc KO cells. (a) Cell cycle distribution was measured by flow cytometry using propidium iodide (PI) staining. A representative cell cycle profile of WT and CD98hc KO cells with no additives or in the presence of nucleosides (150 µM cytidine, 150 µM guanosine, 150 µM uridine, 150 µM adenosine and 50 µM thymidine for 48 h) is shown, along with the overlap of their profiles (left panel). The graphical representation of cell cycle distribution shows the percentage of cells in G1, S and G2/M phases (right panel). n = 4. (b) Phosphorylated and total protein levels of CHK1 (n = 6) and RPA (n = 4) in WT and CD98hc KO cells with no additives or in the presence of nucleosides (150 µM cytidine, 150 µM guanosine, 150 µM uridine, 150 µM adenosine and 50 µM thymidine for 48 h). Data are normalised by tubulin expression. Full-length blots are presented in Supplementary Fig. S8. (c) Mitotic rate in WT and CD98hc KO cells with no additives or in the presence of nucleosides (150 µM cytidine, 150 µM guanosine, 150 µM uridine, 150 µM adenosine and 50 µM thymidine for 48 h) by immunofluorescence. The phosphorylation of Histone H3 (P-H3, red) was used as a marker for cells undergoing mitosis. DNA was stained with DAPI (blue) (left panel). Scale bar is 50 microns. Quantification of the percentage of mitotic cells is shown. More than 30,000 nuclei/condition from six independent experiments were analysed (right panel). Data quantification correspond to the mean ± SEM of the independent experiments (n) indicated for each graph normalised to WT cells. Statistical significance *p ≤ 0.05; **p ≤ 0.01; ***p ≤ 0.001 vs. WT or #p ≤ 0.05; ##p ≤ 0.01; ###p ≤ 0.001 vs. CD98hc KO cells was analysed using a Student’s t-test (panels a and c) or a linear model (panel b).
Figure 6
Figure 6
CD98hc sustains cellular nutrition, redox homeostasis and nucleotide availability, all key for cell proliferation. CD98hc-xCT is required for the counterbalance of the oxidative stress, thereby avoiding the activation of the eIF2α-mediated integrated stress response pathway. In addition, CD98hc sustains BCAA and AAA availability, mostly mediated via LAT1, although contribution of y+LAT2 cannot be discarded, for general protein synthesis and cell proliferation, as evidenced by the downregulated mTORC1 activity, protein synthesis and proliferation rate in both cellular models CD98hc KO and low 6AA cells. Furthermore, as demonstrated in low 6AA cells, AA availability sustains RRM2 expression, and, as a consequence, has an impact in the reduction of ribonucleotides to the corresponding deoxynucleotides, thereby balancing the cellular nucleotide content. In the same line, CD98hc regulates the cellular nucleotide pool, likely through the regulation of the pentose phosphate pathway flux, which enables cells to progress adequately throughout the cell cycle. The lack of CD98hc triggers a reduction in the glucose uptake and disposal, resulting in repressed glycolysis, which probably underlies the pentose phosphate pathway abrogation and the subsequent DNA replicative stress. Solid lines represent established connexions proposed in this work. Dashed lines represent connexions suggested by the data provided herein and literature.

References

    1. Bröer S, Palacín M. The role of amino acid transporters in inherited and acquired diseases. Biochem. J. 2011;436:193–211. doi: 10.1042/BJ20101912. - DOI - PubMed
    1. Fotiadis D, Kanai Y, Palacín M. The SLC3 and SLC7 families of amino acid transporters. Mol. Aspects Med. 2013;34:139–158. doi: 10.1016/j.mam.2012.10.007. - DOI - PubMed
    1. Fenczik CA, et al. Distinct Domains of CD98hc Regulate Integrins and Amino Acid Transport. J. Biol. Chem. 2001;276:8746–8752. doi: 10.1074/jbc.M011239200. - DOI - PubMed
    1. Feral CC, et al. CD98hc (SLC3A2) mediates integrin signaling. Proc. Natl. Acad. Sci. USA. 2005;102:355–60. doi: 10.1073/pnas.0404852102. - DOI - PMC - PubMed
    1. Fenczik CA, Sethi T, Ramos JW, Hughes PE, Ginsberg MH. Complementation of dominant suppression implicates CD98 in integrin activation. Nature. 1997;390:81–85. doi: 10.1038/36349. - DOI - PubMed

Publication types

MeSH terms