. 2019 Oct 1;9(1):14126.
doi: 10.1038/s41598-019-50651-w.

Proteomic characterization of primary cultured myocytes in a fish model at different myogenesis stages

Affiliations

Proteomic characterization of primary cultured myocytes in a fish model at different myogenesis stages

Antonio F Millan-Cubillo et al. Sci Rep. .

Abstract

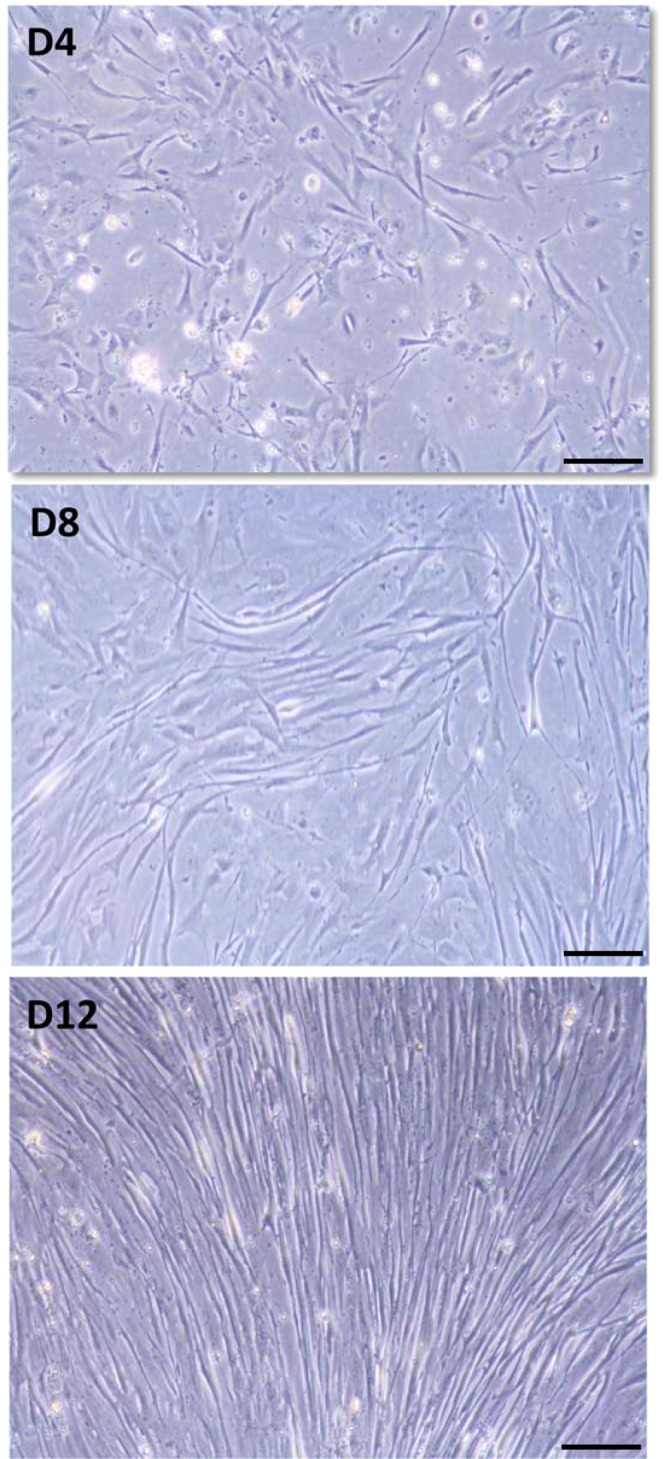
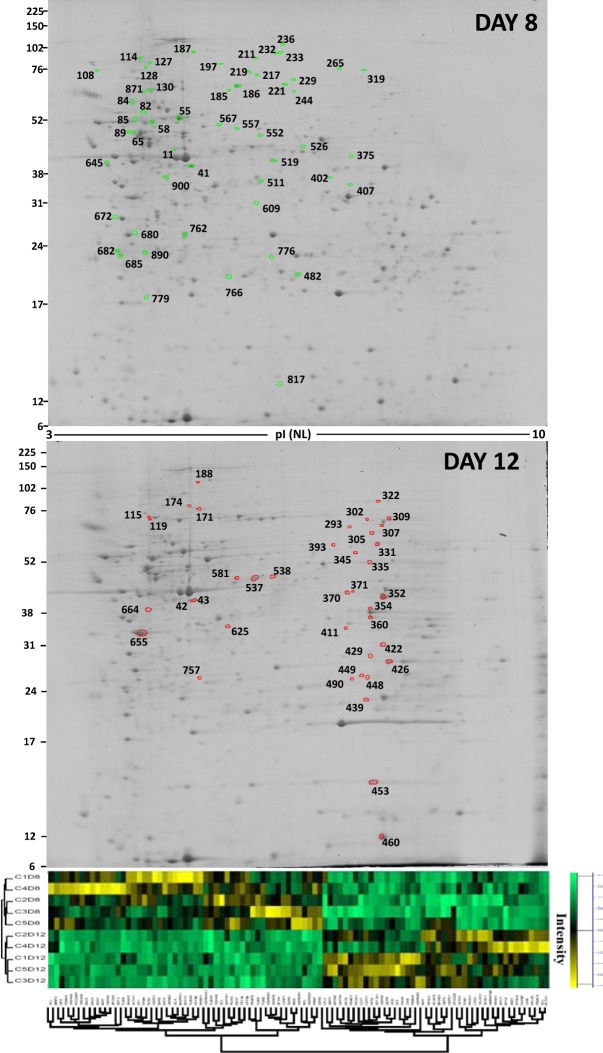
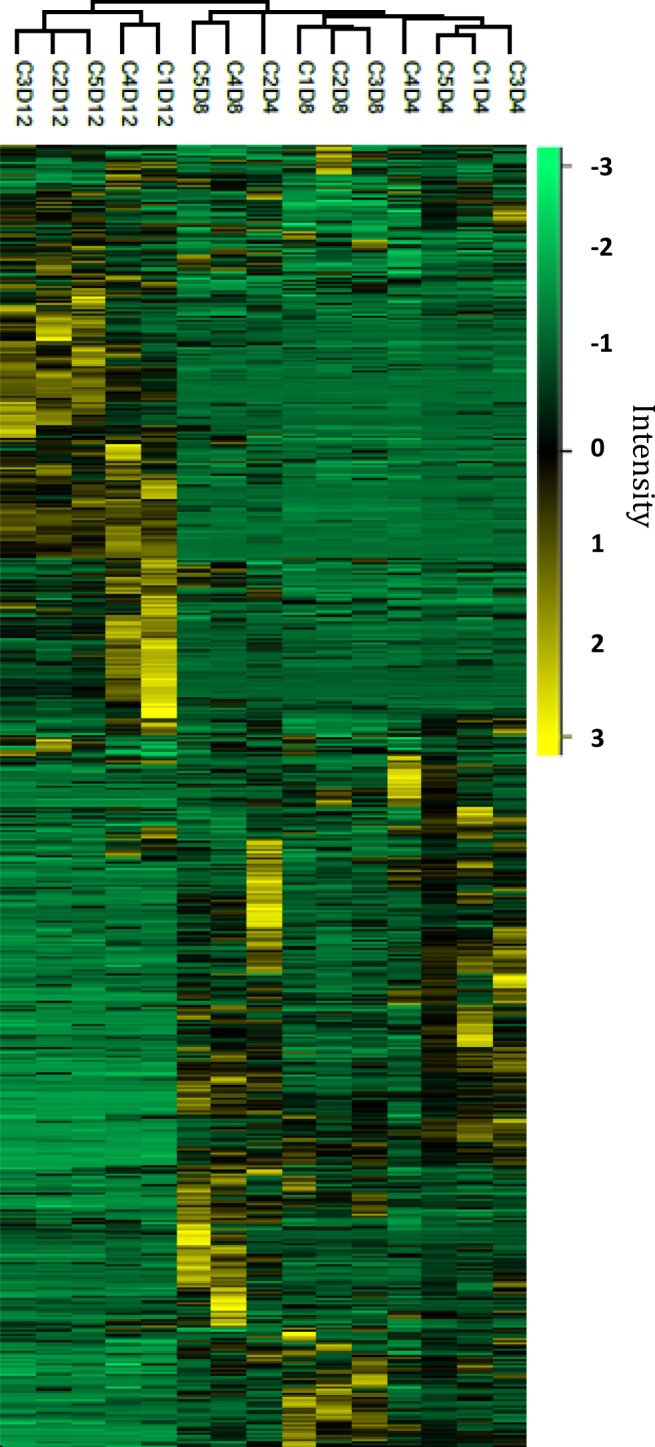
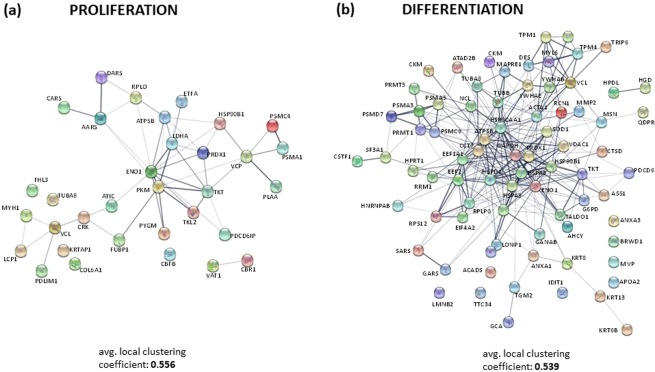
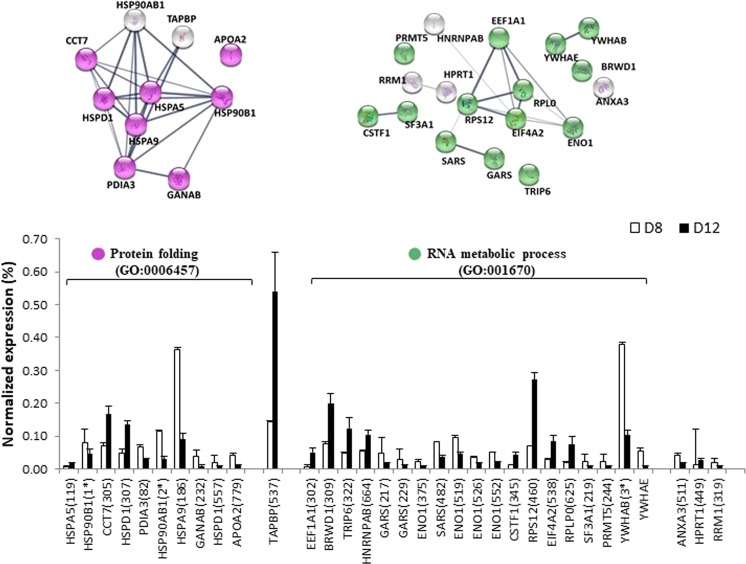
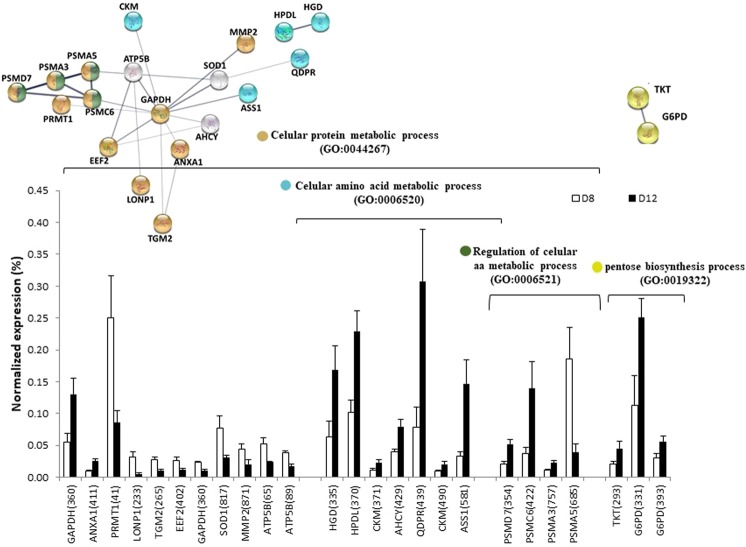
Myogenesis is a complex two-phase process of proliferation and differentiation, which seems to be greatly conserved in vertebrates. For the first time in fish, we identify the changes that occur in the proteome during this process in a gilthead sea bream (Sparus aurata) myocyte primary cell culture (on days 4, 8 and 12), using 2-D gel electrophoresis and LC-MS/MS. A significant increase of myogenin expression at day 8 marked the transition from proliferation to differentiation. Of the 898 spots in the proteome analysis, the 25 protein spots overexpressed on day 4 and the 15 protein spots overexpressed on day 8 indicate the end of proliferation and the beginning of differentiation, respectively. Proliferation was characterized by enrichment of proteins involved in actin cytoskeleton remodelling and in cellular metabolic processes (transcription, ubiquitination, response to stress and glucose metabolism). During differentiation, 41 proteins were overexpressed and 51 underexpressed; many of them related to biosynthetic processes (RNA and protein synthesis and folding, and pentose pathways), terminal myotube formation and muscle contraction. The main cellular processes of both phases of muscle development in fish are similar with those observed in mammals but extended in time, allowing sequential studies of myogenesis.


Conflict of interest statement

The authors declare no competing interests.

Figures

Figure 1
Figure 1
Differentiation of satellite cells isolated from skeletal muscle of gilthead sea bream and cultured on pre-treated plates with poly-L-lysine and laminin at 18 °C for 4 days (D4), 8 days (D8), and 12 days (D12). These images are of one representative sample of five independent culture. Scale bars: D4 to D12, 100 µm.
Figure 2
Figure 2
Expression of myogenin in cultured gilthead sea bream muscle cells. Myogenin expression was evaluated in myoblasts from day 1 to day 12 of culture by qPCR. Results are shown as mean ± SEM of 5 independent experiments. Values not sharing a common letter are significantly different (p < 0.05). (a.u.): arbitrary units.
Figure 3
Figure 3
2-DE master gels map showing the protein expression profiles from day 4 and day 8. Gels are loaded with 300 μg of total protein extract from the soluble muscle cell protein fractions. Proteins were separated in the first dimension on pH 3–10 non-linear IPG strips, followed by SDS-PAGE on 12.5% w/v gels. Gels were stained with colloidal CBB. Candidate spots listed on the gels were identified by MS. The images of full-length gels are shown in Supplementary information (Fig. S1: C2D4 of day 4 and C5D8 of day 8). Spots outlined in red and green indicate the proteins that were overexpressed and underexpressed respectively. Below each gel, the expression data for selected spots are shown in agglomerative hierarchical clusters of Z-score transformed intensity values (Perseus program). Cluster coloration indicates protein abundance in the sample (yellow: higher abundance, green: lower abundance, black: unchanged). C1, C2, C3, C4 and C5 represent five culture and D4 and D8 represent the day of culture: 4 or 8 days.
Figure 4
Figure 4
2-DE master gels map showing the protein expression profiles from day 8 and day 12. Details in Fig. 3. C1, C2, C3, C4 and C5 represent five culture and D8 and D12 represent the day of culture: 8 or 12 days. The images of full-length gels are shown in Supplementary information (Fig. S1: C5D8 of day 8 and C4D12 of day 12).
Figure 5
Figure 5
Heat map of the hierarchical clustering of the relative abundance of 898 matched spots on different days of muscular cell culturing. The vertical dendrogram represents the correlation distances between spot abundance levels (Perseus program). Every line represents one independent culture at one time-point, while the different spots represented by individual rows. Yellow indicates high levels of expression while green represents low levels. The intensity of the colours represents the relative abundance. C1, C2, C3, C4 and C5 represent five culture and D4, D8 and 12 days represent the day of culture: 4, 8 or 12 days. Raw data of each spot are included in Table S5 (Supplementary information). Individual gels are provided as Supplementary information (Gels C1D4 to C5D12).
Figure 6
Figure 6
The protein–protein interaction network, the interactome, of proteins differentially expressed during the two developmental stages in a gilthead sea bream primary muscle cell culture: (a) Proliferation and (b) Differentiation. The average local clustering coefficients were 0.556 and 0.539 for each phase respectively, and more relevant data from the network stats are provided in supplementary information (Tables S3 and S4). In these networks, nodes are proteins, the thickness of the line indicate the degree of confidence prediction of the interaction, according to the STRING databases. Protein acronyms correspond to Gene Symbol (for details, see Supplementary information: Table S1 (Proliferation) and Table S2 (Differentiation).
Figure 7
Figure 7
Functional clusters and abundance of differentially expressed proteins during the proliferation developmental stage (day 4 vs day 8) in a gilthead sea bream (Sparus aurata L.) primary muscle cell culture. On the top, the network analysis of protein-protein interactions among proteins grouped into 4 functional categories, according to Gene Ontology enrichment analysis by GOEAST. In this network, nodes are proteins, the thickness of the line indicate the degree of confidence prediction of the interaction, according to the STRING databases. On the bottom, the relative abundance of protein spots of each cluster are showed. Data are shown as mean ± SEM of % vol. Significant differences by t-test (p < 0.05). The average of local clustering coefficients were: 0.521 for “Cytoeskeleton” (GO: 0005856, p = 0.00804), 0.667 for “Aminoacyl-tRNA ligase activity” (GO: 0004812, p = 1.02e-05), 0.833 for “proteosome-mediated ubiquitin-dependent protein catabolic process” (GO: 0043161, p = 0.000866), 0.805 for “Generation of precursor metabolites and energy” (GO: 0006091, p = 3.54e-07). Protein acronyms correspond to Gene Symbol (see Supplementary Table S1 for details).The interactome of proliferation phase is represented in Fig. 6A, and more relevant data from the network stats are provided in Supplementary information (Table S3).
Figure 8
Figure 8
Relative abundance of differentially expressed proteins and functional clusters related with protein folding and RNA metabolic process during the differentiation developmental stage (day 8 vs day 12) in a gilthead sea bream primary muscle cell culture. On the top, the network analysis of protein-protein interactions among proteins grouped into two functional categories, according to Gene Ontology enrichment analysis by GOEAST. In these networks, nodes are proteins, the thickness of the line indicate the degree of confidence prediction of the interaction, according to the STRING. On the bottom, the relative abundance of protein spots of each cluster are showed. Data are shown as mean ± SEM of % vol. Significant differences by t-test (p < 0.05). The average of local clustering coefficients were 0.813 for “Protein folding” (GO: 0006457, p = 4.08e-11) and 0.678 for “RNA metabolic process” (GO: 001670, p = 1.66e-05). Protein acronyms correspond to Gene Symbol (see Supplementary Table S2 for details).The interactome of differentiation phase is represented in Fig. 6B, and more relevant data from the network stats are provided in Supplementary information (Table S4).
Figure 9
Figure 9
Relative abundance of differentially expressed proteins and functional clusters related with cellular protein metabolic process and pentose biosynthesis process during the differentiation developmental stage (day 8 vs day 12) in a gilthead sea bream primary muscle cell culture. On the top, the network analysis of protein-protein interactions among proteins grouped into four functional categories, according to Gene Ontology enrichment analysis by GOEAST. In these networks, nodes are proteins, the thickness of the line indicate the degree of confidence prediction of the interaction, according to the STRING databases. On the bottom, the relative abundance of protein spots of each cluster are showed. Data are shown as mean ± SEM of % vol. Significant differences by t-test (p < 0.05). The average of local clustering coefficients were 0.79 for “Cellular protein metabolic process” (GO: 0044267, p = 4.95e-05), which grouped two clusters: “Cellular amino acid metabolic process” (GO: 0006520, p = 6.75e-05) and “Regulation of cellular aa metabolic process” (GO: 0006521, p = 1.41e-07, clustering coefficient = 1), and “pentose biosynthesis process” (GO: 0019322, p = 0.000395, clustering coefficient = 1). Protein acronyms correspond to Gene Symbol (see Supplementary Table S2 for details).The interactome of differentiation phase is represented in Fig. 6B, and more relevant data from the network stats are provided in Supplementary information (Table S4).
Figure 10
Figure 10
Relative abundance of differentially expressed proteins and functional clusters related with muscle contraction and microtubule based process during the differentiation developmental stage (day 8 vs day 12) in a gilthead sea bream primary muscle cell culture. On the top, the network analysis of protein-protein interactions among proteins grouped into two functional categories, according to Gene Ontology enrichment analysis by GOEAST. In these networks, nodes are proteins, the thickness of the line indicate the degree of confidence prediction of the interaction, according to the STRING databases. On the bottom, the relative abundance of protein spots of each cluster are showed. Data are shown as mean ± SEM of % vol. Significant differences by t-test (p < 0.05). The average of local clustering coefficients were 1 for “Muscle contraction” (GO: 00069367, p = 3.85e-07) and for “Microtubule based process” (GO: 0007017). Protein acronyms correspond to Gene Symbol (see Supplementary Table S2 for details). The interactome of differentiation phase is represented in Fig. 6B, and more relevant data from the network stats are provided in Supplementary information (Table S4).

Similar articles

Cited by

References

    1. Weatherley AH, Gill HS, Lobo AF. Recruitment and maximal diameter of axial muscle fibres in teleost and their relationship to somatic growth and ultimate size. J. Fish Biol. 1988;33:851–859. doi: 10.1111/j.1095-8649.1988.tb05532.x. - DOI
    1. Johnston IA. Environment and plasticity of myogenesis in teleost fish. J. Exp. Biol. 2006;209:2249–2264. doi: 10.1242/jeb.02153. - DOI - PubMed
    1. Stickland NC. Growth and development of muscle fibres in the rainbow trout (Salmo gairdneri) J. Anat. 1983;137:323–333. - PMC - PubMed
    1. Alfei L, Bertoncello G, Gelosi E, Parvopassu F. A morphometric analysis of the spinal motor pool in relation to its target muscle during growth in the trout, Salmo gairdneri. J. Fish Biol. 1989;34:65–78. doi: 10.1111/j.1095-8649.1989.tb02958.x. - DOI
    1. Weatherley AH, Gill HS, Rogers SC. Growth Dynamics of muscle fibres, dry weight and condition in relation to somatic growth rate in yearling rainbow trout (Salmo gairdneri) Can. J. Zool. 1979;57:2385–2392. doi: 10.1139/z79-310. - DOI

Publication types