

Corneal epithelial thickness profile in dry-eye disease
- PMID: 31576026
- PMCID: PMC7182579
- DOI: 10.1038/s41433-019-0592-y
Corneal epithelial thickness profile in dry-eye disease
Abstract
Background/objectives: To characterize and evaluate the use of corneal epithelial profile maps generated by an ultrahigh-resolution optical coherence tomography (UHR-OCT) in the diagnosis and management of dry-eye disease (DED).
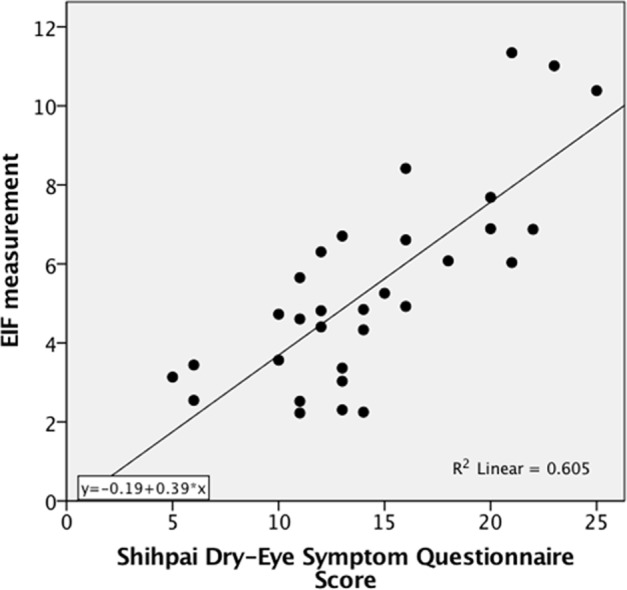
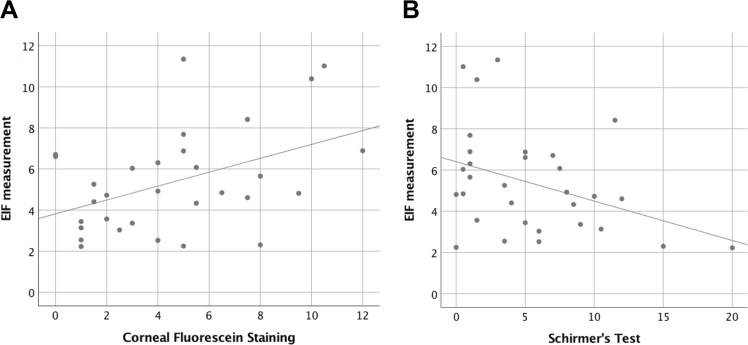
Subjects/methods: This prospective, interventional case-control study included 115 eyes of 71 subjects (52 DED and 19 controls) imaged using an UHR-OCT. Average, maximum, and minimum, range of corneal epithelial thicknesses were extracted from epithelial profile maps. Surface regularity was quantified using the range and variance of the epithelial thickness measured along a horizontal UHR-OCT scan. The variance of thickness measurements along a scan was named epithelial irregularity factor (EIF). Symptoms of 31 DED patients (55 eyes) were quantified by questionnaire and correlated to epithelial profile findings, fluorescein staining, tear breakup time, and Schirmer's test. Twenty-one DED eyes were administered autologous serum drops and follow-up UHR-OCT images were captured.
Results: DED patients had a highly irregular corneal epithelial surface compared with controls. Epithelial thickness profile variance (EIF) and range were significantly higher in DED as compared with controls (5.79 vs. 0.77, p < 0.001 and 7.6 vs. 4.6 μm, p < 0.001). Both parameters were highly significantly correlated with questionnaire scores (EIF: r = 0.778; p < 0.001, range: r = 0.737; p < 0.001). Follow-up showed a statistically significant reduction in epithelial thickness profile variance and range of treated patients ( p < 0.001).
Conclusions: DED patients have irregular epithelial surface that can be quantified using UHR-OCT generated CEP maps. Epithelial thickness profile range and EIF correlate accurately with patients' symptoms and could be used to follow-up patients and response to treatment.
Conflict of interest statement
VLP is a consultant of Alcon Ltd. MAS and VLP are equity holders and sit on the Board of Directors for Resolve Ophthalmics, LLC. They are co-inventor of intellectual property licensed to Resolve Ophthalmics. PCT/US2018/013409, and US Patent No 8992023. VLP, MAS, and JW are co-inventor of Non-Provisional United States Patent Application No.: 61809518.
Figures


References
Publication types
MeSH terms
Grants and funding
LinkOut - more resources
Full Text Sources
