. 2019 Dec;87(12):1128-1140.
doi: 10.1002/prot.25817. Epub 2019 Oct 23.

Cryo-electron microscopy targets in CASP13: Overview and evaluation of results

Affiliations

Cryo-electron microscopy targets in CASP13: Overview and evaluation of results

Andriy Kryshtafovych et al. Proteins. 2019 Dec.

Abstract

Structures of seven CASP13 targets were determined using cryo-electron microscopy (cryo-EM) technique with resolution between 3.0 and 4.0 Å. We provide an overview of the experimentally derived structures and describe results of the numerical evaluation of the submitted models. The evaluation is carried out by comparing coordinates of models to those of reference structures (CASP-style evaluation), as well as checking goodness-of-fit of modeled structures to the cryo-EM density maps. The performance of contributing research groups in the CASP-style evaluation is measured in terms of backbone accuracy, all-atom local geometry and similarity of inter-subunit interfaces. The results on the cryo-EM targets are compared with those on the whole set of eighty CASP13 targets. A posteriori refinement of the best models in their corresponding cryo-EM density maps resulted in structures that are very close to the reference structure, including some regions with better fit to the density.

Keywords: CASP; cryo-EM; electron microscopy; model evaluation; protein structure prediction.


Figures

Figure 1.
Figure 1.
Relative performance of CASP13 groups in predicting tertiary structure of cryo-EM targets. Data are shown for top 12 groups on (A) 15 TBM domains and (B) 6 FM EUs. Cumulative Zscores are calculated according to formulas (2) and (3) (see Materials and Methods) for TBM and FM targets, correspondingly. Blue and orange bars show the ranking scores calculated on first models (M1) and best results (best), correspondingly. Groups are sorted according to the first model scores (blue bars).
Figure 2.
Figure 2.
Relative performance of CASP13 and CAPRI groups in predicting quaternary structure of cryo-EM targets. Data are shown for (A) top 12 CASP13 groups for all six oligomeric cryo-EM targets and (B) CASP13 and CAPRI groups on four CASP/CAPRI oligomeric targets. Cumulative Zscores are calculated according to formula (4) (see Materials and Methods). Blue and orange bars show the ranking scores calculated on first models (M1) and best results (best), respectively. Groups are sorted according to the best scores (orange bars). CAPRI groups in panel B are marked with an asterisk.
Figure 3.
Figure 3.
Correlation between model-to-map goodness-of-fit scores based on models submitted for all seven CASP13 cryo-EM targets. The under-the-diagonal part of the table shows Spearman correlation coefficients between each pair of scores. The correlation scores are visualized in the upper portion of the table with color and shape (deeper colors and thinner ovals relate to higher correlations). Diagonal cells (shaded) show average correlation versus all other scores.
Figure 4.
Figure 4.
The global model-to-map fit_score (Eq. 5) versus assembly_score (Eq. 6) for CASP13 models submitted for three cryo-EM targets. Each point corresponds to a model. Linear trend lines are threaded through the data. The value of the coefficient of determination R2 is provided on the graphs.
Figure 5.
Figure 5.
Local model-to-map goodness-of-fit scores of the highest-scoring chain in the reference structure (solid blue line) and the highest-scoring CASP model (dashed blue line) versus the local consensus score of all CASP models (red line) for three of the cryo-EM targets. Score values for red lines are provided on the left of the plot, and for blue lines – on the right. The goodness-of-fit score is represented by the local SMOCf score (the higher the better). The inter-model consensus score (the lower the better) is represented by the interquartile range of Cα-Cα distances (in Ångstroms) between corresponding residues in top 100 models according to the GDT_TS score, after their optimal superposition. The best-fitting models for the shown targets are:T0984TS329_1o, T0995TS368_5o and T1020TS004_2o (see http://predictioncenter.org/casp13/cryoem_results.cgi).
Figure 6.
Figure 6.
The best CASP13 model (TS004_2o) for target T1020o fitted in the corresponding density map. (A) The best model colored according to the local SMOCf score (scale bar at the left). The region marked by a circle is zoomed-in in panel (B); the region marked by a rectangle is enlarged in panels (C) and (D), from slightly different spatial perspectives. (B) The hydrophobic residues at the trimer interface within the cryo-EM map. (C) Loops 475-478 and 220-230 within the density. (C) Helix 479-511 within the density. In panels (B), (C) and (D), the best model is colored according to the SMOCf score (red representing bad fit and blue representing good fit), and the reference structure is shown in green.
Figure 7.
Figure 7.
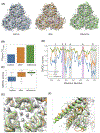
Assessment of the best-fitting model (TS004_2o) for target T1020o before and after PHENIX refinement in the cryo-EM map. Blue color in all panels correspond to the unrefined model, orange to the refined one, and green to the reference structure. (A) The original model (left), the refined model (middle) and the reference structure (right) fitted into the cryo-EM map. Regions that are encircled and numbered in the refined model (middle) correspond to the numbered regions in panel D. (B) Global CCmask score for the unrefined model, refined model, and experimentally-derived structure. (C) Boxplots of per-residue SMOCf scores for chain A in the unrefined model, refined model, and target. (D) Per-residue SMOCf scores for chain A in the unrefined model, refined model, and target. Shaded strips show most notable areas of fit improvement. The pink-shaded strips (#2 and 5) mark areas that improved beyond the target structure fit, while the grey-shaded strips (#1, 3, 4 and 6) mark those that improved significantly, but remain still worse than the corresponding areas in the target structure. Plots for other chains are very similar and shown in Figure S4. (E) A region of the refined model that has improved over the reference structure. An intra-chain hydrogen bond between the side- chains of D422 and W414 in the refined best-fitting model is indicated for chain C. (F) Regions in the refined model that are poorly fit to density even after the real-space refinement.
Figure 8.
Figure 8.
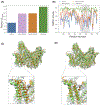
Assessment of the best-fitting model (TS329_1o) for target T0984o before and after refinement in the cryo-EM map using Flex-EM and PHENIX. (A) Global CCmask score for the unrefined model (blue), refined model with PHENIX only (pink), refined model with Flex-EM and PHENIX (orange), and the experimentally-derived reference structure (green). (B) Average SMOCf scores for chain A of the best-fitting model before refinement (blue), after PHENIX-only refinement (pink), after Flex-EM and PHENIX refinement (orange), and for the reference structure (green). The region corresponding to residues 419-559 is shown in gray shade. (C) The fit of the model after PHENIX-only refinement (orange) and the reference structure (green) in the cryo-EM map. The zoomed panel shows residues 419-559, which are outside of the density after refinement. (D) The fit of the model after Flex-EM refinement followed by PHENIX refinement (orange) and the reference structure (green) in the cryo-EM map. Region 419-559 is better fit to the density if Flex-EM refinement is applied first.
Figure 9.
Figure 9.
Improvement in model accuracy as quantified by the multimeric GDT_TSo score and monomeric GDT_TS, CADss, LDDT scores for the best-fitting CASP13 models before (grey) and after (black) refinement in the cryo-EM map. For uniformity of the graph scale, the GDT_TS scores are presented as fractions rather than percentages (i.e., are divided by 100).

References

    1. Lensink MF, Wodak SJ. CAPRI Evaluation in CASP13. Proteins 2019;This issue.
    1. Guzenko D, Monastyrskyy B, Kryshtafovych A, Duarte J. CASP13 assembly evaluation paper. Proteins 2019;This issue. - PMC - PubMed
    1. Kinch L, Monastyrskyy B, Kryshtafovych A. CASP13 domain definition and classification. Proteins 2019;This issue. - PMC - PubMed
    1. Kryshtafovych A, Monastyrskyy B, Schwede T, Topf M, Moult J, Fidelis K. CASP evaluation measures. Proteins 2019;This issue.
    1. Olechnovic K, Monastyrskyy B, Kryshtafovych A, Venclovas C. Comparative analysis of methods for evaluation of protein models against native structures. Bioinformatics 2018. - PMC - PubMed

Publication types