. 2019 Nov 15;294(46):17314-17325.
doi: 10.1074/jbc.RA119.010217. Epub 2019 Oct 2.

Dilated cardiomyopathy mutation in the converter domain of human cardiac myosin alters motor activity and response to omecamtiv mecarbil

Affiliations

Dilated cardiomyopathy mutation in the converter domain of human cardiac myosin alters motor activity and response to omecamtiv mecarbil

Wanjian Tang et al. J Biol Chem. .

Abstract

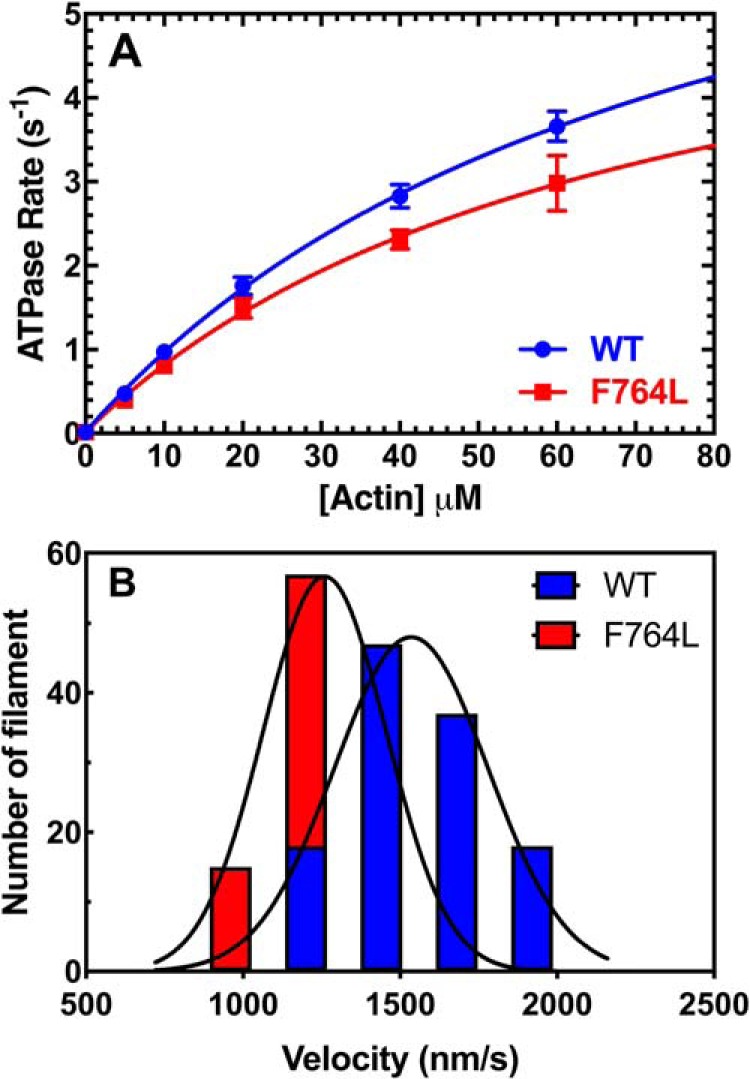
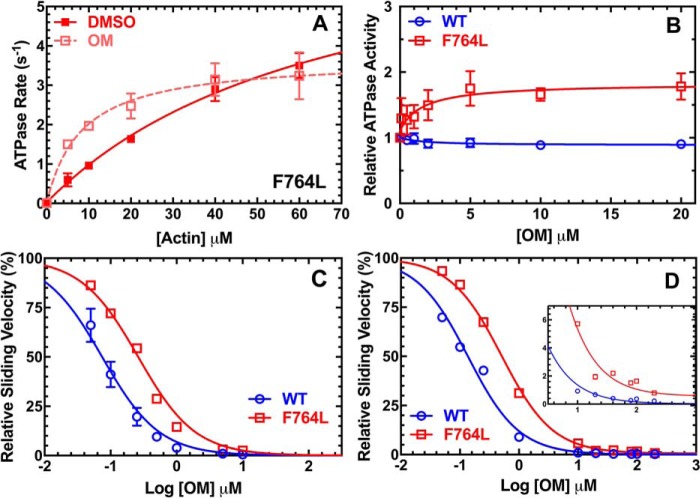
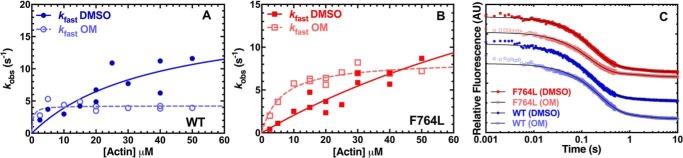
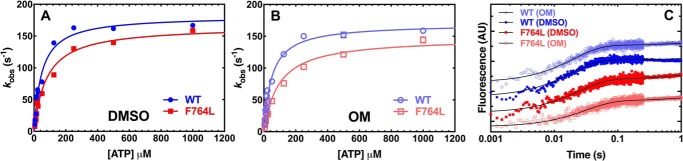
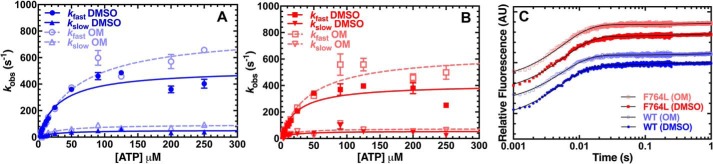
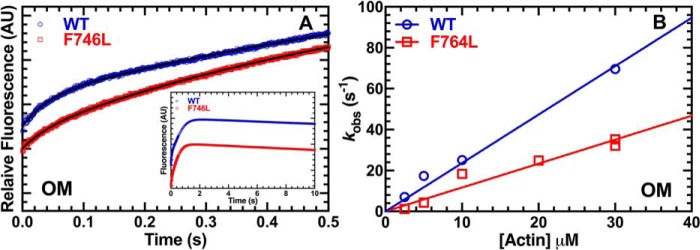
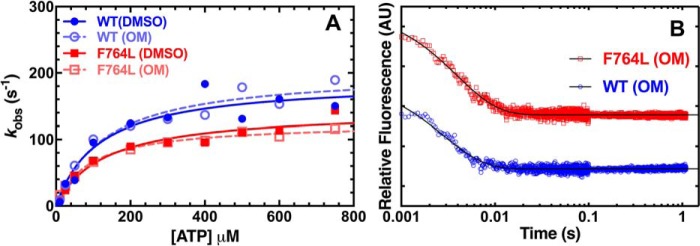
We investigated a dilated cardiomyopathy (DCM) mutation (F764L) in human β-cardiac myosin by determining its motor properties in the presence and absence of the heart failure drug omecamtive mecarbil (OM). The mutation is located in the converter domain, a key region of communication between the catalytic motor and lever arm in myosins, and is nearby but not directly in the OM-binding site. We expressed and purified human β-cardiac myosin subfragment 1 (M2β-S1) containing the F764L mutation, and compared it to WT with in vitro motility as well as steady-state and transient kinetics measurements. In the absence of OM we demonstrate that the F764L mutation does not significantly change maximum actin-activated ATPase activity but slows actin sliding velocity (15%) and the actomyosin ADP release rate constant (25%). The transient kinetic analysis without OM demonstrates that F764L has a similar duty ratio as WT in unloaded conditions. OM is known to enhance force generation in cardiac muscle while it inhibits the myosin power stroke and enhances actin-attachment duration. We found that OM has a reduced impact on F764L ATPase and sliding velocity compared with WT. Specifically, the EC50 for OM induced inhibition of in vitro motility was 3-fold weaker in F764L. Also, OM reduces maximum actin-activated ATPase 2-fold in F764L, compared with 4-fold with WT. Overall, our results suggest that F764L attenuates the impact of OM on actin-attachment duration and/or the power stroke. Our work highlights the importance of mutation-specific considerations when pursuing small molecule therapies for cardiomyopathies.

Keywords: actin; cardiomyopathy; enzyme kinetics; heart failure; myosin; omecamtiv mecarbil.


Conflict of interest statement

The authors declare that they have no conflicts of interest with the contents of this article

Figures

Scheme 1.
Scheme 1.
Scheme of myosin ATPase cycle.
Figure 1.
Figure 1.
Steady-state ATPase and in vitro motility. A, the actin-activated ATPase activity of purified M2β-S1 WT and F764L in MOPS 20 buffer at 25 °C was determined as a function of actin concentration. The data at each actin concentration represents the average ± S.E. from 5 to 6 separate preparations. B, the sliding velocity of M2β-S1 WT and F764L in MOPS 20 buffer was analyzed manually via ImageJ. 120 filaments from 4 different protein preparations (30 filaments from each, 0.24–0.4 μm M2β-S1 loading concentration) were pooled together and fit to the Gaussian function. The average velocity is 1547 ± 19 nm/s for WT, and 1300 ± 17 nm/s for F764L.
Figure 2.
Figure 2.
Impact of OM on steady-state motor properties. A, the actin-activated ATPase of purified M2β-S1 F764L in the presence of 0.1% DMSO or 10 μm OM. The data at each actin concentration represents the average ± S.D. from three separate preparations. B, the ATPase activity of purified M2β-S1 WT and F764L was determined as a function of OM concentration at 20 μm actin. Traces were fit to a dose-response curve to determine the EC50. The data at each OM concentration represents the average ± S.E. of three separate preparations. C, in vitro motility was performed in the presence of varying concentrations of OM (0–10 μm in 0.1% DMSO) to determine the EC50 with 0.4 μm M2β-S1 WT or F764L. The relative velocities of M2β-S1 WT and F764L are normalized to the velocities at 0 μm OM from three separate preparations (90 filaments). Error bars represent mean ± S.E. D, in vitro motility was performed in the presence of varying concentrations of OM (0–200 μm in 1% DMSO). Relative velocities of M2β-S1 WT or F764 were normalized to the velocities at 0 μm OM from two different protein preparations. Inset highlights the difference in velocity at high OM concentrations (velocity at 200 μm OM: WT, 4.4 ± 0.2 nm/s; F764L, 12.8 ± 0.6 nm/s). Error bars represent mean ± S.E. In the OM titration experiments shown in C and D, additional KCl was added to the activation buffer to bring it to 100 mm KCl.
Figure 3.
Figure 3.
Single turnover measurements. Single turnover sequential mix stopped-flow experiments were performed by mixing 0.25 μm M2β-S1 with 0.2 μm mant-ATP, aged for 10 s, and then mixed with varying concentrations of actin (2.5–50 μm) in the presence of 0.1% DMSO or 10 μm OM. Data were collected from 3 to 4 different protein preparations. The fast phase of the fluorescence transients was plotted as a function of actin concentration and fit to a hyperbolic function for WT (A) and F764L (B). C, representative fluorescence transients in the presence of 40 μm actin (average of 2–3 transients) fit to a two-exponential function (values for the fast phase rate constant and relative amplitude for WT DMSO, k = 6.24 ± 0.03 s−1; A = 0.90; WT OM, k = 4.23 ± 0.03 s−1; A = 0.90; F764L DMSO, k = 5.68 ± 0.02 s−1, A = 0.89; F764L OM, k = 6.91 ± 0.03 s−1, A = 0.91).
Figure 4.
Figure 4.
ATP binding and hydrolysis. Tryptophan fluorescence enhancement was used to monitor ATP binding/hydrolysis by mixing 1 μm M2β-S1 WT or F764L with varying concentrations of ATP. The fluorescence transients were fit to a two-exponential function. The observed fast phase was plotted as a function of ATP concentration and fit to a hyperbolic function to determine maximum rate of ATP hydrolysis and apparent affinity for ATP in the presence of 0.1% DMSO (A) or 10 μm OM (B). C, representative fluorescence transients (average of 2 transients) in the presence of 25 μm ATP are shown fit to a two-exponential function (values for the fast phase rate constant and relative amplitude for WT DMSO, k = 61.95 ± 0.86 s−1; A = 0.86; WT OM, k = 47.20 ± 0.78 s−1; A = 0.92; F764L DMSO, k = 39.7 ± 0.69 s−1, A = 0.83; F764L OM, k = 27.98 ± 0.60 s−1, A = 0.82).
Figure 5.
Figure 5.
ATP binding to acto-myosin. ATP-induced dissociation from pyrene actin was performed by mixing a complex of M2β-S1:pyrene actin (0.375 μm M2β-S1 and pyrene actin) with a series of ATP concentration (4 to 250 μm). The fluorescence transients were fit to a two-exponential function at all ATP concentrations. The observed fast rate constant was hyperbolically dependent on ATP concentrations in the presence of 0.1% DMSO (A) or 10 μm OM (B). C, representative fluorescence transients in the presence of 25 μm ATP (average of 2 transients) were fit to a two-exponential function (values for the fast phase rate constant and relative amplitude for WT DMSO, k = 222.6 ± 5.0 s−1; A = 0.92; WT OM, k = 213.2 ± 7.3 s−1; A = 0.94; F764L DMSO, k = 207.1 ± 4.8 s−1, A = 0.91; F764L OM, k = 232 ± 8.8 s−1, A = 0.88).
Figure 6.
Figure 6.
Actin-activated phosphate release. The actin-activated phosphate release rate constants in the presence of OM were examined by mixing M2β-S1 (0.225–1 μm) with substoichiometric ATP, aged for 10 s, and mixed with varying actin concentrations. A, the MDCC-PBP fluorescence transients (average of 2–3 transients) in 10 μm actin were fit to a two-exponential function (values for the fast phase rate constant and amplitude for WT, k = 25.1 ± 0.9 s−1, A = 0.32 ± 0.01; and F764L, k = 18.4 ± 0.8 s−1, A = 0.21 ± 0.01) (inset shows the entire time course). B, the rate constant of the fast phase of the fluorescence transients were plot as a function of actin concentration and fit to a linear relationship to compare actin-activated phosphate release in F764L and WT in the presence of OM. The phosphate release rate constants (WT versus F764L) were also measured in the presence of a single actin concentration (30 μm) in the absence of OM (see Table 3).
Figure 7.
Figure 7.
ADP release from acto-myosin. A, the ADP release rate constant was examined by mixing pyrene actomyosin·ADP (0.225 μm M2β-S1 and pyrene actin, 50 μm ADP) with varying ATP concentrations (10 to 750 μm) in the presence of 0.1% DMSO or 10 μm OM. Fluorescent transients were fit to a single exponential function. The rate constants were fit to hyperbolic function (kobs = k+D/(1 + Kapp/[ATP])) to determine the ADP release rate constant (k+D). B, the ADP release rate constant was also examined with mant-labeled ADP by mixing a complex of 0.5 μm M2β-S1, 1 μm actin, and 10 μm mant-ADP with 1 mm ATP. Representative fluorescence transients of mant-ADP release from actomyosin (average of 5 transients) fit to a single exponential function are shown (rate constant and amplitude at each condition; WT DMSO, k = 347.4 ± 7.6 s−1, A = 0.38; WT OM, k = 348.9 ± 6.1 s−1, A = 0.45; F764L DMSO, k = 232.1 ± 3.2 s−1, A = 0.51; F764L OM, k = 251.6 ± 3.0 s−1, A = 0.53).
Figure 8.
Figure 8.
Structure of M2β-sS1 (PDB ID 5N69) highlighting the Phe-764 residue and OM-binding site. A, Phe-764 (F764) (green) is located at the interface of the relay helix (red) and converter domain (blue). B, F764 is involved in forming a hydrophobic interaction at the relay helix/converter domain interface. C, location of F764 in the M2β-sS1 OM-bound state. OM is shown in cyan, residues involved in direct OM binding interaction are shown in orange (27).

References

    1. Watkins H., Ashrafian H., and Redwood C. (2011) Inherited cardiomyopathies. N. Engl. J. Med. 364, 1643–1656 10.1056/NEJMra0902923 - DOI - PubMed
    1. McNally E. M., and Mestroni L. (2017) Dilated cardiomyopathy: genetic determinants and mechanisms. Circ. Res. 121, 731–748 10.1161/CIRCRESAHA.116.309396 - DOI - PMC - PubMed
    1. Harvey P. A., and Leinwand L. A. (2011) Cellular mechanisms of cardiomyopathy. J. Cell Biol. 194, 355–365 10.1083/jcb.201101100 - DOI - PMC - PubMed
    1. Maron B. J., Ommen S. R., Semsarian C., Spirito P., Olivotto I., and Maron M. S. (2014) Hypertrophic cardiomyopathy. J. Am. Coll. Cardiol. 64, 83–99 10.1016/j.jacc.2014.05.003 - DOI - PubMed
    1. Hershberger R. E., Hedges D. J., and Morales A. (2013) Dilated cardiomyopathy: the complexity of a diverse genetic architecture. Nat. Rev. Cardiol. 10, 531–547 10.1038/nrcardio.2013.105 - DOI - PubMed

Publication types

MeSH terms

Associated data