. 2019 Oct 2;9(1):14215.
doi: 10.1038/s41598-019-50794-w.

Acquisition of a side population fraction augments malignant phenotype in ovarian cancer

Affiliations

Acquisition of a side population fraction augments malignant phenotype in ovarian cancer

Koji Yamanoi et al. Sci Rep. .

Abstract

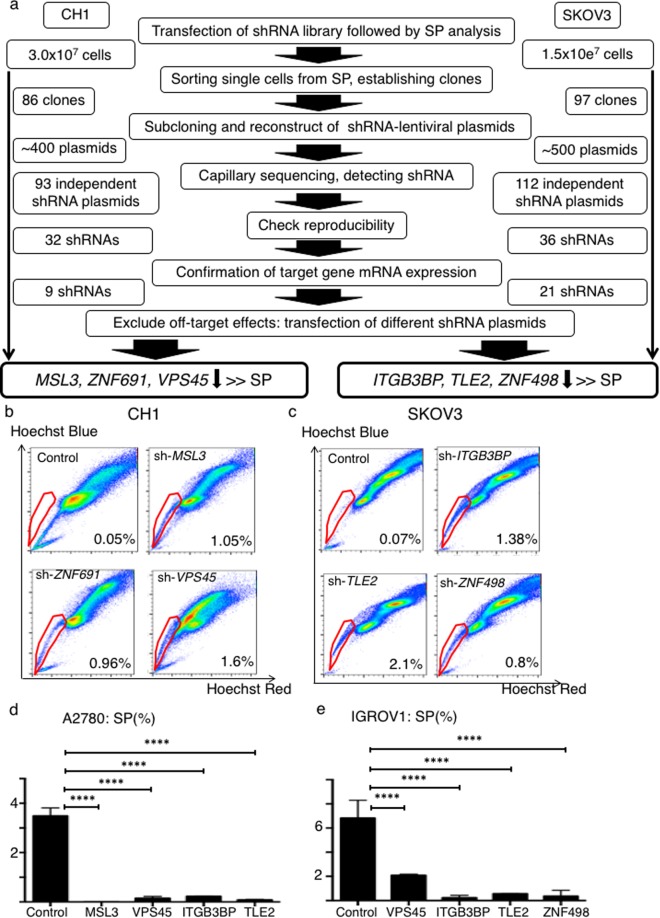
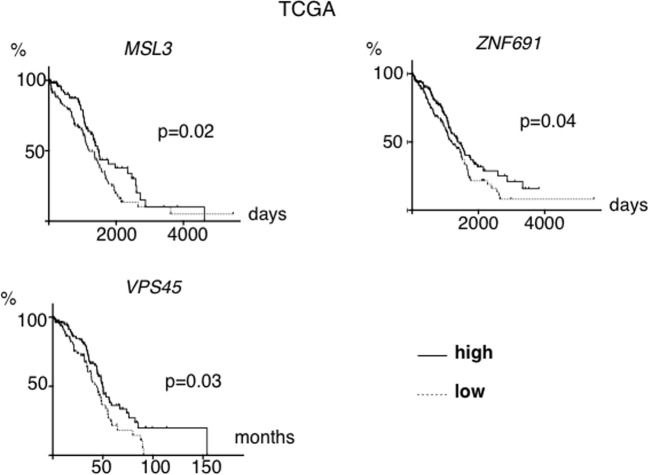
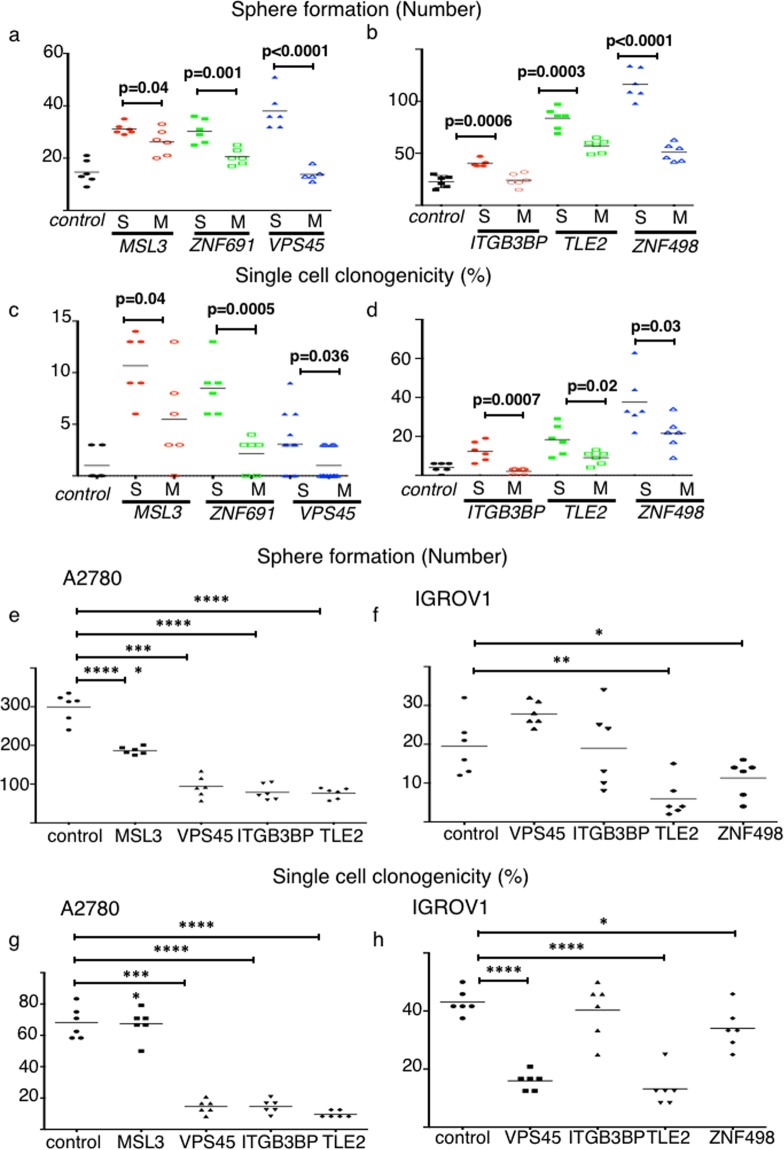
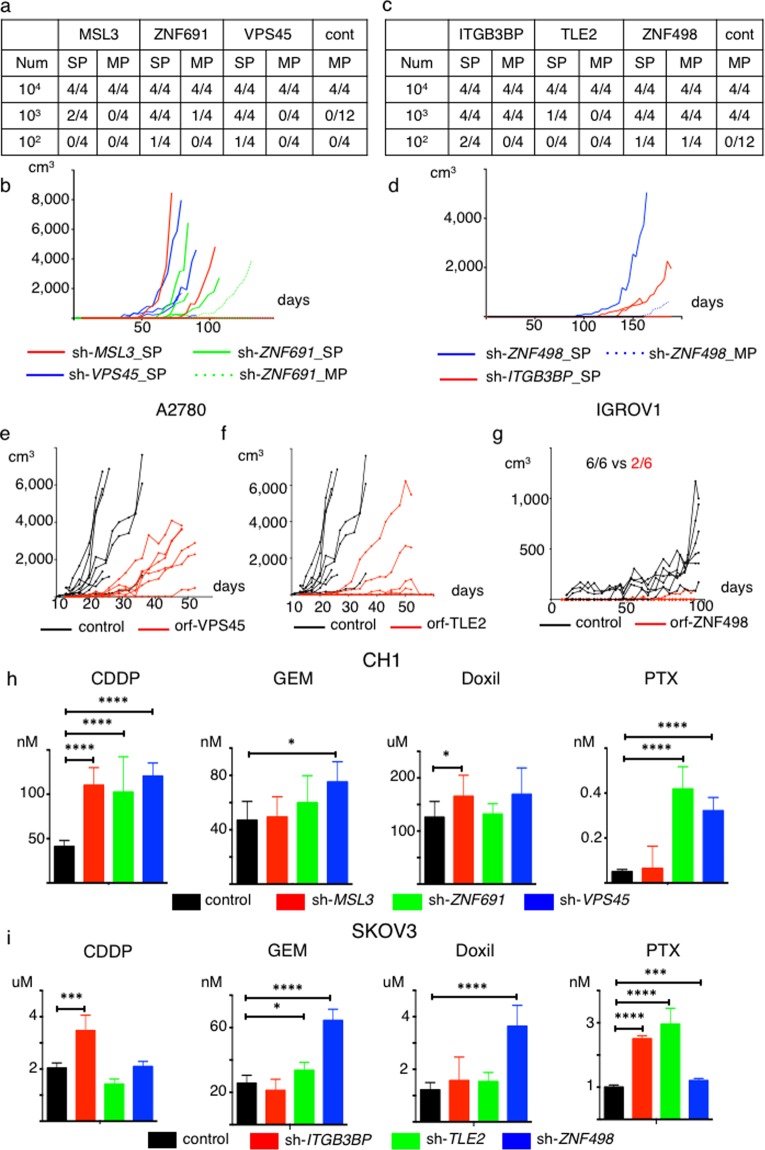
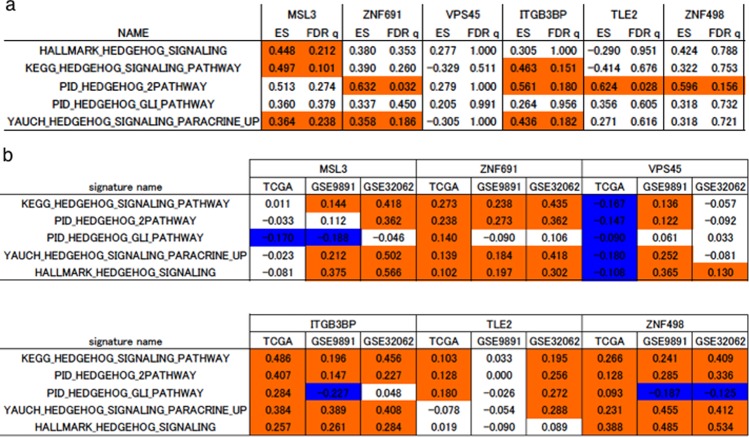
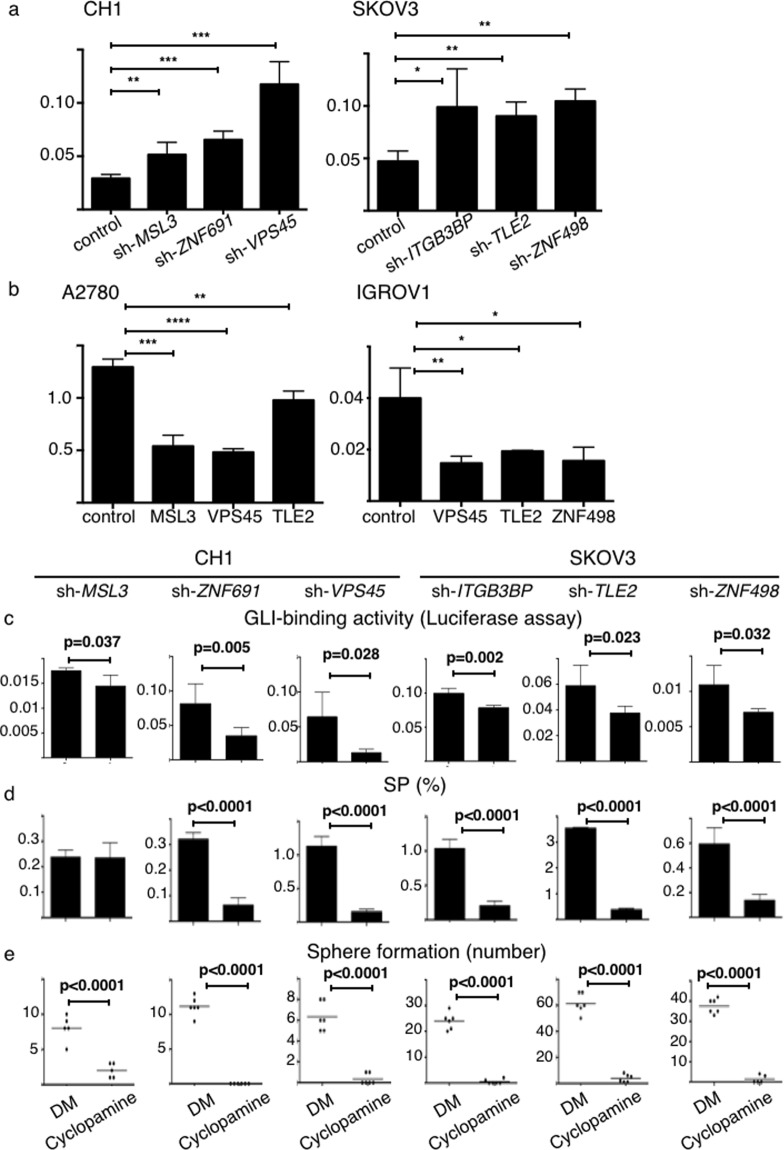
Side population (SP) cells harbor malignant phenotypes in cancer. The aim of this study was to identify genes that modulate the proportion of ovarian cancer SP cells. Using a shRNA library targeting 15,000 genes, a functional genomics screen was performed to identify genes whose suppression increased the SP percentage. The biological effects caused by alteration of those identified genes were investigated in vitro and in vivo. We found that suppression of MSL3, ZNF691, VPS45, ITGB3BP, TLE2, and ZNF498 increased the proportion of SP cells. Newly generated SP cells exhibit greater capacity for sphere formation, single cell clonogenicity, and in vivo tumorigenicity. On the contrary, overexpression of MSL3, VPS45, ITGB3BP, TLE2, and ZNF498 decreased the proportion of SP cells, sphere formation capacity and single cell clonogenicity. In ovarian cancer cases, low expression of MSL3, ZNF691 and VPS45 was related to poor prognosis. Suppression of these six genes enhanced activity of the hedgehog pathway. Cyclopamine, a hedgehog pathway inhibitor, significantly decreased the number of SP cells and their sphere forming ability. Our results provide new information regarding molecular mechanisms favoring SP cells and suggest that Hedgehog signaling may provide a viable target for ovarian cancer.


Conflict of interest statement

Dr. Koji Yamanoi and Prof. Noriomi Matsumura receives research support from commercial research grant, Daiichi Sankyo TaNeDS. The terms of this arrangement have been reviewed and approves by the Kyoto University in accordance with its policy on objectivity in research. No potential competing financial and non-financial interests was disclosed by the other authors.

Figures

Figure 1
Figure 1
Schematic of functional genomics screening. (a) Ovarian cancer cell lines, CH1 and SKOV3 were used. Following transfection of the shRNA library, we performed SP analysis and SP cells were singly plated into each well of 96-well plates. We established 86 clones in the CH1 screen and 97 clones in the SKOV3 screen. shRNAs were amplified by PCR and we reconstructed 93 different shRNA plasmids from the CH1 screen and 115 different shRNA plasmids from the SKOV3 screen. Out of 97 shRNAs in CH1 cells, 32 again markedly increased the SP fraction. Out of 115 shRNAs in SKOV3 cells, 36 again markedly increased the SP fraction. We measured mRNA expression of these 32 and 36 genes using RT-PCR, and found that 9 shRNAs in CH1 suppressed their target gene’s mRNA expression and 21 shRNAs in SKOV3 suppressed their target gene’s mRNA expression. We transfected shRNAs containing completely different anti-sequence than those initially used for each gene and performed SP analysis and RT-PCR to exclude off target effects. We identified MSL3, ZNF691 and VPS45, whose downregulation markedly increased the SP fraction of CH1 cells and ITGB3BP, TLE2 and ZNF498 whose downregulation markedly increased the SP fraction of SKOV3 cells. (b) Representative data showing the percentage of the SP fraction of control, sh-MSL3, sh-ZNF691 and sh-VPS45 CH1 cells. (c) Representative data showing the percentage of the SP fraction of control, sh-ITGB3BP, sh-TLE2 and sh-ZNF498 SKOV3 cells. (d) SP fraction percentage of A2780-control, orf-MSL3, orf-VPS45, orf-ITGB3BP and orf-TLE2. ****p < 0.0001. (e) SP fraction percentage of IGROV1-control, orf-VPS45, orf-ITGB3BP, orf-TLE2 and orf-ZNF498. ****p < 0.0001
Figure 2
Figure 2
Overall survival based on mRNA expression of MSL3, ZNF691 and VPS45 in clinical samples. TCGA cases were analyzed. Differences in survival based on MSL3, ZNF691 and VPS45 mRNA expression are shown. The low expression group consisted of 100 cases with the lowest levels of expression while the high expression group consisted of 100 cases with the highest levels of expression.
Figure 3
Figure 3
Six genes regulate cancer stem cell (CSC) phenotypes as well as the SP fraction. Sphere formation and single cell clonogenicity were assessed. (ad) Newly generated SP cells harbor a CSC phenotype. (a,b) Sphere forming ability. Data from CH1-shcontrol and sh-target gene cells are shown in Fig. 3a; data from SKOV3-shcontrol and sh-target gene cells are shown in Fig. 3b. The number represents spheres larger than 200 µm (n = 6 replicates). (c,d) Single cell clonogenicity. Expanded clone colonies were counted and the proportion of cells capable of colony formation was calculated (n = 6 replicates). Data from CH1-shcontrol and sh-target gene cells are shown in Fig. 3c; data from SKOV3-shcontrol and sh-target gene cells are shown in Fig. 3d. (eh) Overexpression of MSL3, VPS45, ITGB3BP, TLE2, ZNF498 decreased sphere formation and single cell clonogenicity. (e,f) Sphere formation. Data from A2780-control and ORF-target gene cells are shown in Fig. 3e. Data from IGROV1-control and ORF-target gene cells are shown in Fig. 3f. The number of spheres larger than 200 µm is depicted. *p < 0.05, **p < 0.01, ***p < 0.001, ****p < 0.0001. (g,h) Single cell clonogenicity. Expanded clones were counted and the proportion of cells capable of colony formation was calculated. Data from A2780-control and ORF-target gene cells are shown in Fig. 3g. Data from IGROV1-control and ORF-target gene cells are shown in Fig. 3h. *p < 0.05, **p < 0.01, ***p < 0.001, ****p < 0.0001.
Figure 4
Figure 4
Target genes regulate tumor initiating ability and in vivo tumor proliferation, and suppression of six genes enhances resistance to chemotherapeutic agents. (a,b) Newly generated SP cells exhibit greater tumor initiating capability than do MP cells and control cells. Data from CH1-control, SP and MP cells derived from CH1 sh-target gene cells are shown. Num; Number, cont; control-MP. (a) Limiting dilution assay results. (b) Tumor growth curves generated from injection of 1 × 103 indicated cells. (c,d) Newly generated SP cells exhibit greater tumor initiating capability than do MP cells and control cells. Data showing tumor initiating ability for SKOV3-control, SP and MP derived from SKOV3 sh-target gene cells are shown. Num; Number, cont; control-MP. (c) Limiting dilution assays. (d) Tumor growth curves generated from injection of 1 × 102 indicated cells. (eg) Overexpression of VPS45, TLE2, ZNF498 decreases in vivo tumor proliferation. (e) Tumor growth curves generated from injection of 1 × 105 A2780 control or ORF-VPS45 cells. (f) Tumor growth curves generated from injection of 1 × 105 A2780 control or ORF-TLE2 cells. (g) Tumor growth curves generated from injection of 1 × 106 IGROV1 control or ORF-ZNF498 cells. (h,i) Suppression of six genes enhances resistance to chemotherapeutic agents. *p < 0.05, **p < 0.01, ***p < 0.001, ****p < 0.0001. (h) IC50 values for CH1-control, sh-MSL3, sh-ZNF691 and sh-VPS45 cells treated with Cisplatin (CDDP), Gemcitabine (GEM), doxorubicin (Doxil) and paclitaxel (PTX). (i) IC50 values for SKOV3-control, sh-ITGB3BP, sh-TLE2 and sh-ZNF498 cells treated with CDDP, Gemcitabine (GEM), doxorubicin (Doxil) and paclitaxel (PTX).
Figure 5
Figure 5
Strong relationships between the hedgehog pathway and six target genes are found. GSEA and ssGSEA analysis showing the relationships between the hedgehog pathway and six target genes. GSE32062 contains 260 patients with ovarian cancer. GSE9891 contain 285 patients with ovarian cancer. (a) Results of GSEA analysis. Enrichment score (ES) and FDR q value (FDR q) are shown. Red shading indicates significant enrichment for sh-target genes at an FDR q < 0.25. (b) Results of correlation analysis between the scores of the six gene signature and the hedgehog pathway-related signature. Red shading indicates a significant positive correlation (p < 0.05) and blue shading indicates a significant negative correlation (p < 0.05).
Figure 6
Figure 6
Six genes regulate CSC-like functions via the Hedgehog pathway. DM; DMSO. *p < 0.05, **p < 0.01, ***p < 0.001, ****p < 0.0001. (a,b) GLI-binding activity measured using a luciferase reporter assay. Relative luciferase activities (y-axis) are shown (n = 4). (a) Suppression of the six genes significantly increases GLI-binding activity compared to control cells. (b) Overexpression of sMDL3, VPS45, TLE2 and ZNF498 significantly decrease GLI-binding activity (y-axis) compared to control cells. (c) Cyclopamine inhibits GLI-binding activity, measured using a luciferase reporter assay. (d) Cyclopamine decreases the SP, with the exception of SP cells derived from suppression of MSL3. (e) Cyclopamine decreases sphere forming capacity of SP cells derived from suppression of six genes.

Similar articles

Cited by

References

    1. Coleman RL, Monk BJ, Sood AK, Herzog TJ. Latest research and treatment of advanced-stage epithelial ovarian cancer. Nat Rev Clin Oncol. 2013;10:211–224. doi: 10.1038/nrclinonc.2013.5. - DOI - PMC - PubMed
    1. Seidman JD, et al. The histologic type and stage distribution of ovarian carcinomas of surface epithelial origin. Int J Gynecol Pathol. 2004;23:41–44. doi: 10.1097/01.pgp.0000101080.35393.16. - DOI - PubMed
    1. Agarwal R, Kaye SB. Ovarian cancer: strategies for overcoming resistance to chemotherapy. Nat Rev Cancer. 2003;3:502–516. doi: 10.1038/nrc1123. - DOI - PubMed
    1. Köbel M, et al. Differences in tumor type in low-stage versus high-stage ovarian carcinomas. Int J Gynecol Pathol. 2010;29:203–211. doi: 10.1097/PGP.0b013e3181c042b6. - DOI - PubMed
    1. Winter WE, 3rd, et al. Prognostic factors for stage III epithelial ovarian cancer: a Gynecologic Oncology Group Study. J Clin Oncol. 2007;25:3621–3627. doi: 10.1200/JCO.2006.10.2517. - DOI - PubMed

MeSH terms