. 2019 Oct;574(7777):273-277.
doi: 10.1038/s41586-019-1618-0. Epub 2019 Oct 2.

Coordinated alterations in RNA splicing and epigenetic regulation drive leukaemogenesis

Affiliations

Coordinated alterations in RNA splicing and epigenetic regulation drive leukaemogenesis

Akihide Yoshimi et al. Nature. 2019 Oct.

Abstract

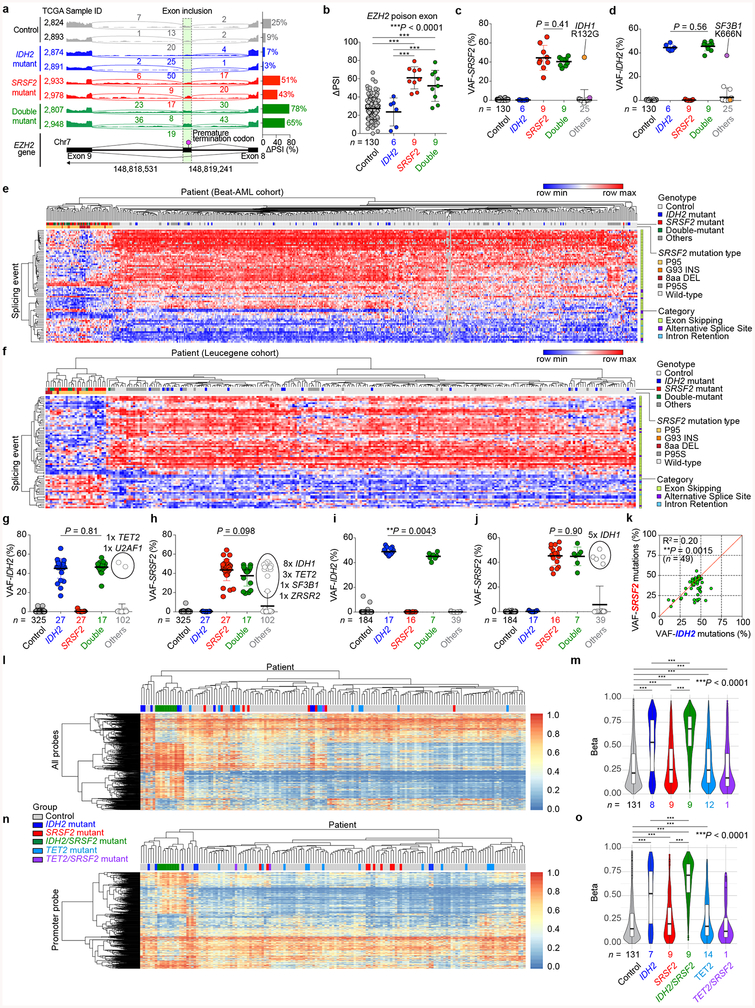
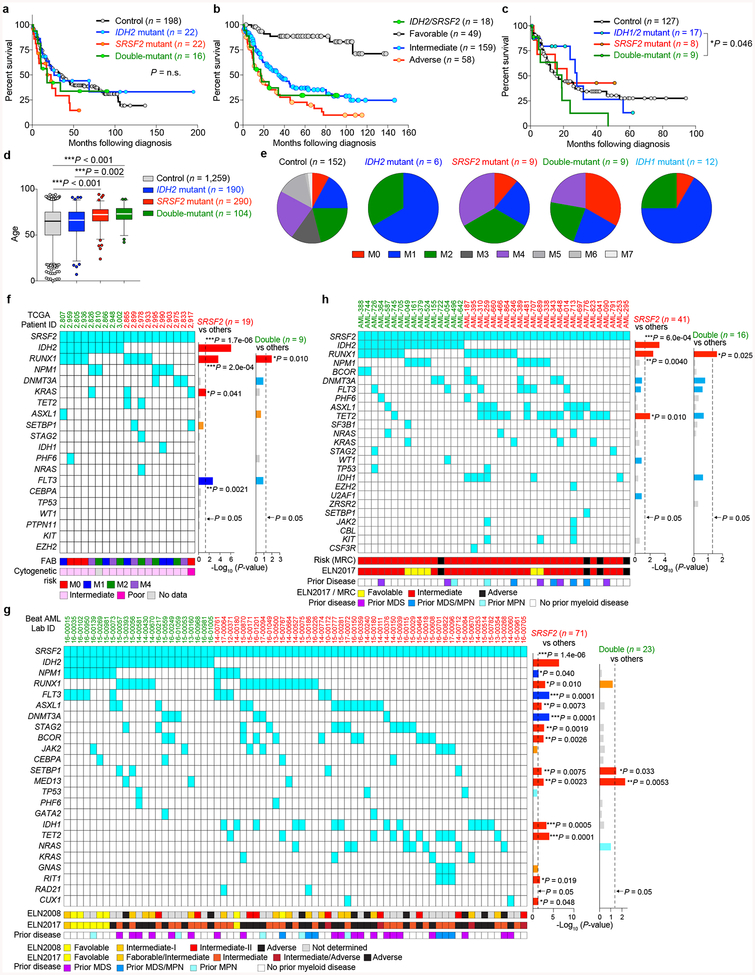
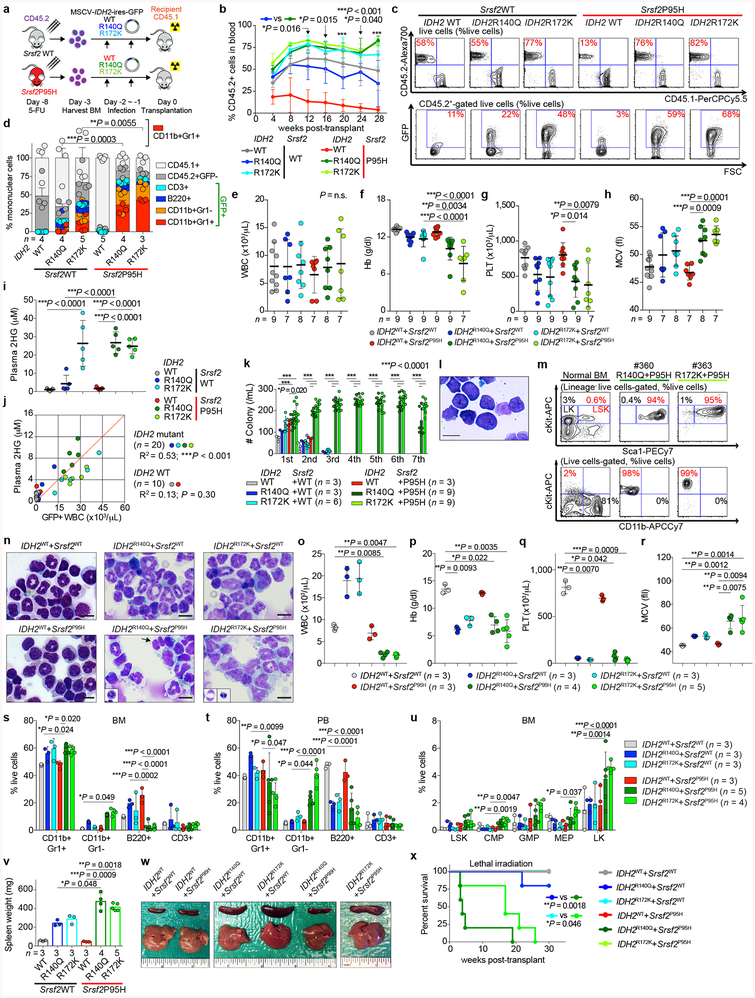
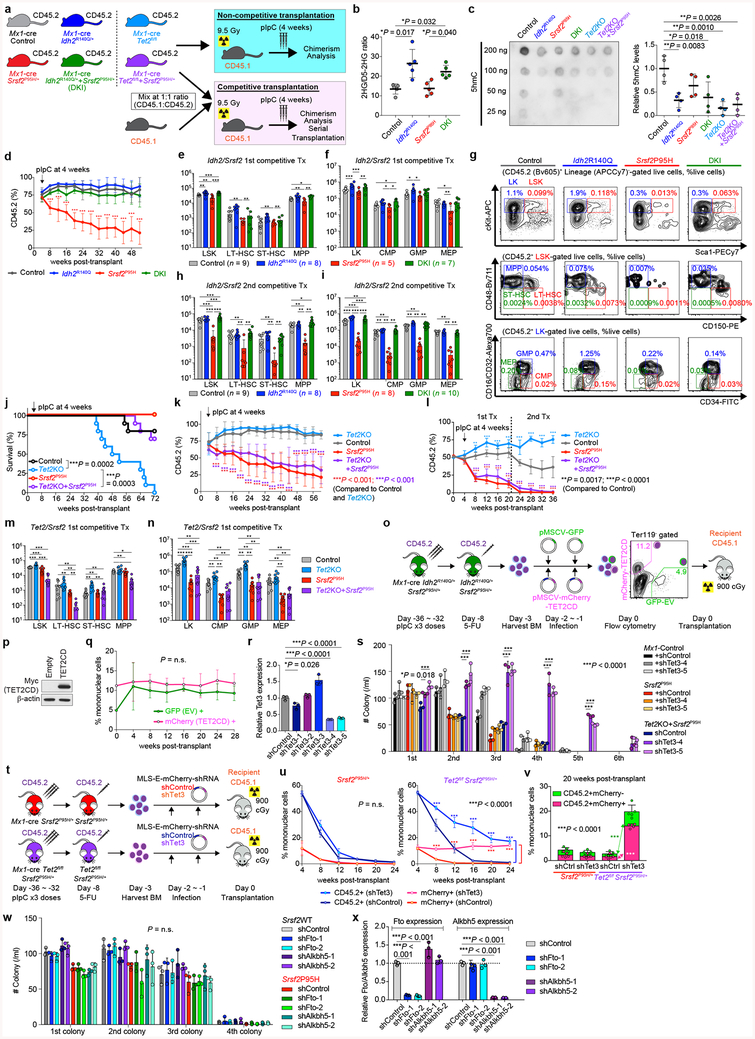
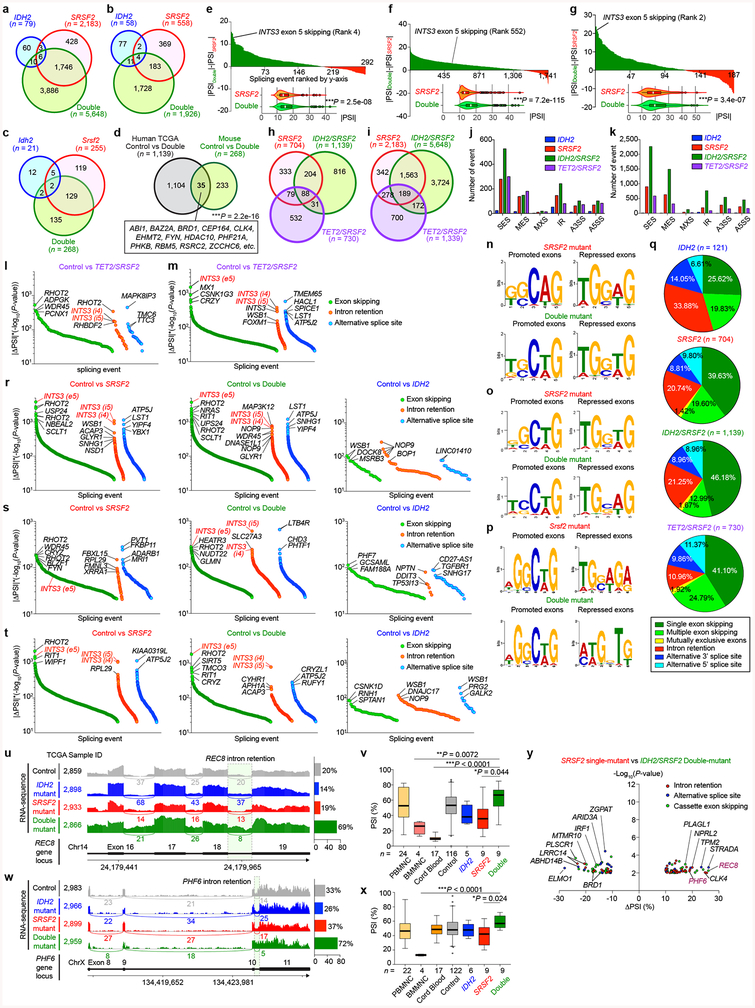
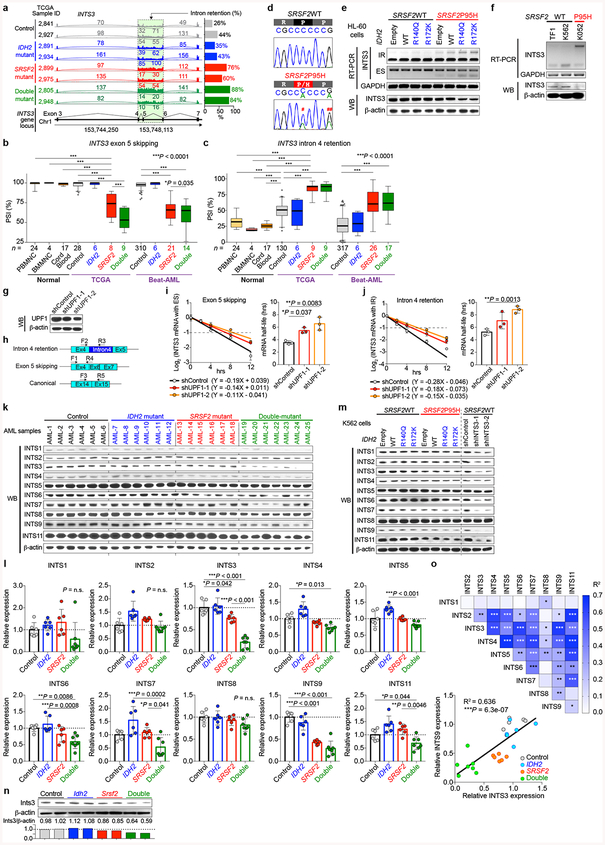
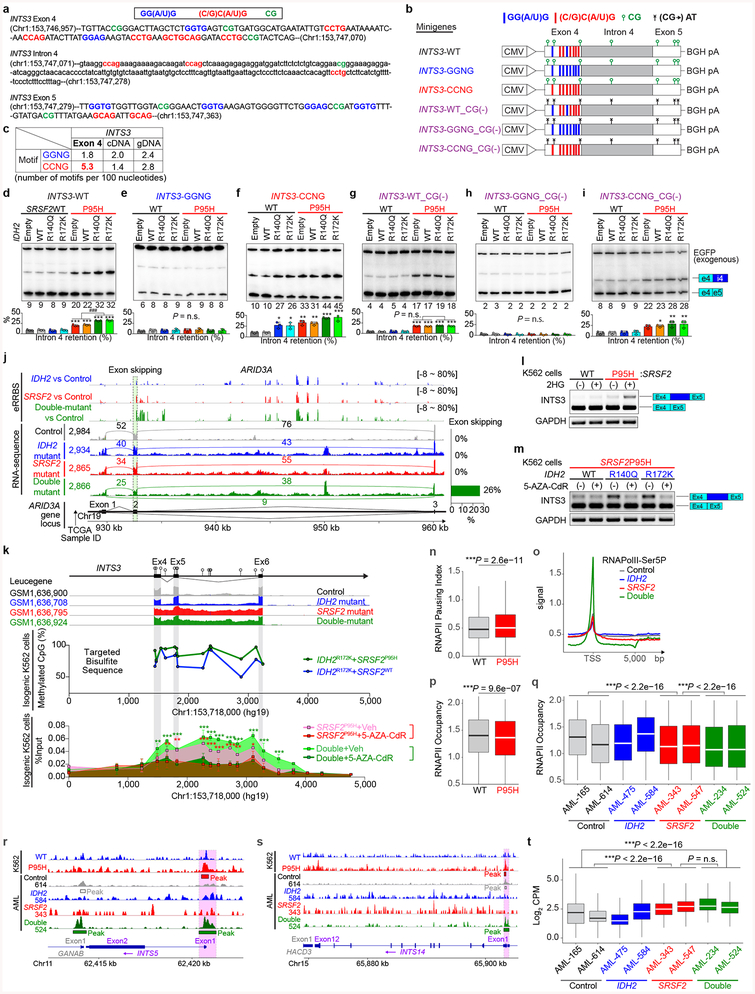
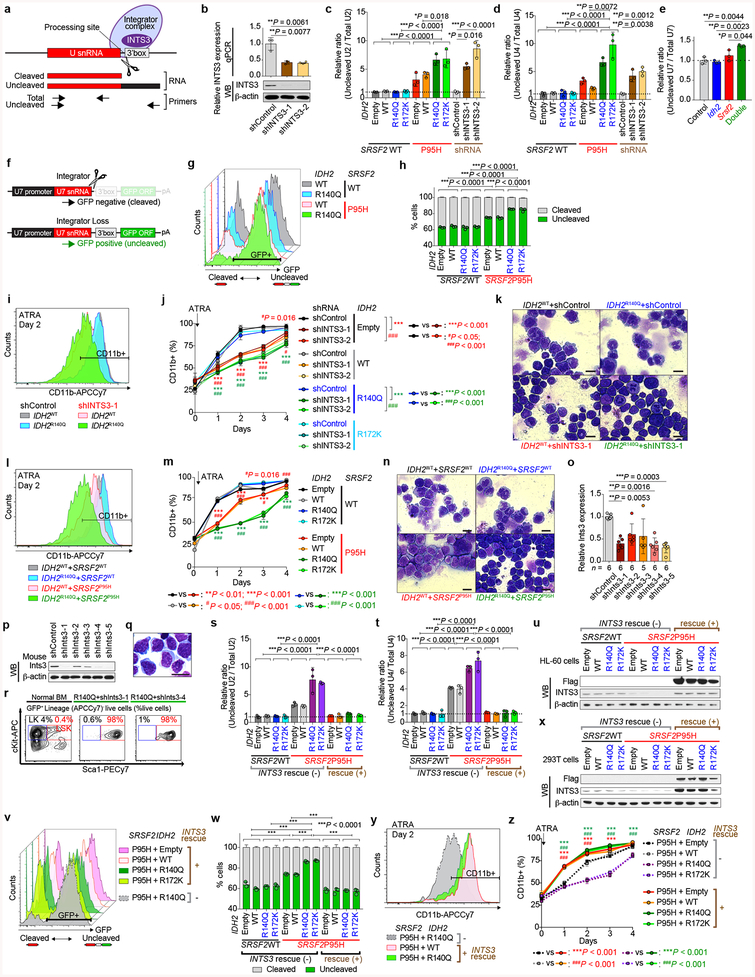
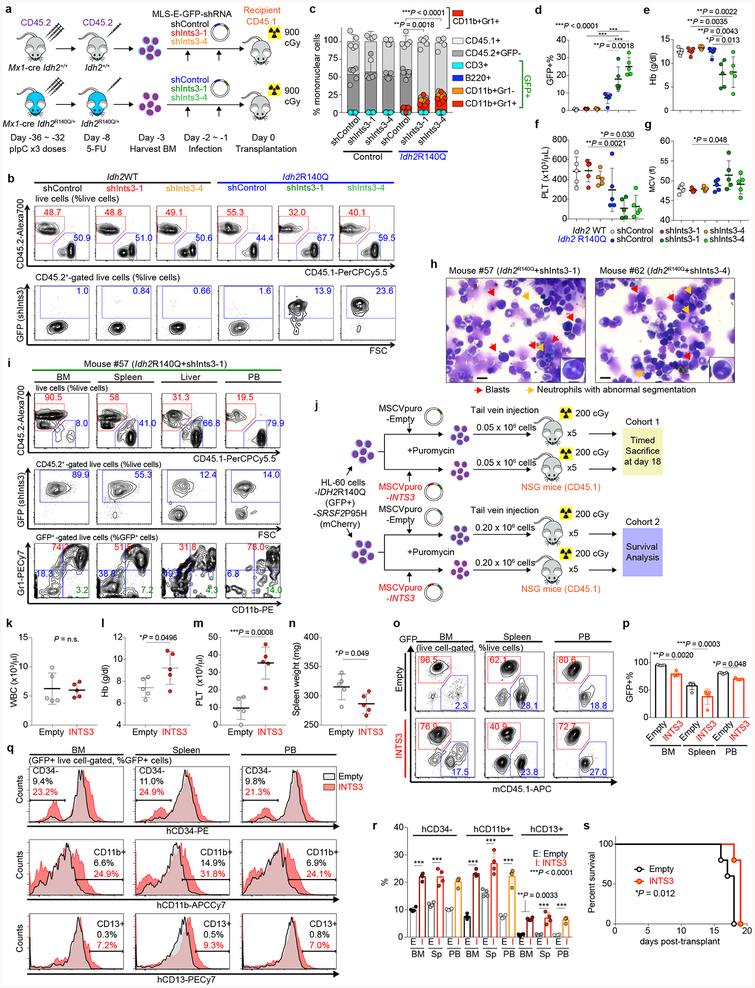
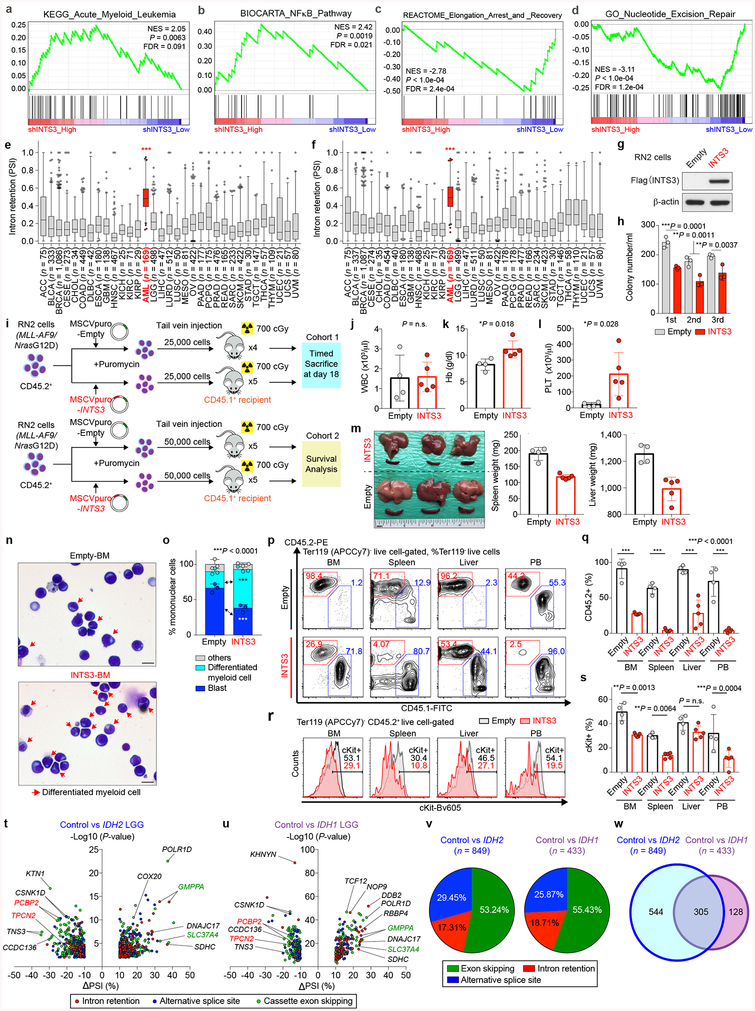
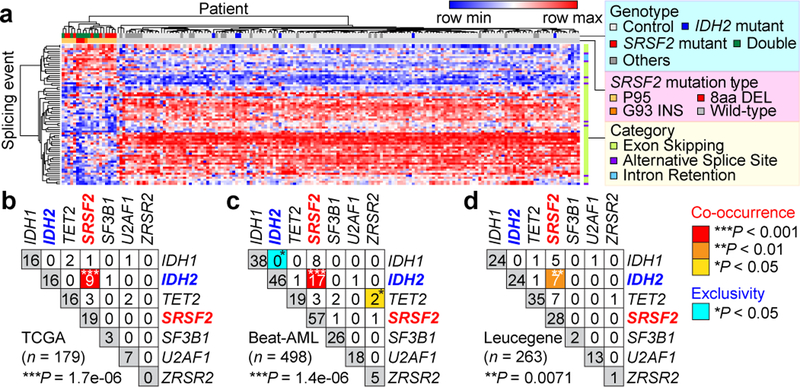
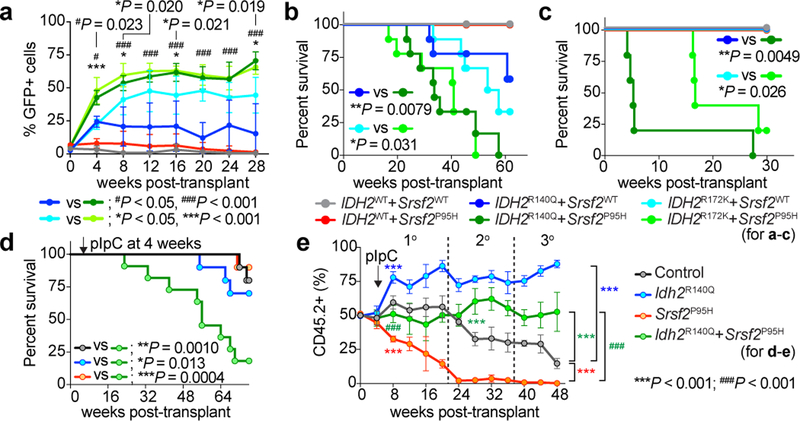
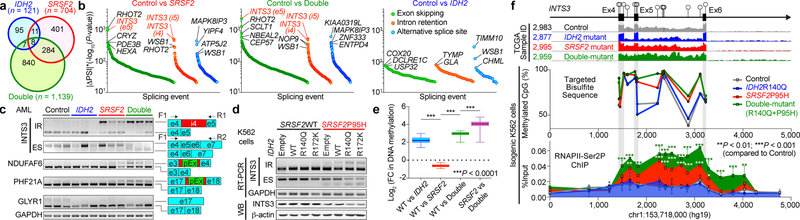
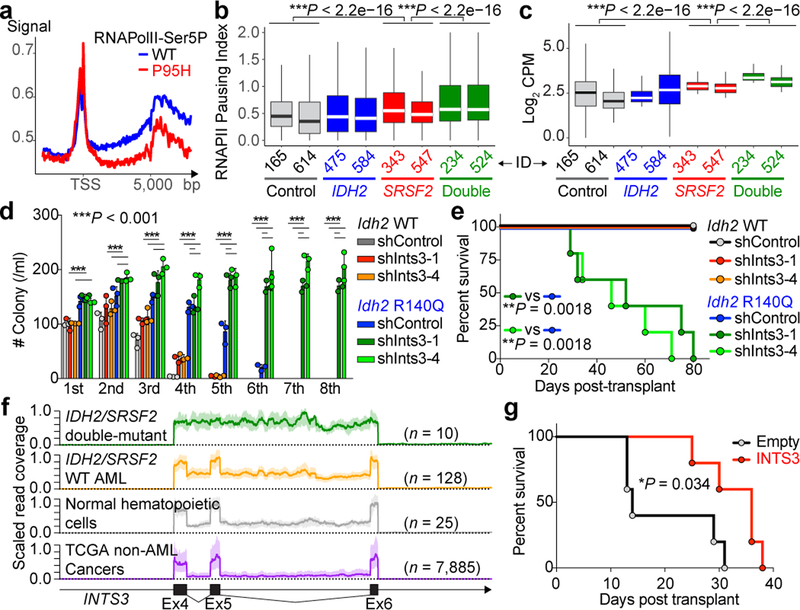
Transcription and pre-mRNA splicing are key steps in the control of gene expression and mutations in genes regulating each of these processes are common in leukaemia1,2. Despite the frequent overlap of mutations affecting epigenetic regulation and splicing in leukaemia, how these processes influence one another to promote leukaemogenesis is not understood and, to our knowledge, there is no functional evidence that mutations in RNA splicing factors initiate leukaemia. Here, through analyses of transcriptomes from 982 patients with acute myeloid leukaemia, we identified frequent overlap of mutations in IDH2 and SRSF2 that together promote leukaemogenesis through coordinated effects on the epigenome and RNA splicing. Whereas mutations in either IDH2 or SRSF2 imparted distinct splicing changes, co-expression of mutant IDH2 altered the splicing effects of mutant SRSF2 and resulted in more profound splicing changes than either mutation alone. Consistent with this, co-expression of mutant IDH2 and SRSF2 resulted in lethal myelodysplasia with proliferative features in vivo and enhanced self-renewal in a manner not observed with either mutation alone. IDH2 and SRSF2 double-mutant cells exhibited aberrant splicing and reduced expression of INTS3, a member of the integrator complex3, concordant with increased stalling of RNA polymerase II (RNAPII). Aberrant INTS3 splicing contributed to leukaemogenesis in concert with mutant IDH2 and was dependent on mutant SRSF2 binding to cis elements in INTS3 mRNA and increased DNA methylation of INTS3. These data identify a pathogenic crosstalk between altered epigenetic state and splicing in a subset of leukaemias, provide functional evidence that mutations in splicing factors drive myeloid malignancy development, and identify spliceosomal changes as a mediator of IDH2-mutant leukaemogenesis.


Conflict of interest statement

Competing interests

A.M.I. has served as a consultant/advisory board member for Foundation Medicine. E.M.S. has served on advisory boards for Astellas Pharma, Daiichi Sankyo, Bayer, Novartis, Syros, Pfizer, PTC Therapeutics, AbbVie, Agios, and Celgene and has received research support from Agios, Celgene, Syros and Bayer. R.L.L. is on the Supervisory Board of Qiagen and the Scientific Advisory Board of Loxo, reports receiving commercial research grants from Celgene, Roche, and Prelude, has received honoraria from the speakers bureaus of Gilead and Lilly, has ownership interest (including stock, patents, etc.) in Qiagen and Loxo, and is a consultant/advisory board member for Novartis, Roche, Janssen, Celgene, and Incyte. A.R.K. is a founder, director, advisor, stockholder, and chair of the SAB of Stoke Therapeutics, and receives compensation from the company; A.R.K. is a paid consultant for Biogen; he is a member of the SABs of Skyhawk Therapeutics, Envisagenics BioAnalytics, and Autoimmunity Biologic Solutions, and has received compensation from these companies in the form of stock; A.R.K. is a research collaborator of Ionis Pharmaceuticals and has received royalty income from Ionis through his employer, Cold Spring Harbor Laboratory. O.A.-W. has served as a consultant for H3 Biomedicine, Foundation Medicine Inc., Merck, and Janssen; O.A.-W. has received personal speaking fees from Daiichi Sankyo. O.A.-W. has received prior research funding from H3 Biomedicine unrelated to the current manuscript. D.I., R.K.B. and O.A.-W. are inventors on a provisional patent application (patent number FHCC.P0044US.P) applied for by Fred Hutchinson Cancer Research Center on the role of reactivating BRD9 expression in cancer by modulating aberrant BRD9 splicing in SF3B1 mutant cells.

Figures

Extended Data Fig. 1 |
Extended Data Fig. 1 |. Mutant SRSF2-mediated splicing events in acute myeloid leukemia (AML).
a, Representative Sashimi plots of RNA-seq data from the TCGA showing the poison exon inclusion event in EZH2 (“Control” represents samples that are wild-type (WT) for the following 7 genes: IDH1, IDH2, TET2, SRSF2, SF3B1, U2AF1, and ZRSR2; “IDH2 mutant” refers to patients with an IDH2 mutation and no mutation in the other 6 genes; “SRSF2 mutant” refers to patients with an SRSF2 mutation and no mutation in the other 6 genes; “Double-mutant” refers to patients with an IDH2 and SRSF2 mutation and no mutation in the other 5 genes; “Others” refers to patients with mutations in IDH1, TET2, SF3B1, U2AF1, or ZRSR2; figure made using Integrative Genomics Viewer (IGV 2.3)). b, ΔPSI (Percent-Spliced-In) values of EZH2 poison exon inclusion (the number of analyzed patients is indicated; the mean ± s.d.; one-way ANOVA with Tukey’s multiple comparison test; Note that patients classified as “Others” include one SRSF2P95L mutant patient with coexisting IDH1R132G mutation (TCGA ID: 2990) and one IDH2R140Q mutant patient with an SF3B1K666N mutation (TCGA ID: 2973), which were excluded from the analyses shown above. c, d, g, h, i, j, Variant allele frequencies (VAFs) of SRSF2 mutations affecting the Proline 95 residue (c, h, j) and IDH2 mutations affecting IDH2 Arginine 140 or 172 (d, g, i) in TCGA (c, d), Beat-AML (g, h), and Leucegene (i, j) datasets (the mean ± s.d.; a two-sided Student’s t-test). e, f, Heat map based on the ΔPSI of mutant SRSF2-specific splicing events in AML from Beat-AML (e) and Leucegene (f) cohorts. “8aa DEL” represents samples with 8 amino acid deletions in SRSF2 starting from Proline 95, which has similar effects on splicing as point mutations affecting SRSF2 P95. Detailed information of splicing events shown is available in Supplementary Table 1. k, Variant allele frequencies (VAFs) of IDH2 (x-axis) and SRSF2 mutations (y-axis) in IDH2/SRSF2 double-mutant AML determined by RNA-seq data from the TCGA, Beat-AML, Leucegene, and our previously unpublished cohorts (Pearson correlation coefficient; P-value (two-tailed) was calculated by Prism7). l, n, Unsupervised hierarchical clustering of DNA methylation levels of all probes (l) or at the promoter probes (n) in the TCGA AML cohort based on IDH2/SRSF2/TET2 genotypes. m, o, DNA methylation levels of AML samples from each genotype are quantified and visualized from l and n as violin plots (the mean represented by the line inside the box and the box expands from the 25th to 75th percentiles with whiskers drawn to 2.5 and 97.5 percentiles; one-way ANOVA with Tukey’s multiple comparison test).**P < 0.01; ***P < 0.001.
Extended Data Fig. 2 |
Extended Data Fig. 2 |. Clinical relevance of co-existing IDH2/SRSF2 mutations in AML.
a-c, Kaplan-Meier survival analysis of AML patients from the Manchester/Christie Biobank dataset ((a): based on IDH2/SRSF2 genotype (n = 258); (b): based on cytogenetic risk (n = 284)) and the TCGA (c) (n = 161) based on IDH1/IDH2/SRSF2 genotypes (Log-rank (Mantel-Cox) test (two-sided)). d, Age at diagnosis of patients from the TCGA, Beat-AML, and Manchester/Christie Biobank cohorts combined (the mean represented by the line inside the box and the box expands from the 25th to 75th percentiles with whiskers drawn to 2.5 and 97.5 percentiles; samples below 2.5 percentile and above 97.5 percentile are shown as plots; one-way ANOVA with Tukey’s multiple comparison test). e, Distribution of French-American-British (FAB) classification of AML patients with indicated genotypes from the TCGA cohort. f-h, Mutations co-existing with IDH2/SRSF2 double-mutant and SRSF2 single-mutant AML from the TCGA (f), Beat-AML (g), and Manchester/Christie Biobank (h) cohorts are shown with FAB Classification, cytogenetic risk, prior history of myeloid disorders, and genetic risk stratification based on European LeukemiaNet (ELN) 2008 and ELN2017 guidelines (the number of patients is indicated; P-values on the right represent statistical significance of co-occurrence (red and orange) or mutual exclusivity (blue and light blue) of each gene mutation with SRSF2 (including those in IDH2/SRSF2 double-mutant AML) or co-existing IDH2 and SRSF2 mutations; Fisher’s exact test (two-sided)). *P < 0.05; **P < 0.01; ***P < 0.001.
Extended Data Fig. 3 |
Extended Data Fig. 3 |. Mutant IDH2 cooperates with mutant Srsf2 to generate lethal MDS with proliferative features in vivo.
a, Schematic of bone marrow (BM) transplantation model. b, c, Chimerism of CD45.2+ cells in the peripheral blood (PB) of recipient mice over time (b) (n = 5 per group at 4 weeks; the mean percentage ± s.d.; two-way ANOVA with Tukey’s multiple comparison test) and representative flow cytometry data showing the chimerism of CD45.2+ vs CD45.1+ (top) or GFP+ (bottom) cells in PB at 16 weeks post-transplant (c) (representative results from five recipient mice; the percentages listed represent the percent of cells within live cells). d, Composition of PB mononuclear cells (PBMNCs) at 28 weeks post-transplant (the number of analyzed animals is indicated; the mean + s.d.; two-way ANOVA with Tukey’s multiple comparison tests statistical significances were detected in % of CD11b+Gr1+ cells in IDH2R140Q + Srsf2WT vs IDH2R140Q + Srsf2P95H and in IDH2R172K + Srsf2WT vs IDH2R172K + Srsf2P95H). e-h, Blood counts at 20 weeks post-transplant (WBC (e); Hb (f); PLT (g); MCV, mean corpuscular volume (h); the number of analyzed animals is indicated; the mean ± s.d.; one-way ANOVA with Tukey’s multiple comparison tests. i, Plasma 2HG levels at 20 weeks post-transplant (2HG levels were quantified as described; n = 5 per group were randomly selected; the mean ± s.d.; one-way ANOVA with Tukey’s multiple comparison test). j, Correlations between plasma 2HG levels and number of GFP+ cells in peripheral blood at 24 weeks post-transplant (n = 5 per group; the Pearson correlation coefficient (R2) and P-values (two-tailed) were calculated using PRISM 7). k, Colony numbers from serial replating assays of BM cells harvested from end-stage mice from Fig. 2b are shown (the mean value ± s.d. represented by lines above the box; the number of analyzed animals is indicated; two-way ANOVA with Tukey’s multiple comparison test). l, Giemsa staining of IDH2R140Q + Srsf2P95H double-mutant cells from the 6th plating (scale bar, 10 μm; original magnification × 400; representative result from nine biologically independent experiments). m, Immunophenotype of colony cells at the 6th plating. Normal BM cells were used as a control (the percentage listed represent the percent of cells within live cells; representative result from nine recipient mice). n, Cytomorphology of BM mononuclear cells (BMMNCs) from recipient mice at end-stage. BM cells from IDH2 single-mutant and IDH2/Srsf2 double-mutant groups have increased granulocytes. In addition, IDH2/Srsf2 double-mutant groups had proliferation of monoblastic and monocytic cells as well as dysplastic features such as abnormally segmented neutrophils (black arrow and inset) and binucleated erythroid precursors with irregular nuclear contours (insets) (scale bar, 10 μm; original magnification × 400; representative results from three controls and nine recipients are shown; number of animals indicated in o-r). o-r, Blood counts at end-stage (WBC (o); Hb (p); PLT (q); MCV (r); the number of analyzed animals is indicated; the mean ± s.d.; Kruskal-Wallis tests with uncorrected Dunn’s test). s-u, Results from flow cytometry analysis of BM (s) and PB (t) mature lineages as well as BM hematopoietic stem/progenitor cells (HSPC) from two tibias, two femurs, and two pelvic bones (u) are quantified (LSK: LineageSca1+cKit+; LT-HSC: long-term hematopoietic stem cell; ST-HSC: short-term HSC; MPP: multi-potent progenitor; LK: LineageSca1cKit+; CMP: common myeloid progenitor; GMP: granulocyte-monocyte progenitor; MEP: megakaryocyte-erythroid progenitor; the number of analyzed animals is indicated; the mean + s.d. is represented; two-way ANOVA with Tukey’s multiple comparison test). v, w, Spleen weight at end-stage (the number of analyzed animals is indicated; the mean ± s.d.; two-way ANOVA with Tukey’s multiple comparison test) (v) and representative photographs of spleens from recipient mice from v (w) (each photograph was taken with an inch ruler). x, Kaplan-Meier survival analysis of serially transplanted recipient mice that were lethally irradiated (n = 5 per group; Log-rank (Mantel-Cox) test (two-sided)). *P < 0.05; **P < 0.01; ***P < 0.001.
Extended Data Fig. 4 |
Extended Data Fig. 4 |. Collaborative effects of mutant Idh2 and mutant Srsf2 are not dependent on Tet2 loss alone.
a, Schematic of competitive and non-competitive transplantation assays of CD45.2+ Mx1-cre control, Mx1-cre Idh2R140Q/+, Mx1-cre Srsf2P95H/+, Mx1-cre Idh2R140Q/+Srsf2P95H/+ mice, Mx1-cre Tet2fl/fl, Mx1-cre Tet2fl/flSrsf2P95H/+ mice into CD45.1+ recipient mice. b, 2HG levels of bulk PBMNCs from primary Mx1-cre mice were measured at 3 months post-pIpC (polyinosinic:polycytidylic acid) and normalized to internal standard (D-2-hydroxyglutaric-2,3,3,4,4-d5 acid; D5–2HG) (2HG and D5–2HG levels were quantified as described; n = 5 per group; the mean ± s.d.; one-way ANOVA with Tukey’s multiple comparison test). c, DNA extracted from sorted cKit+ BM cells from primary Mx1-cre mice at 1 month post-pIpC was probed with antibodies specific for 5-hydroxymethylcytosine (5hmC) (left). Relative intensity of each dot was measured by ImageJ and divided by input DNA amount for comparison (right; n = 4; intensity of each dot divided by amount of input DNA was combined per genotype; representative results from three biologically independent experiments with similar results; the mean ± s.d.; one-way ANOVA with Tukey’s multiple comparison test). d, Chimerism of PB CD45.2+ cells in non-competitive transplantation (pIpC was injected at 4 weeks post-transplant; the mean ± s.d.; n = 10 (Control and Idh2R140Q), n = 8 (Srsf2P95H), and n = 9 (DKI) at 0 week; two-way ANOVA with Tukey’s multiple comparison test; P-values from comparison between Srsf2P95H and each of other groups are shown). e-i, Absolute number of BM HSPCs from two tibias, two femurs, and two pelvic bones were measured in the primary (e, f) and serial (h, i) competitive transplant of Idh2/Srs2 mutant cells, and representative flow cytometry of BM HSPCs from the primary competitive transplant of Idh2/Srsf2 mutant cells from e, f (the percentage listed represents the percent of cells within live cells) (the number of analyzed animals is indicated; the mean + s.d.; two-way ANOVA with Tukey’s multiple comparison test). j, Kaplan-Meier survival analysis of CD45.1+ recipient mice transplanted non-competitively with BM cells from CD45.2+ Mx1-cre control, Mx1-cre Tet2fl/fl, Mx1-cre Srsf2P95H/+, and Mx1-cre Tet2fl/flSrsf2P95H/+ mice (pIpC was injected at 4 weeks post-transplant; n = 10 per genotype; Log-rank (Mantel-Cox) test (two-sided)). k, l, Chimerism of PB CD45.2+ cells in non-competitive (k) (n = 10 (Control and Tet2KO), n = 8 (Srsf2P95H), and n = 5 (Tet2KO + Srsf2P95H) at 0 week) or competitive (l) (n = 9 (Control), n = 10 (Tet2KO), n = 8 (Srsf2P95H), and n = 10 (Tet2KO + Srsf2P95H) at 0 week) transplantation (pIpC was injected at 4 weeks post-transplant; percentages of CD45.2+ cells at pre-transplant are also shown as data at 0 weeks in l; the mean ± s.d.; two-way ANOVA with Tukey’s multiple comparison test). m, n, Absolute number of BM HSPCs from two tibias, two femurs, and two pelvic bones were measured in the primary competitive transplant of Tet2/Srsf2 mutant cells (n = 10 per genotype; the mean + s.d.; two-way ANOVA with Tukey’s multiple comparison test). o, Schematic of TET2 catalytic domain (CD: catalytic domain; EV: empty vector) retroviral BM transplantation model. p, Western blot analysis confirming the expression of Myc-tagged TET2CD in Ba/F3 cells transduced with or without TET2CD (representative images from two biologically independent experiments with similar results). q, Chimerism of mCherry-TET2CD+ and GFP-EV+ cells in PB of recipient mice over time (n = 10; the mean percentage ± s.d.; two-way ANOVA with Sidak’s multiple comparison test). r, qPCR of Tet3 in the first colony cells from s (n = 3; the mean ± s.d.; a two-sided Student’s t-test). s, Colony numbers from serial replating assays of BM cells from Mx1-cre control, Mx1-cre Srsf2P95H/+, and Mx1-cre Tet2fl/flSrsf2P95H/+ mice transduced with anti-Tet3 short-hairpin RNAs (shRNAs) (n = 3; the mean + s.d.; two-way ANOVA with Tukey’s multiple comparison test). t, Schematic of anti-Tet3 shRNA (shTet3) retroviral BM transplantation model. u, v, Chimerism of mCherry+ cells in CD45.2+ donor cells in PB of recipient mice over time (u; left panel: Mx1-cre Srsf2P95H/+, right panel: Mx1-cre Tet2fl/flSrsf2P95H/+; n = 5 per group) and at 20 weeks post-transplant (v) (the mean percentage ± s.d.; two-way ANOVA with Sidak’s multiple comparison test). w, Colony numbers from serial replating assays of either Mx1-cre Srsf2+/+ or Srsf2P95H/+ BM cells transduced with an shRNA against Fto or Alkbh5. BM cells were harvested at 1 month post-pIpC (n = 3; the mean value ± s.d.; two-way ANOVA with Tukey’s multiple comparison test). x, qPCR of Fto or Alkbh5 in Ba/F3 cells transduced with shRNAs targeting mouse Fto or Alkbh5 (n = 3; the mean value ± s.d.; one-way ANOVA with Tukey’s multiple comparison test). *P < 0.05; **P < 0.01; ***P < 0.001.
Extended Data Fig. 5 |
Extended Data Fig. 5 |. IDH2 mutations augment the RNA splicing defects of SRSF2 mutant leukemia.
a-c, Venn diagram showing numbers of differentially spliced events from the Beat-AML cohort (a), Unpublished Collaborative Cohort_2 (b), and murine LincKit+ bone marrow cells at 12 weeks post-pIpC (c) based on IDH2/SRSF2 mutant genotypes. d, Venn diagram showing the numbers of overlapping alternatively spliced events between IDH2/SRSF2 double-mutant AMLs and mouse models (***P = 2.2e-16; binominal test). e-g, Δ|PSI| (Δ|PSI| = |PSI|Double - |PSI|SRSF2) values for each overlapping mis-spliced event in SRSF2 single-mutant and IDH2/SRSF2 double-mutant AML from the TCGA (e), Beat-AML cohort (f) and Unpublished Collaborative Cohort_2 (g) are ranked by y-axis. Spliced events shown in green and red represent events that are more robust in IDH2/SRSF2 double-mutant and SRSF2 single-mutant AML, respectively, in terms of |PSI| values. The mean |PSI| value of each event was visualized as violin plots on the bottom (n = 292, n = 1,741, and n = 187, respectively; PSI values were calculated using PSI-Sigma; the mean value is represented by the thick white line inside the box and the box expands from the 25th to 75th percentiles with whiskers drawn down to the 2.5 and 97.5 percentiles; samples below 2.5 percentile and above 97.5 percentile are shown as plots; paired two-tailed Student t-test). h, i, Venn diagram of numbers of differentially spliced events from the TCGA (h) and Beat-AML (i) datasets based on IDH2/TET2/SRSF2 genotypes. j, k, Absolute numbers of each class of alternative splicing event from TCGA (j) and Beat-AML (k) datasets are shown (SES; single-exon skipping, MES; multiple-exon skipping, MXS; mutually-exclusive splicing, A5SS; alternative 5’ splice site, A3SS; alternative 3’ splice site, IR; intron retention). l, m, Differentially spliced events (|ΔPSI| > 10% and P < 0.01 were used as thresholds) in indicated genotype from the TCGA (l) (n = 730 differentially spliced events) and Beat-AML (m) (n = 1,339 differentially spliced events) cohorts are ranked by y-axis and class of event (PSI and P-values adjusted for multiple comparisons were calculated using PSI-Sigma; e5: exon 5; i4/5: intron 4/5). n-p, Sequence logos of nucleotide motifs of exons preferentially promoted or repressed in splicing in SRSF2 single-mutant (top) or IDH2/SRSF2 double-mutant (bottom) AML from the TCGA cohort (n), Beat-AML cohort (o), and mouse models (p). q, Percentage of each class of alternative splicing event in indicated genotype from TCGA cohort is shown in pie-chart. r-t, Differentially spliced events (|ΔPSI| > 10% and P < 0.01 were used as thresholds) in indicated genotype from the Beat-AML (r) (n = 2,183, 5,648, and 79 differentially spliced events, respectively), Unpublished Collaborative Cohort_2 (s) (n = 558, 1,926, and 94 differentially spliced events, respectively), and Leucegene cohort (t) (n = 2,571, 787, and 122 differentially spliced events, respectively) are ranked by y-axis and class of event (PSI and P-values adjusted for multiple comparisons were calculated using PSI-Sigma). u, w, Representative Sashimi plots of RNA-seq data showing the intron retention events in REC8 (u) and PHF6 (q) from the TCGA dataset. v, x, PSI values for intron retention events in REC8 (v) and PHF6 (x) in normal PBMNCs (GSE58335), BMMNCs (GSE61410), cord blood CD34+ cells (GSE48846), and AML samples with indicated genotypes (the median value is represented by the thick line inside the box and the box expands from the 25th to 75th percentiles with whiskers drawn down to the 2.5 and 97.5 percentiles; samples below 2.5 percentile and above 97.5 percentile are shown as plots; PSI and P-values adjusted for multiple comparisons were calculated using PSI-Sigma; one-way ANOVA with Tukey’s multiple comparison test; *P < 0.05; **P < 0.01; ***P < 0.001). y, Volcano plots of aberrant splicing events in TCGA AML data comparing SRSF2 single-mutant and IDH2/SRSF2 double-mutant AML (n = 122 differentially spliced events; PSI and P-values adjusted for multiple comparisons were calculated using PSI-Sigma; |ΔPSI| > 10% and P < 0.01 were used as thresholds).
Extended Data Fig. 6 |
Extended Data Fig. 6 |. Aberrant INTS3 transcripts undergo nonsense-mediated decay and impact of INTS3 loss extends to other members of the Integrator complex.
a, Representative Sashimi plots of RNA-seq data from the TCGA showing intron retention in INTS3. b, c, PSI values for INTS3 exon 5 skipping (b) and intron 4 retention (c) in normal PBMNC (GSE58335), BMMNC (GSE61410), cord blood CD34+ cells (GSE48846), and AML samples with indicated genotypes (the number of RNA-seq samples analyzed is indicated; PSI and P-values adjusted for multiple comparisons were calculated using PSI-Sigma; the mean value is represented by the line inside the box and the box expands from the 25th to 75th percentiles with whiskers drawn to 2.5 and 97.5 percentiles; samples below 2.5 percentile and above 97.5 percentile are shown as plots; one-way ANOVA with Tukey’s multiple comparison test). d, Sanger sequencing of cDNA showing WT or mutant SRSF2 expression in isogenic K562 knock-in cells (# a nonsynonymous mutation that alters P95. ## a synonymous mutation that does not change the amino acid). e, RT-PCR and WB analysis of INTS3 in isogeneic HL-60 cells with various combinations of IDH2/SRSF2 mutations (IR: intron retention; ES: exon skipping; representative results from three biologically independent experiments with similar results). f, RT-PCR and WB of INTS3 in non-isogenic myeloid leukemia cell lines. SRSF2 genotypes are shown together (representative results from three independent experiments with similar results). g, WB analysis of K562 SRSF2P95H knock-in cells transduced with shRNAs against UPF1 (representative results from three biologically independent experiments with similar results). h, Primers used to specifically measure INTS3 isoform with intron 4 retention and exon 5 skipping, and those for the normal INTS3 isoform. i, j, Half-life of INTS3 transcripts with exon 5 skipping (i) and intron 4 retention (j) were measured by qPCR (n = 3; the mean ± s.d.; a two-sided Student’s t-test). k, l, WB analysis of protein lysates from AML patient samples with indicated IDH2/SRSF2 genotypes (k). Expression level of each Integrator subunit was quantified using ImageJ and relative expression levels are shown in l where the mean expression levels of control samples were set as 1 (n = 6 for control, IDH2 single-mutant, and SRSF2 single-mutant AML, and n = 7 for IDH2/SRSF2 double-mutant AML; Detailed information of the primary patient samples used for this analysis is provided in Supplementary Table 23; the mean ± s.d.; one-way ANOVA with Tukey’s multiple comparison test). m, WB analysis of protein lysates from isogenic K562 cells with indicated IDH2/SRSF2 genotypes (left) or with INTS3 knockdown (right) (representative results from three biologically independent experiments are shown). n, WB analysis of murine LincKit+ BM cells at 12 weeks post-pIpC based on Idh2/Srsf2 mutant genotypes. (expression level of Ints3 was quantified using ImageJ and relative expression levels are shown below; n = 2 animals per genotype were analyzed). o, Correlation among indicated Integrator subunits and P-value were calculated in Excel(15.40) and R2 values are visualized as a Heatmap generated by Prism 7 (top). Correlation between INTS3 and INTS9 protein expression is shown (bottom) (n = 25 from k; the Pearson correlation coefficient (R2) and P-values (two-tailed) were calculated in Excel(15.40)). *P < 0.05; **P < 0.01; ***P < 0.001.
Extended Data Fig. 7 |
Extended Data Fig. 7 |. DNA hypermethylation at INTS3 enhances INTS3 mis-splicing, which is associated with RNA polymerase II (RNAPII) stalling.
a, Sequence of human INTS3 exon 4, intron 4 and exon 5, and schematic of INTS3 minigene constructs. GG(A/U)G motifs, (C/G)C(A/U)G motifs, and CG dinucleotides are highlighted in blue, red, and green, respectively. b, Schematic of INTS3 minigene constructs. c, Table revealing the number of GGNG or CCNG motifs in exon 4, entire cDNA of INTS3, or entire genomic DNA (gDNA) of INTS3 per 100 nucleotides. d-i, Radioactive RT-PCR results of INTS3 minigene assays using indicated versions of the minigene in isogenic K562 cells. Percentage of intron 4 retention were normalized against exogenous EGFP (n = 3; the mean percentage ± s.d.; one-way ANOVA with Tukey’s multiple comparison test). j, Mean percentage of methylated CpGs at ARID3A in AML patient samples with indicated genotypes determined by enhanced reduced representation bisulfite sequence (eRRBS) (n = 3 patients per genotype), followed by IGV plots of RNA-seq data of ARID3A from the TCGA. k, Results of targeted bisulfite sequence (n = 1 per genotype) and RNAPII-Ser2P ChIP-walking experiments are represented as shown in Fig. 3f (n = 3; the mean percentage ± s.d.; two-way ANOVA with Tukey’s multiple comparison test). l, m, RT-PCR results detecting INTS3 intron retention in isogenic K562 cells harboring various combinations of IDH2 and SRSF2 mutations that were treated with cell-permeable 2HG at 0.5 μM (l) or 5-AZA-CdR at 5 μM (m) for 8 days (representative results from three biologically independent experiments with similar results). n, RNAII pausing index in isogenic SRSF2WT or SRSF2P95H mutant K562 cells was calculated as previously described as a ratio of normalized ChIP-Seq reads of RNAPII-Ser5P on TSSs (+/− 250 bp) over that of the corresponding bodies (+500 to +1000 from TSSs) (the median value is represented by the line inside the box and the box expands from the 25th to 75th percentiles with whiskers drawn down to the 2.5 and 97.5 percentiles; each box plot was made by analyzing ChIP-seq data from one cell line; two-sided Student’s t-test). o, Metagene plots showing genome-wide RNAPII-Ser5P occupancy in primary AML patient samples with indicated genotypes (TSS: transcription start site; patient samples used for this analysis are described in Supplementary Table 23). p, q, RNAPII occupancy representing ChIP-Seq reads of RNAPII-Ser2P over gene bodies was calculated for isogenic K562 cells (p) and AML samples (q) (the median value is represented by the line inside the box and the box expands from the 25th to 75th percentiles with whiskers drawn down to the 2.5 and 97.5 percentiles; each box plot was made by analyzing ChIP-seq data from one cell line (p) or one primary AML sample (q); two-sided Student’s t-test (p) and one-way ANOVA with Tukey’s multiple comparison test (q)). r, s, Genome browser view of ChIP-seq signal for RNAPII-Ser5P at INTS5 (r) and INTS14 (s) in isogenic K562 cells with or without SRSF2 mutation (n = 1) and primary AML samples with indicated genotype (results generated from n = 2 primary AML samples are shown). t, RNAPII abundance over the differentially spliced regions between IDH2/SRSF2 wild-type control and SRSF2 single-mutant AML determined by RNAPII-Ser2P ChIP-seq (y-axis: Log2 (Counts per million); the median value is represented by the line inside the box and the box expands from the 25th to 75th percentiles with whiskers drawn down to the 2.5 and 97.5 percentiles; each box plot was made by analyzing ChIP-seq data from one primary AML sample; one-way ANOVA with Tukey’s multiple comparison test). *P < 0.05; **P < 0.01; ***P < 0.001.
Extended Data Fig. 8 |
Extended Data Fig. 8 |. Loss of INTS3 impairs uridine-rich small nuclear RNA (snRNAs) processing and blocks myeloid differentiation.
a, Schematic of snRNA processing site and qPCR primers for detecting cleaved or uncleaved snRNA. b, qPCR (top; n = 3; the mean ± s.d.; a two-sided Student’s t-test) and representative WB of INTS3 in HL-60 cells transduced with short-hairpin RNAs (shRNAs) targeting human INTS3 (bottom; representative results from three biologically independent experiments). c-e, s, t, qPCR results of U2 (c, s) and U4 (d, t) snRNAs in isogenic HL-60 cells and U7 snRNA in murine cells from Extended Data Fig. 6n (e). Ratio of uncleaved/total snRNAs expression was compared (n = 3, the mean ratio ± s.d.; one-way ANOVA with Tukey’s multiple comparison test; the largest P-values calculated among 2 × 2 comparisons of two components from different groups are shown. For example, P-values were calculated from the following four comparisons; bars 1 vs 3, 2 vs 3, 1 vs 4, 2 vs 4). f, Schematic of the U7 snRNA-GFP reporter. g, v, Flow cytometry analysis of 293T cells transduced with U7 snRNA-GFP reporter and IDH2/SRSF2/INTS3 constructs as labeled on the right (representative results from three biologically independent experiments are shown). h, w, Quantification of % GFP and GFP+ 293T cells (n = 3 biologically independent experiments, the mean percentage ± s.d.; one-way ANOVA with Tukey’s multiple comparison test; P-values are shown as in c). i, l, y, Flow cytometry analysis of CD11b expression in isogenic HL-60 cells after ATRA treatment for two days (representative results from three biologically independent experiments are shown). j, m, z, Quantification of percentages of CD11b+ HL-60 cells over time (n = 3; the mean percentage ± s.d.; two-way ANOVA with Tukey’s multiple comparison test). k, n, Cytomorphology of isogenic HL-60 cells after ATRA treatment for two days (Giemsa staining; scale bar, 10 μm; original magnification × 400; representative results from three biologically independent experiments are shown). o, p, qPCR (o) (the mean ± s.d.; Kruskal-Wallis tests with uncorrected Dunn’s test) and WB (p) of Ints3 in Ba/F3 cells transduced with shRNAs targeting mouse Ints3. q, r, Representative cytomorphology (q) and immunophenotype (r) of colony cells at the 6th colony. Normal BMMNCs were used as a control (the percentage listed represent the percent of cells within live cells; representative results from three biologically independent experiments are shown). u, x, WB of proteins extracted from HL-60 cells (u) assayed in s-t and y-z and 293T cells (x) assayed in v-w (representative results from three biologically independent experiments). *P < 0.05; **P < 0.01; ***P < 0.001; #P < 0.05; ##P < 0.01; ###P < 0.001.
Extended Data Fig. 9 |
Extended Data Fig. 9 |. Mutant Idh2 cooperates with Ints3 loss to generate a lethal myeloid neoplasm in vivo.
a, Schematic of anti-Ints3 shRNA (shInts3) retroviral BM transplantation model. b, Flow cytometry data showing the chimerism of CD45.2+ vs CD45.1+ (top) or GFP+ (bottom) cells in PB at 4 weeks post-transplant (the percentages listed represent the percent of cells within live cells; representative results from five recipient mice). c, Composition of PBMNCs at 4 weeks post-transplant (n = 5 per group; the mean + s.d.; represented by lines above the box. statistical significance was detected in % of CD11b+Gr1+ cells; by two-way ANOVA with Tukey’s multiple comparison test. d-g, Chimerism of GFP+ cells in PB (d) and blood counts of recipients at 4 weeks post-transplant (Hb (e); PLT (f); MCV (g); n = 5 per group; the mean ± s.d.; one-way ANOVA with Tukey’s multiple comparison test). h, Giemsa staining of BMMNCs from moribund mice with indicated genotypes (red and yellow arrows represent blastic cells and dysplastic neutrophils, respectively; inset, representative neutrophils with abnormal segmentation; scale bar, 10 μm; original magnification × 400; representative results from five mice per genotype). i, Flow cytometry data of BM, spleen, liver, and PB from Idh2R140Q+shInts3 mice (representative results from five mice). j, Schematic of HL-60 xenograft model where recipient mice from Cohort 1 were sacrificed at day 18 post-transplant and mice from Cohort 2 were observed for survival analysis until end-stage. k-n, Blood counts (WBC (k); Hb (l); PLT (m)) and spleen weight (n) of mice from Cohort 1 at day 18 post-transplant (the mean ± s.d.; n = 5 per group; a two-sided Student’s t-test). o, p, Representative flow cytometry data of BM, spleen, and PB from the recipient mice from Cohort 1 (o) (the percentage represents the percent of cells within live cells) and the mean percentage of GFP+ cells (p) (n = 5 per group; the mean + s.d.; two-way ANOVA with Sidak’s multiple comparison test). q, r, Representative flow cytometry data of BM, spleen, and PB from Cohort 1 (q) (the percentage represents the percent of cells within GFP+ live cells) and the mean percentage of hCD34, hCD11b+, and hCD13+ cells (r) (n = 4 per group; the mean + s.d.; two-way ANOVA with Sidak’s multiple comparison test). s, Kaplan-Meier survival analysis of recipient mice from Cohort 2 (n = 5 per group; Log-rank (Mantel-Cox) test (two-sided)). *P < 0.05; **P < 0.01; ***P < 0.001.
Extended Data Fig. 10 |
Extended Data Fig. 10 |. Gene expression and biological consequences of INTS3 loss and impact of IDH1/2 mutations on splicing in low-grade glioma.
a-d, Gene set enrichment analysis (GSEA) based on RNA-seq data generated from isogenic IDH2R140Q mutant HL-60 cells with or without INTS3 depletion. Representative results from gene sets associated with leukemogenesis and myeloid differentiation (a), oncogenic signaling pathways (b), RNAPII elongation-linked transcription (c), and DNA damage response (d) with statistical significance (P < 0.01) are shown (y-axis; Enrichment score; NES: Normalized enrichment score; FDR: False discovery rate; RNA-seq data generated from isogenic HL-60 cells in duplicate were analyzed using GSEA). e, f, PSI values for INTS3 intron 4 (e) and 5 (f) retention events across 33 cancer cell types (the same datasets were analyzed in Fig. 4f; ACC: adrenocortical carcinoma, BLCA: bladder urothelial carcinoma, BRCA: breast invasive carcinoma, CESC: cervical squamous cell carcinoma and endocervical adenocarcinoma, CHOL: cholangiocarcinoma, DLBC: diffuse large B-cell lymphoma, ESCA: esophageal carcinoma, GBM: glioblastoma mutiforme, HNSC: head and neck squamous cell carcinoma, KICH: kidney chromophobe, KIRC: kidney renal clear cell carcinoma, KIRP: kidney renal papillary cell carcinoma, LGG: low-grade glioma, LIHC: liver hepatocellular carcinoma, LUSC: lung squamous cell carcinoma, MESO: mesothelioma, OV: ovarian serous cystadenocarcinoma, PRAD: prostate adenocarcinoma, READ: rectum adenocarcinoma, SARC: sarcoma, SKCM: skin cutaneous melanoma, STAD: stomach adenocarcinoma, TGCT: testicular germ cell tumors, THCA: thyroid carcinoma, THYM: thymoma, UCEC: uterine corpus endometrial carcinoma, UCS: uterine carcinosarcoma, UVM: uveal melanoma; the median value is represented by the line inside the box and the box expands from the 25th to 75th percentiles with whiskers drawn down to the 2.5 and 97.5 percentiles; samples below 2.5 percentile and above 97.5 percentile are shown as plots; one-way ANOVA with Dunnett’s multiple comparison test; ***P < 0.001 represents the P-values from all the comparisons between AML and any of other 32 non-AML cancer type). g, WB analysis confirming overexpression of 3× Flag-tagged INTS3 in RN2 (MLL-AF9/NrasG12D) leukemia cells (representative results from three biologically independent experiments). h, Colony numbers from serial replating assays of RN2 cells with or without INTS3 overexpression (n = 3; the mean + s.d. represented by lines above the box; two-way ANOVA with Sidak’s multiple comparison test). i, Schematic of INTS3 retroviral BM transplantation models where recipient mice from Cohort 1 were sacrificed at day 18 post-transplant and mice from Cohort 2 were observed for survival analysis until end-stage. j-l, Blood counts (WBC (j); Hb (k); PLT (l)) of mice from Cohort 1 at day 18 post-transplant (the mean ± s.d.; n = 4 (“Empty” group); n = 5 (“INTS3” group) recipient mice; a two-sided Student’s t-test). m, Representative photograph of spleens and livers from Cohort 1 with an inch scale (left), and spleen (middle) and liver weight (right) (n = 4 (Empty); n = 5 (INTS3); the mean ± s.d.; two-sided Student’s t-test). n, o, Representative Giemsa staining (n) (red arrows represent differentiated cells; scale bar, 10 μm; original magnification × 400) and percentages of blasts, differentiated myeloid cells, and other cells in BMMNCs (o) from moribund mice from Cohort 2 (n = 3 per genotype; 100 cells per mouse were classified; the mean percentage + s.d.; two-way ANOVA with Sidak’s multiple comparison test). p, q, Representative flow cytometry analysis of BM, spleen, liver, and PB (p) and percentages of CD45.2+ cells in Ter119 live cells (q) in recipient from Cohort 1 (n = 4 (Empty); n = 5 (INTS3); the mean ± s.d.; two-way ANOVA with Tukey’s multiple comparison test). r, s, Representative flow cytometry analysis showing cKit expression in RN2 cells with or without INTS3 overexpression (r) and quantification of cKit+ cells (s) from Cohort 1 (n = 4 (Empty); n = 5 (INTS3); the mean ± s.d.; one-way ANOVA with Tukey’s multiple comparison test). t, u, Volcano plots of aberrant splicing events in the LGG TCGA dataset based on IDH2 (t) or IDH1 (u) mutant genotypes. |ΔPSI| > 10% and P < 0.01 were used as thresholds (n = 849 and n = 433 differentially spliced events, respectively; RNA-seq data were analyzed using PSI-Sigma). v, Percentage of each class of alternative splicing event in IDH2 (left) and IDH1 (right) mutant LGG is shown in pie-chart. w, Venn diagram of numbers of alternatively spliced events from the LGG TCGA dataset based on IDH1/IDH2 mutant genotypes. “Control” represents LGG with wild-type IDH1 and IDH2. *P < 0.05; **P < 0.01; ***P < 0.001.
Fig. 1 |
Fig. 1 |. Frequent co-existing IDH2 and SRSF2 mutations in acute myeloid leukemia (AML).
a, Heatmap of ΔPSI (Percent-Spliced-In) values for mutant SRSF2-specific splicing events in TCGA AML samples. b-d, Co-occurrence of mutations in IDH1/2, TET2, and RNA splicing factors in the TCGA (b), Beat-AML (c), and Leucegene (d) cohorts (number of patients indicated; co-occurrence or exclusivity noted by color-coding; Fisher’s exact test (two-sided)).
Fig. 2 |
Fig. 2 |. Mutant IDH2 cooperates with mutant Srsf2 to promote leukemogenesis.
a, Chimerism of GFP+ cells in the blood of recipients over time (n = 5 per group; data at 0 week represent transduction efficiency; the mean percentage ± s.d.; two-way ANOVA with Tukey’s multiple comparison test). b-d, Kaplan-Meier survival analysis of primary recipients (b) (n = 10 mice per genotype), recipients of serial transplant (c) (n = 5), and primary recipients transplanted non-competitively with BM cells from knock-in mice (d) (n = 10) (Log-rank (Mantel-Cox) test (two-sided)). e, Chimerism of PB CD45.2+ cells in competitive transplantation (n = 10 mice per group; the mean ± s.d.; two-way ANOVA with Tukey’s multiple comparison test).
Fig. 3 |
Fig. 3 |. Collaborative effects of mutant IDH2 and SRSF2 on aberrant splicing.
a, Venn diagram showing numbers of differentially spliced events from TCGA AML samples. b, Differentially spliced events (|ΔPSI| > 10% and P < 0.01) in indicated genotype are ranked by y-axis ((|ΔPSI × (−Log10(P-value)) and class of event (e5: exon 5; i4/5: intron 4/5) (PSI and P-values adjusted for multiple comparisons were calculated using PSI-Sigma). c, Representative RT-PCR results of aberrantly spliced transcripts in AML patient samples (pEx: exon with premature stop-codon; n = 3 patients per genotype; three technical replicates with similar results). d, RT-PCR and WB of INTS3 in isogenic K562 cells (representative images from three biologically independent experiments with similar results). e, Mean log2 fold-change in DNA cytosine methylation (y-axis) at regions of genomic DNA encoding mRNA which undergo differential splicing (x-axis). DNA methylation levels were determined by eRRBS (n = 3 per genotype; the mean represented by the line inside the box and the box expands from the 25th to 75th percentiles with whiskers drawn down to the 2.5 and 97.5 percentiles; one-way ANOVA with Tukey’s multiple comparison test; ***P < 2.2e-16). f, Diagram of the genomic locus of INTS3 around exons 4–6 with CpG dinucleotides, representative RNA-seq from four AML patients, targeted bisulfite sequencing (n = 1 per genotype), and results of anti-RNAPII-Ser2P ChIP-walking experiments (n = 3; the mean ± s.d.; two-way ANOVA with Tukey’s multiple comparison test). *P < 0.05; **P < 0.01; ***P < 0.001.
Fig. 4 |
Fig. 4 |. RNAPII stalling in IDH2/SRSF2 double-mutant AML and contribution of INTS3 loss to leukemogenesis.
a, Metagene plot of genome-wide RNAPII-Ser5P occupancy in isogenic SRSF2WT or SRSF2P95H mutant cells. b, c, RNAPII pausing index in primary AML samples calculated as the ratio of normalized ChIP-Seq reads of RNAPII-Ser5P on TSSs (± 250 bp) over that of the corresponding bodies (+500 to +1000 from TSSs) (b) and RNAPII abundance over the differentially spliced regions between SRSF2 single-mutant and IDH2/SRSF2 double-mutant AML determined by RNAPII-Ser2P ChIP-seq (y-axis: Log2 (Counts per million)) (c) (x-axis: patient ID; each box plot was generated based on ChIP-seq data from an individual primary AML sample; the mean is represented by the line inside the box and the box expands from the 25th to 75th percentiles with whiskers drawn to 2.5 and 97.5 percentiles; one-way ANOVA with Tukey’s multiple comparison test). d, Colony numbers from serial replating assays of either Mx1-cre Idh2+/+ or Idh2R140Q/+ BM cells transduced with shRNA against Ints3 (n = 3 biologically independent experiments; the mean + s.d.; two-way ANOVA with Tukey’s multiple comparison test). e, g, Kaplan-Meier survival analysis of recipients (n = 5 per group; Log-rank (Mantel-Cox) test (two-sided)). f, RNA-seq read coverage between exons 4–6 of INTS3 ± 1,000 bp of INTS3 is scaled and shown as mean (thick line) ± s.d. (light color) (generated from TCGA datasets; sample list noted in legend for Extended Data Fig. 10e).

References

    1. Cancer Genome Atlas Research, N. et al. Genomic and epigenomic landscapes of adult de novo acute myeloid leukemia. N Engl J Med 368, 2059–2074 (2013). - PMC - PubMed
    1. Papaemmanuil E et al. Clinical and biological implications of driver mutations in myelodysplastic syndromes. Blood 122, 3616–3627 (2013). - PMC - PubMed
    1. Wu Y, Albrecht TR, Baillat D, Wagner EJ & Tong L Molecular basis for the interaction between Integrator subunits IntS9 and IntS11 and its functional importance. Proc Natl Acad Sci U S A 114, 4394–4399 (2017). - PMC - PubMed
    1. Darman RB et al. Cancer-Associated SF3B1 Hotspot Mutations Induce Cryptic 3’ Splice Site Selection through Use of a Different Branch Point. Cell Rep 13, 1033–1045 (2015). - PubMed
    1. Ilagan JO et al. U2AF1 mutations alter splice site recognition in hematological malignancies. Genome Res 25, 14–26 (2015). - PMC - PubMed

Online-only references

    1. Moran-Crusio K et al. Tet2 loss leads to increased hematopoietic stem cell self-renewal and myeloid transformation. Cancer Cell 20, 11–24 (2011). - PMC - PubMed
    1. Shih AH et al. Combination Targeted Therapy to Disrupt Aberrant Oncogenic Signaling and Reverse Epigenetic Dysfunction in IDH2- and TET2-Mutant Acute Myeloid Leukemia. Cancer Discov 7, 494–505 (2017). - PMC - PubMed
    1. Georgiades P et al. VavCre transgenic mice: a tool for mutagenesis in hematopoietic and endothelial lineages. Genesis 34, 251–256 (2002). - PubMed
    1. Zuber J et al. Toolkit for evaluating genes required for proliferation and survival using tetracycline-regulated RNAi. Nat Biotechnol 29, 79–83 (2011). - PMC - PubMed
    1. Lee M et al. Engineered Split-TET2 Enzyme for Inducible Epigenetic Remodeling. J Am Chem Soc 139, 4659–4662 (2017). - PMC - PubMed

Publication types