. 2019 Nov 1;142(11):3440-3455.
doi: 10.1093/brain/awz287.

A quantitative neuropathological assessment of translocator protein expression in multiple sclerosis

Affiliations

A quantitative neuropathological assessment of translocator protein expression in multiple sclerosis

Erik Nutma et al. Brain. .

Abstract

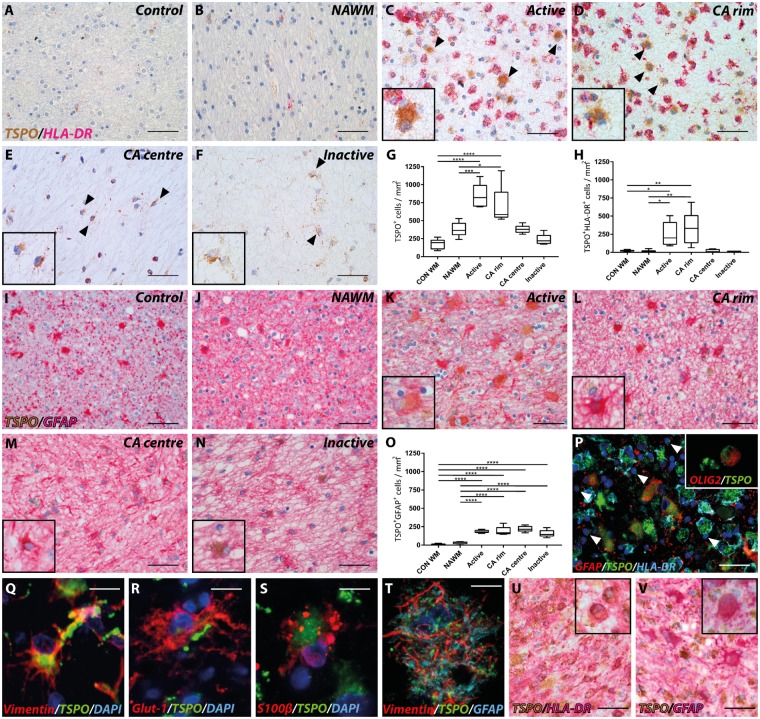
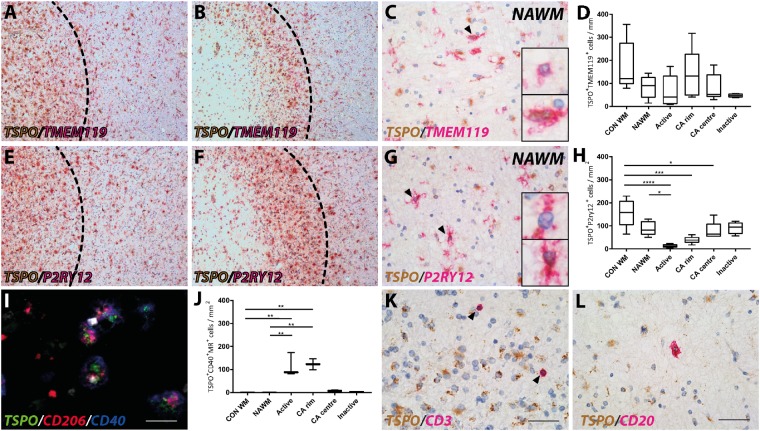
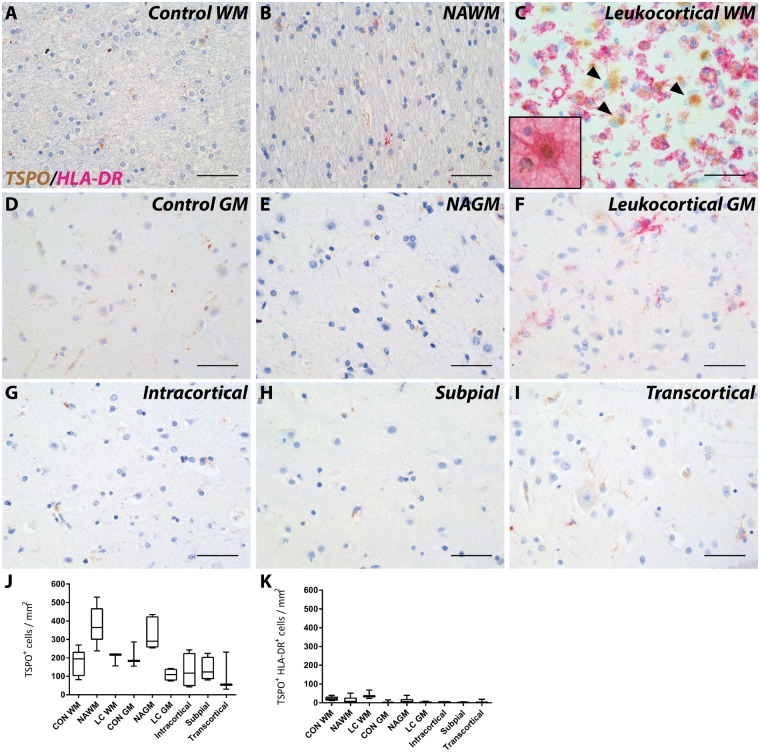
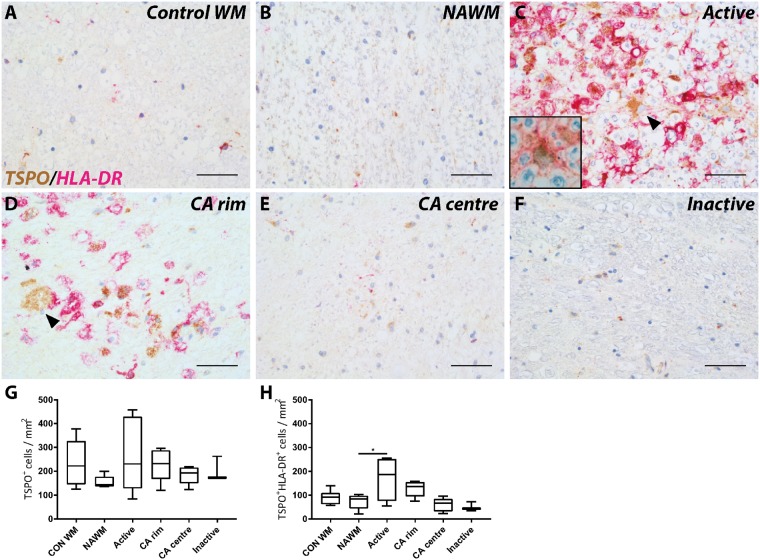
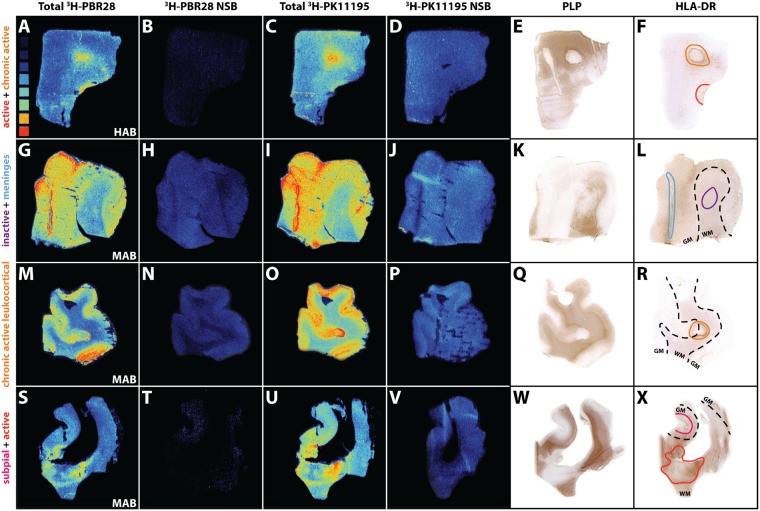
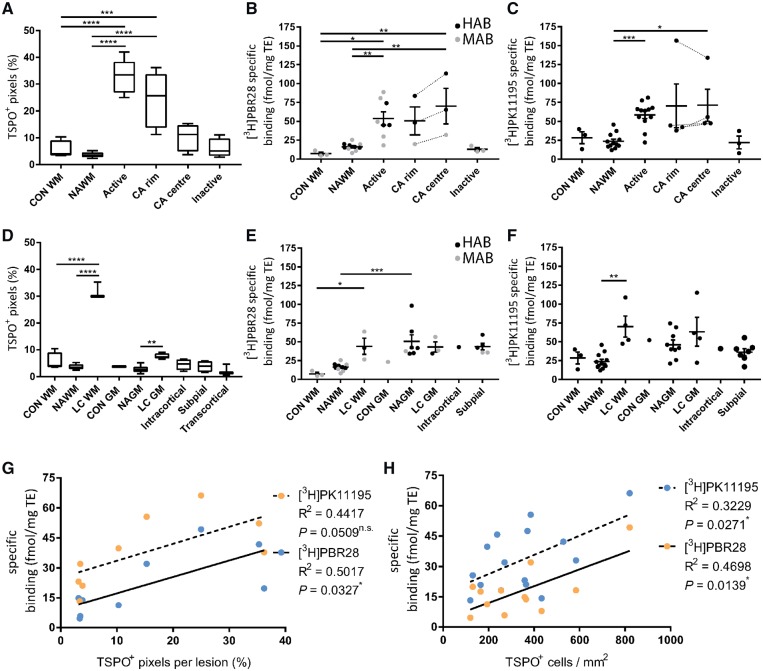
The 18 kDa translocator protein (TSPO) is increasingly used to study brain and spinal cord inflammation in degenerative diseases of the CNS such as multiple sclerosis. The enhanced TSPO PET signal that arises during disease is widely considered to reflect activated pathogenic microglia, although quantitative neuropathological data to support this interpretation have not been available. With the increasing interest in the role of chronic microglial activation in multiple sclerosis, characterising the cellular neuropathology associated with TSPO expression is of clear importance for understanding the cellular and pathological processes on which TSPO PET imaging is reporting. Here we have studied the cellular expression of TSPO and specific binding of two TSPO targeting radioligands (3H-PK11195 and 3H-PBR28) in tissue sections from 42 multiple sclerosis cases and 12 age-matched controls. Markers of homeostatic and reactive microglia, astrocytes, and lymphocytes were used to investigate the phenotypes of cells expressing TSPO. There was an approximate 20-fold increase in cells double positive for TSPO and HLA-DR in active lesions and in the rim of chronic active lesion, relative to normal appearing white matter. TSPO was uniformly expressed across myeloid cells irrespective of their phenotype, rather than being preferentially associated with pro-inflammatory microglia or macrophages. TSPO+ astrocytes were increased up to 7-fold compared to normal-appearing white matter across all lesion subtypes and accounted for 25% of the TSPO+ cells in these lesions. To relate TSPO protein expression to ligand binding, specific binding of the TSPO ligands 3H-PK11195 and 3H-PBR28 was determined in the same lesions. TSPO radioligand binding was increased up to seven times for 3H-PBR28 and up to two times for 3H-PK11195 in active lesions and the centre of chronic active lesions and a strong correlation was found between the radioligand binding signal for both tracers and the number of TSPO+ cells across all of the tissues examined. In summary, in multiple sclerosis, TSPO expression arises from microglia of different phenotypes, rather than being restricted to microglia which express classical pro-inflammatory markers. While the majority of cells expressing TSPO in active lesions or chronic active rims are microglia/macrophages, our findings also emphasize the significant contribution of activated astrocytes, as well as smaller contributions from endothelial cells. These observations establish a quantitative framework for interpretation of TSPO in multiple sclerosis and highlight the need for neuropathological characterization of TSPO expression for the interpretation of TSPO PET in other neurodegenerative disorders.

Keywords: astrocytes; microglia; multiple sclerosis; positron emission tomography; translocator protein.


Figures

Figure 1
Figure 1
Astrocyte and microglial expression of TSPO in white matter lesions. Representative images of TSPO expression in control (A and I) and multiple sclerosis lesions (BF and IN); NAWM (B and J), active (C and K), chronic active (CA) rim (D and L) and centre (E and M), and inactive (F and N) lesions. Expression of TSPO in HLA-DR− cells (black arrowheads; insets CF). Quantitative analysis of number of TSPO+ cells showed a significant increase up to five times in active and in the rim of chronic active lesions compared to control and NAWM (G). An 11- to 14-fold increase in TSPO+HLA-DR+ cells was found in active and the rim of chronic active lesions compared to control and NAWM (H). A 5-fold increase in TPSO+GFAP+ cells was found throughout all lesion stages compared to control and NAWM contributing up to 25% of the TSPO+ cells (IO, insets). An overview of cellular TSPO signal of astrocytes and activated microglia macrophages (P) and oligodendrocytes (P, white arrowheads, inset). Representative images of astrocytic markers with TSPO expression in one multiple sclerosis lesion (QT). Biopsy material showing high TSPO expression in HLA-DR+ and GFAP+ cells (U and V, inset). *P < 0.05; **P < 0.01; ***P < 0.001; ****P < 0.0001. Scale bars in AF, IN, P, U and V = 50 μm; QT = 12.5 μm. Insets are digitally zoomed to ×800.
Figure 2
Figure 2
TSPO expression in microglial phenotypes and lymphocytes. Resident microglia expressing TSPO in an active and chronic active lesion and the periplaque white matter (A and B) as well as in NAWM (C). Resident microglia did not show any significant difference in TSPO expression compared to control or NAWM (D). Overview of expression of the homeostatic marker P2RY12 with TSPO in an active and chronic active lesion and the periplaque white matter (E and F), as well as in NAWM (G). A loss in homeostatic microglia expressing TSPO was found in active and chronic active lesions stages (H). Both TSPO+ and TSPO− microglia were found expressing TMEM119 or P2RY12 in multiple sclerosis lesions (black arrowheads; insets; C and G). In contrast, active and chronic active lesions showed an increase in CD206+CD40+ cells expressing TSPO (I and J). T cells (CD3) showed low expression of TSPO in multiple sclerosis lesions (K) in contrast to B cells (CD20) which showed strong localization with TSPO (L). *P < 0.05; **P < 0.01; ***P < 0.001; ****P < 0.0001. Scale bars in A, B, E and F = 200 μm; C, G, K and L = 50 μm, I = 25 μm. Insets are digitally zoomed to ×800. CA = chronic active.
Figure 3
Figure 3
TSPO expression in grey matter lesions. Representative images of TSPO expression in control (A and D) and multiple sclerosis (B, C and EI) in grey matter lesions; NAWM (B), and NAGM (E); leukocortical white matter (C), and grey matter (F); intracortical (G), subpial (H), and transcortical (I) lesions. Similar to white matter lesions leukocortical white matter lesions showed large TSPO+HLA-DR− cells (black arrowheads; C) which were GFAP+ astrocytes (C, inset). No differences were found in TSPO+ cells in grey matter lesions (J). No significant increase in TSPO+HLA-DR+ cells were found in grey matter lesions compared to control (K). Data are expressed as mean ± SEM. Scale bars in AI = 50 μm. Insets are digitally zoomed to ×800. CON = control; GM = grey matter; LC = leukocortical; WM = white matter.
Figure 4
Figure 4
TSPO expression in white matter lesions in spinal cord. Representative images of TSPO expression in control (A) and multiple sclerosis lesions (BF); NAWM (B), active (C), chronic active (CA) rim (D) and centre (E), and inactive (F) lesions. Expression of TSPO was found in HLA-DR cells (black arrowheads; C and D). GFAP+ astrocytes expressing TSPO were also found in the spinal cord (C, inset). Quantitative analysis of the number of TSPO+ cells did not show significant differences between lesion types compared to control or NAWM (G and H). Increased expression of TSPO in HLA-DR+ cells was found in active lesions compared to NAWM (I). *P < 0.05. Scale bars in AF = 50 μm. Insets are digitally zoomed to ×800. A = active; CON = control.
Figure 5
Figure 5
Overview of 3H-PBR28 and 3H-PK11195 autoradiography of multiple sclerosis lesions. Heat map in A ranges from low to high radioactivity (0.42 tissue equivalent nCi/mg to 16.23 tissue equivalent nCi/mg). Total binding of 3H-PBR28 (A, G, M and S), non-specific binding of 3H-PBR28 (B, H, N and T), total binding of 3H-PK11195 (C, I, O and U), non-specific binding of 3H-PK11195 (D, J, P and V), PLP (E, K, Q and W) and HLA-DR (F, L, R and X) images. LN3 staining denotes areas for active (red), chronic active (orange), inactive (purple) and subpial (pink) lesions, meninges (blue) and the grey and white matter border (dashed lines).
Figure 6
Figure 6
3H-PBR28 and 3H-PK11195 autoradiography of multiple sclerosis lesions. An increase in TSPO+ pixels was found in active and chronic active lesions compared to control and NAWM (A). 3H-PBR28 and 3H-PK11195 binding was increased in active white matter lesions and the centre of chronic active lesions (B and C). For grey matter lesions an increase was found in TSPO+ pixels in leukocortical lesion white matter and grey matter compared to their respective normal appearing tissue (D). Similar to white matter lesions 3H-PBR28 and 3H-PK11195 binding was increased in leukocortical lesion white matter areas (E and F). An increase in specific binding in NAGM relative to NAWM was found for 3H-PBR28. Mixed affinity binders (MAB) are depicted in grey while high affinity binders are depicted in black (HAB). Correlations were found for specific binding of 3H-PBR28 and 3H-PK11195 for both TSPO+ pixels per lesion and TSPO+ cells/mm2 (G and H). CA = chronic active; CON GM = control grey matter; CON WM = control white matter; LC = leukocortical lesion; TE = tissue equivalent.

References

    1. Absinta M, Vuolo L, Rao A, Nair G, Sati P, Cortese IC, et al.Gadolinium-based MRI characterization of leptomeningeal inflammation in multiple sclerosis. Neurology 2015; 85: 18–28. - PMC - PubMed
    1. Agnello D, Carvelli L, Muzio V, Villa P, Bottazzi B, Polentarutti N, et al.Increased peripheral benzodiazepine binding sites and pentraxin 3 expression in the spinal cord during EAE: relation to inflammatory cytokines and modulation by dexamethasone and rolipram. J Neuroimmunol 2000; 109: 105–11. - PubMed
    1. Arlicot N, Katsifis A, Garreau L, Mattner F, Vergote J, Duval S, et al.Evaluation of CLINDE as potent translocator protein (18 kDa) SPECT radiotracer reflecting the degree of neuroinflammation in a rat model of microglial activation. Eur J Nucl Med Mol Imaging 2008; 35: 2203–11. - PubMed
    1. Banati RB, Goerres GW, Myers R, Gunn RN, Turkheimer FE, Kreutzberg GW, et al.[11C](R)-PK11195 positron emission tomography imaging of activated microglia in vivo in Rasmussen’s encephalitis. Neurology 1999; 53: 2199. - PubMed
    1. Banati RB, Newcombe J, Gunn RN, Cagnin A, Turkheimer F, Heppner F, et al.The peripheral benzodiazepine binding site in the brain in multiple sclerosis-quantitative in vivo imaging of microglia as a measure of disease activity. Brain 2000; 123: 2321–37. - PubMed

Publication types

MeSH terms