Readmission Risk Trajectories for Patients With Heart Failure Using a Dynamic Prediction Approach: Retrospective Study
- PMID: 31579025
- PMCID: PMC6781727
- DOI: 10.2196/14756
Readmission Risk Trajectories for Patients With Heart Failure Using a Dynamic Prediction Approach: Retrospective Study
Abstract
Background: Patients hospitalized with heart failure suffer the highest rates of 30-day readmission among other clinically defined patient populations in the United States. Investigation into the predictability of 30-day readmissions can lead to clinical decision support tools and targeted interventions that can help care providers to improve individual patient care and reduce readmission risk.
Objective: This study aimed to develop a dynamic readmission risk prediction model that yields daily predictions for patients hospitalized with heart failure toward identifying risk trajectories over time and identifying clinical predictors associated with different patterns in readmission risk trajectories.
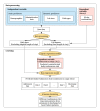
Methods: A two-stage predictive modeling approach combining logistic and beta regression was applied to electronic health record data accumulated daily to predict 30-day readmission for 534 hospital encounters of patients with heart failure over 2750 patient days. Unsupervised clustering was performed on predictions to uncover time-dependent trends in readmission risk over the patient's hospital stay. We used data collected between September 1, 2013, and August 31, 2015, from a community hospital in Maryland (United States) for patients with a primary diagnosis of heart failure. Patients who died during the hospital stay or were transferred to other acute care hospitals or hospice care were excluded.
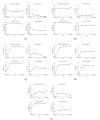
Results: Readmission occurred in 107 (107/534, 20.0%) encounters. The out-of-sample area under curve for the 2-stage predictive model was 0.73 (SD 0.08). Dynamic clinical predictors capturing laboratory results and vital signs had the highest predictive value compared with demographic, administrative, medical, and procedural data included. Unsupervised clustering identified four risk trajectory groups: decreasing risk (131/534, 24.5% encounters), high risk (113/534, 21.2%), moderate risk (177/534, 33.1%), and low risk (113/534, 21.2%). The decreasing risk group demonstrated change in average probability of readmission from admission (0.69) to discharge (0.30), whereas the high risk (0.75), moderate risk (0.61), and low risk (0.39) groups maintained consistency over the hospital course. A higher level of hemoglobin, larger decrease in potassium and diastolic blood pressure from admission to discharge, and smaller number of past hospitalizations are associated with decreasing readmission risk (P<.001).
Conclusions: Dynamically predicting readmission and quantifying trends over patients' hospital stay illuminated differing risk trajectory groups. Identifying risk trajectory patterns and distinguishing predictors may shed new light on indicators of readmission and the isolated effects of the index hospitalization.
Keywords: forecasting; heart failure; machine learning; patient readmission.
©Wei Jiang, Sauleh Siddiqui, Sean Barnes, Lili A Barouch, Frederick Korley, Diego A Martinez, Matthew Toerper, Stephanie Cabral, Eric Hamrock, Scott Levin. Originally published in JMIR Medical Informatics (http://medinform.jmir.org), 05.10.2019.
Conflict of interest statement
Conflicts of Interest: None declared.
Figures


Similar articles
-
Trends in Readmissions and Length of Stay for Patients Hospitalized With Heart Failure in Canada and the United States.JAMA Cardiol. 2019 May 1;4(5):444-453. doi: 10.1001/jamacardio.2019.0766. JAMA Cardiol. 2019. PMID: 30969316 Free PMC article.
-
Trajectories of risk after hospitalization for heart failure, acute myocardial infarction, or pneumonia: retrospective cohort study.BMJ. 2015 Feb 5;350:h411. doi: 10.1136/bmj.h411. BMJ. 2015. PMID: 25656852 Free PMC article.
-
Development, Validation and Deployment of a Real Time 30 Day Hospital Readmission Risk Assessment Tool in the Maine Healthcare Information Exchange.PLoS One. 2015 Oct 8;10(10):e0140271. doi: 10.1371/journal.pone.0140271. eCollection 2015. PLoS One. 2015. PMID: 26448562 Free PMC article.
-
Predictive models for identifying risk of readmission after index hospitalization for heart failure: A systematic review.Eur J Cardiovasc Nurs. 2018 Dec;17(8):675-689. doi: 10.1177/1474515118799059. Epub 2018 Sep 7. Eur J Cardiovasc Nurs. 2018. PMID: 30189748
-
Predictive Analytics in Heart Failure Risk, Readmission, and Mortality Prediction: A Review.Cureus. 2024 Nov 17;16(11):e73876. doi: 10.7759/cureus.73876. eCollection 2024 Nov. Cureus. 2024. PMID: 39697926 Free PMC article. Review.
Cited by
-
Predicting falls-related admissions in older adults in Alberta, Canada: a machine-learning falls prevention tool developed using population administrative health data.BMJ Open. 2023 Aug 22;13(8):e071321. doi: 10.1136/bmjopen-2022-071321. BMJ Open. 2023. PMID: 37607796 Free PMC article.
-
Explainable Tree-Based Predictions for Unplanned 30-Day Readmission of Patients With Cancer Using Clinical Embeddings.JCO Clin Cancer Inform. 2021 Feb;5:155-167. doi: 10.1200/CCI.20.00127. JCO Clin Cancer Inform. 2021. PMID: 33539176 Free PMC article.
-
Dynamic risk stratification using Markov chain modelling in patients with chronic heart failure.ESC Heart Fail. 2022 Oct;9(5):3009-3018. doi: 10.1002/ehf2.14028. Epub 2022 Jun 23. ESC Heart Fail. 2022. PMID: 35736536 Free PMC article.
-
Predicting 30-Day Readmission Risk for Patients With Chronic Obstructive Pulmonary Disease Through a Federated Machine Learning Architecture on Findable, Accessible, Interoperable, and Reusable (FAIR) Data: Development and Validation Study.JMIR Med Inform. 2022 Jun 2;10(6):e35307. doi: 10.2196/35307. JMIR Med Inform. 2022. PMID: 35653170 Free PMC article.
-
Comparing Machine Learning Classifiers for Predicting Hospital Readmission of Heart Failure Patients in Rwanda.J Pers Med. 2023 Sep 18;13(9):1393. doi: 10.3390/jpm13091393. J Pers Med. 2023. PMID: 37763160 Free PMC article.
References
-
- Ambrosy AP, Fonarow GC, Butler J, Chioncel O, Greene SJ, Vaduganathan M, Nodari S, Lam CS, Sato N, Shah AN, Gheorghiade M. The global health and economic burden of hospitalizations for heart failure: lessons learned from hospitalized heart failure registries. J Am Coll Cardiol. 2014 Apr 1;63(12):1123–33. doi: 10.1016/j.jacc.2013.11.053. https://linkinghub.elsevier.com/retrieve/pii/S0735-1097(14)00291-5 - DOI - PubMed
-
- Centers for Medicare and Medicaid Services. [2019-07-12]. Hospital Readmissions Reduction Program (HRRP) https://www.cms.gov/medicare/medicare-fee-for-service-payment/acuteinpat....
-
- Futoma J, Morris J, Lucas J. A comparison of models for predicting early hospital readmissions. J Biomed Inform. 2015 Aug;56:229–38. doi: 10.1016/j.jbi.2015.05.016. https://linkinghub.elsevier.com/retrieve/pii/S1532-0464(15)00096-9 - DOI - PubMed
-
- Cholleti S, Post A, Gao J, Lin X, Bornstein W, Cantrell D, Saltz J. Leveraging derived data elements in data analytic models for understanding and predicting hospital readmissions. AMIA Annu Symp Proc. 2012;2012:103–11. http://europepmc.org/abstract/MED/23304278 - PMC - PubMed
LinkOut - more resources
Full Text Sources
Miscellaneous

