. 2019:91:10.1103/RevModPhys.91.021004.
doi: 10.1103/RevModPhys.91.021004.

Colloquium: Ionic phenomena in nanoscale pores through 2D materials

Affiliations

Colloquium: Ionic phenomena in nanoscale pores through 2D materials

Subin Sahu et al. Rev Mod Phys. 2019.

Abstract

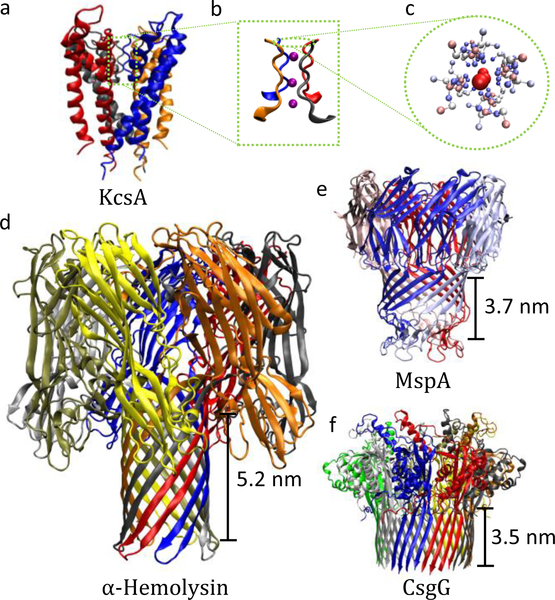
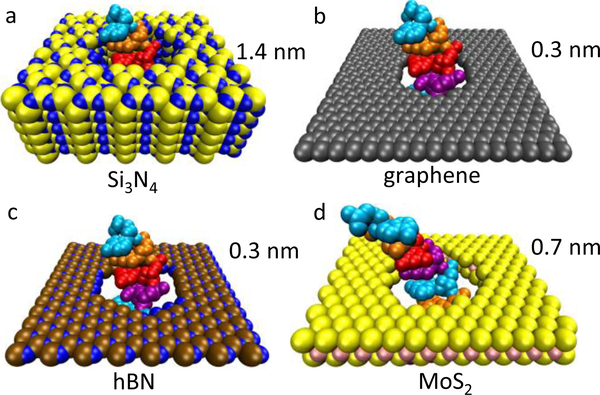
Ion transport through nanopores permeates through many areas of science and technology, from cell behavior to sensing and separation to catalysis and batteries. Two-dimensional materials, such as graphene, molybdenum disulfide (MoS2), and hexagonal boron nitride (hBN), are recent additions to these fields. Low-dimensional materials present new opportunities to develop filtration, sensing, and power technologies, encompassing ion exclusion membranes, DNA sequencing, single molecule detection, osmotic power generation, and beyond. Moreover, the physics of ionic transport through pores and constrictions within these materials is a distinct realm of competing many-particle interactions (e.g., solvation/dehydration, electrostatic blockade, hydrogen bond dynamics) and confinement. This opens up alternative routes to creating biomimetic pores and may even give analogues of quantum phenomena, such as quantized conductance, in the classical domain. These prospects make membranes of 2D materials - i.e., 2D membranes - fascinating. We will discuss the physics and applications of ionic transport through nanopores in 2D membranes.


Figures

FIG. 1
FIG. 1
Examples of biological ion channels. (a) The wellknown potassium-selective channel KcsA. (b) Enlarged view of its selectivity filter with translocating K+ ions (purple). (c) Top view of the selectivity filter. Colors indicate the atom charge from red (positive) to white (neutral) to blue (negative). (d-f) Various biological pores for DNA sequencing studies. The length of the β-barrel – the approximate sensing region – is next to each channel. Shorter sensing regions are more successful in sequencing due to their higher spatial resolution. Colors indicate individual protein subunits.
FIG. 2
FIG. 2
Single-stranded DNA translocating through various pores. (a) SiNx (shown as Si3N4) pore at its minimum thickness (1.4 nm) so far achieved (Rodríguez-Manzo et al., 2015). Almost all traditional solid-state membranes (including SiO2 and other materials) are much thicker, giving pores 10 nm in length or longer. Three membranes with atomic or nearatomic thickness are (b) graphene, (c) hBN, and (d) MoS2.
FIG. 3
FIG. 3
Pores in 2D membranes. (a) Graphene pore of “radius” 0.19 nm fabricated via ion bombardment and chemical etching. From O’Hern et al. (2014). (b) MoS2 pore of “radius” 0.3 nm made via electrochemical breakdown. From Feng et al. (2016b). (c) hBN pore from electron beam irradiation. From Ryu et al. (2015). (d) Scatter plot of the blockade current/duration for 10-kilobase dsDNA translocation through a graphene pore of diameter 5 nm. The insets give events for partially folded (left) and unfolded (right) configurations. The electronic charge deficit (e.c.d.) indicates that, e.g., single folds block twice the charge but for half the time, giving a constant total blockade for the event. Adapted from Garaj et al. (2010).
FIG. 4
FIG. 4
“Atom-by-atom” techniques for graphene nanopore fabrication. In step 1, an ion beam (Russo and Golovchenko, 2012) or a high-voltage electric pulse (Kuan et al., 2015; Kwok et al., 2014) creates a one- or two-atom defect in a suspended graphene sheet. In step 2, the defect expands to a pore by exposure to an electron beam, chemical etching (e.g., with KOH), or a low-voltage electric pulse.
FIG. 5
FIG. 5
Series representation of the ionic resistance. (a) The fluidic cell. The membrane (dark gray), whether composed of a 2D material, a traditional solid-state material, a biological membrane (e.g., lipid bilayer), or some combination (often a windowed SiNx membrane with a 2D material over top), separates two ionic solutions. An applied voltage (via two electrodes, light gray) across the membrane drives an ionic current through the pore. The equivalent circuit shows the access resistance (Raccess, blue resistors, equal for symmetric electrolytes) and the pore resistance (Rpore, red resistor). (b) Equipotential surfaces from a continuum simulation. The access region develops hemispherical – more accurately, spheroidal – surfaces, essentially showing that the bulk converges “radially” inward toward the pore. Within long, homogeneous pores with a symmetric electrolyte, flat potential surfaces develop and ions are flowing along the pore axis. This region is of “negligible” length in 2D membranes, creating an interesting competition between asymmetric electrolytes, imperfect geometries and fluctuations, dehydration, screening, and, potentially, functional groups.
FIG. 6
FIG. 6
Open pore conductance (1/R) versus pore radius a in graphene from experiment and MD simulations. We fit the published data using Eq. 5 with λ (the weight of access contribution) and hpeff (the effective membrane thickness) as fitting parameters [shown as the pair (λ,hpeff) next to the fitted lines. We use a resistivity of γ = 0.095Ωm for experiments (Garaj et al., 2010; Schneider et al., 2010, 2013) and MD with SPC/E water (Hu et al., 2012), γ = 0.071Ωm for MD with TIP3P rigid water (Sahu and Zwolak, 2018b), and γ = 0.081Ωm for MD with TIP3P flexible water (Sahu et al., 2017; Sathe et al., 2011). Results from Garaj et al. (2010) fit with the classical model with hpeff1 nm as expected for graphene membrane. The results from Schneider et al. (2010) give an hpeff 10 times larger, in part due to including many layer graphene pores (we note that the best fit gives both access and pore contributions, unlike their finding that it has only a pore contribution). However, their follow-up results (Schneider et al., 2013) fit with the classical model and give an hpeff consistent with other work. MD results by Sathe et al. (2011) and Sahu et al. (2017) give a small λ and large hpeff. Hu et al. (2012) found a small conductance, see the text. Recently, Sahu and Zwolak (2018b) demonstrated that a finite-size scaling of the simulation cell and a pore-size correction accounting for hydration yield MD results in the classical form. The deviation of this result from experiment is solely due to the bulk conductivity given by MD. The fit errors are in the SM.
FIG. 7
FIG. 7
Current density J normalized with respect to its flat region. The effective pore radius a = 1.08 nm is shown by the vertical black arrow; a pore with radius a and a uniform current density J¯ gives the same total current as the exact distribution, πa2J¯=I. The green arrow shows the largest circle going to the atom locations (rn) and the red arrow shows the largest circle going to atom locations minus the vdW radius of carbon (rp). The inset shows the structure of the pore in the vdW representation and the scatter plot of ions crossing the pore (Sahu and Zwolak, 2018b).
FIG. 8
FIG. 8
Change in resistance, ΔR, versus pore radius, a, due to current blockade by (a) dsDNA in SiNx (Kowalczyk et al., 2011), (b) dsDNA in graphene (Garaj et al., 2013), and (c) single A nucleotide in MoS2 (Feng et al., 2015a). The open pore resistance is taken as R = Raccess + Rpore, where Raccess = γ/2a and Rpore=γhpeff/πa2. The blockade resistance is thus ΔR = ΔRaccessRpore, where ΔRaccess and ΔRpore are changes in their respective resistances due to a change in pore radius to a=a2aDNA2. We see that, for small pores, ΔR ≈ ΔRpore and, for large pores, ΔR ≈ ΔRaccess. The transition from ΔRpore to ΔRaccess occurs when a & 4hp (assuming a ≫ aDNA), as indicated by the arrows. The model works really well for SiNx (without fitting parameters) and reasonably for MoS2, but only marginal for graphene (potentially due to sampleto-sample variation in pore structure/functionalization). For graphene and MoS2, we use γ as a fitting parameter due to the unknown local ion concentration during the blockade event. Error bars are shown when reported in the original article.
FIG. 9
FIG. 9
K+ (purple) translocating through mono- (left) and bi-layer (right) graphene pores (geometric radii of 0.2 nm and 0.16 nm, respectively). The carbon atoms are shown as smaller gray spheres (not the vdW radii like the other atoms) along with the carbon-carbon bond. For pores of this size, ions cannot retain the complete hydration shell when translocating. For monolayer graphene, K+ loses roughly two water molecules from its first hydration shell but still retains four closely bound water molecules just outside the membrane [large red (O) and small white (H) spheres]. For bilayer graphene, however, water molecules can hydrate only on the “two ends” of the ion, which gives a substantially larger energy barrier. Tri-layer graphene further limits hydration. The bottom panel shows the K+ over Cl selectivity (given by the ratio of their currents, IK/ICl) in graphene pores versus the geometric radius. The multilayer graphene is AB stacked, which influences the allowed radii. All data points are from nonequilibrium MD simulations (Sahu et al., 2017; Sahu and Zwolak, 2017) except for the smallest pore in bi- (dashed line) and tri-layer graphene (dotted line), which were estimated from free-energy barriers. Lines are a guide to the eye only.
FIG. 10
FIG. 10
Observations of dehydration-based selectivity in 2D membranes. (a) Membrane potential versus etch time (pore radius) showing weak selectivity in subnanoscale graphene pores (O’Hern et al., 2014), consistent with dehydration. (b) Schematic of permeation through GO layers in the experiments by Abraham et al. (2017). (c) Permeation rate, P, in units of P0 = 1 mol h−1m−2, of water and ions for the variable interlayer separation in (b). For water, the permeation increases linearly with increasing interlayer spacing, whereas for ions it increases exponentially. (d) Permeation rate for K+ ions in (b) versus temperature showing Arrhenius behavior. All dashed connecting lines are guides to the eye only.
FIG. 11
FIG. 11
Saturation of the ionic current due to membrane charge. (a) Conductance versus ion concentration in a stacked graphene-Al2O3 pore of diameter 8 nm and length hp = 20 nm, where the surface charge is controlled by varying the pH of the solution (Venkatesan et al., 2012). The two continuous lines show the conductance with no surface charge and with surface charge obtained by fitting data for pH 10.9 to Eq. (22). (b) Conductance versus ion concentration in the bacterial porin OmpF (Alcaraz et al., 2017). The membrane surface needs to be charged (green circles) for the current to saturate, whereas for pore charge only (blue triangles) it does not saturate. Dashed lines are guides to the eye only.
FIG. 12
FIG. 12
Charged-based selectivity. (a) Selectivity increase with pH (graphene and hBN) and (b) with Debye length (graphene) (Walker et al., 2017). (c) A sharp increase in K+ selectivity with pH for a graphene pore of diameter 3 nm and, (d) ion selectivity in graphene pores from several devices (shown with different markers) (Rollings et al., 2016). Dashed lines are guides to the eye only.
FIG. 13
FIG. 13
Some examples of functionalized graphene pores: (a) hydrogen (white) terminated and (b) fluorine-nitrogen (blue-green) terminated graphene nanopores (Sint et al., 2008). (c) Hydrogenated and (d) hydroxylated graphene pores (Cohen-Tanugi and Grossman, 2012). Graphene nanopores functionalized with (e) four carbonyl, (f) four carboxylate, and (g) three carboxylate groups (He et al., 2013). (h) Crown-ether graphene (Guo et al., 2014). The pores in (a-g) are hypothetical but variants of (h) have been seen in experiment.
FIG. 14
FIG. 14
Colossal mechano-conductance and optimal transport in a graphene crown ether pore (bottom inset) (Sahu et al., 2019). Each oxygen and carbon at the pore rim has partial charge −0.24e and 0.12e, respectively. The top inset shows the effective dielectric constant (ϵr) near the pore center. Small changes in the pore size (i.e., 1 % to 2 %) due to strain result in a large (i.e., 200 % to 300 %) change in current. This is driven by a flattening of ΔF versus z – i.e., a tendency toward barrierless transport – but ultimately the charged groups do not compensate for dehydration and a larger barrier decreases I.
FIG. 15
FIG. 15
Water desalination using a graphene membrane. (a) Schematic of the setup and (b) selectivity of water over salt versus defect density ID/IG (Surwade et al., 2015). Due to extended exposure, defect sizes increase with their density. The dashed line is a guide to the eye only.
FIG. 16
FIG. 16
Schematic of DNA sequencing via the transverse current. As a DNA translocates electrophoretically (or by other means), the nucleotide in the pore modulates the in-plane current through the graphene, identifying the base present.

Similar articles

Cited by

References

    1. Abraham J, Vasu KS, Williams CD, Gopinadhan K, Su Y, Cherian CT, Dix J, Prestat E, Haigh SJ, Grigorieva IV, et al. (2017), Nat. Nanotech 12, 546. - PubMed
    1. Ackerman MJ, and Clapham DE (1997), N. Engl. J. Med 336, 1575. - PubMed
    1. Aguilella-Arzo M, Aguilella VM, and Eisenberg RS (2005), Eur. Biophys. J 34, 314. - PubMed
    1. Akahori R, Yanagi I, Goto Y, Harada K, Yokoi T, and Takeda K.-i. (2017), Sci. Rep 7, 9073. - PMC - PubMed
    1. Akeson M, Branton D, Kasianowicz JJ, Brandin E, and Deamer DW (1999), Biophys. J 77, 3227. - PMC - PubMed

LinkOut - more resources