. 2019 Sep 19:7:e7487.
doi: 10.7717/peerj.7487. eCollection 2019.

Ankle and midtarsal joint quasi-stiffness during walking with added mass

Affiliations

Ankle and midtarsal joint quasi-stiffness during walking with added mass

Andrew M Kern et al. PeerJ. .

Abstract

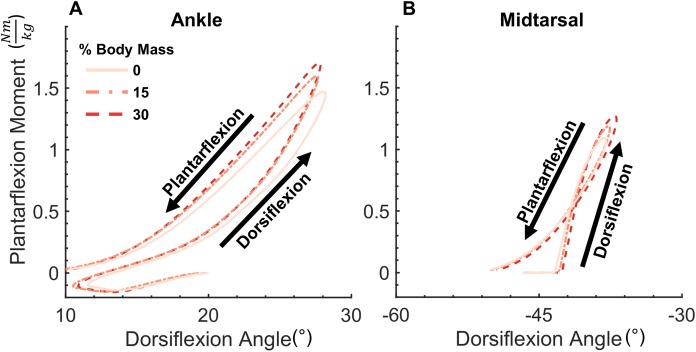
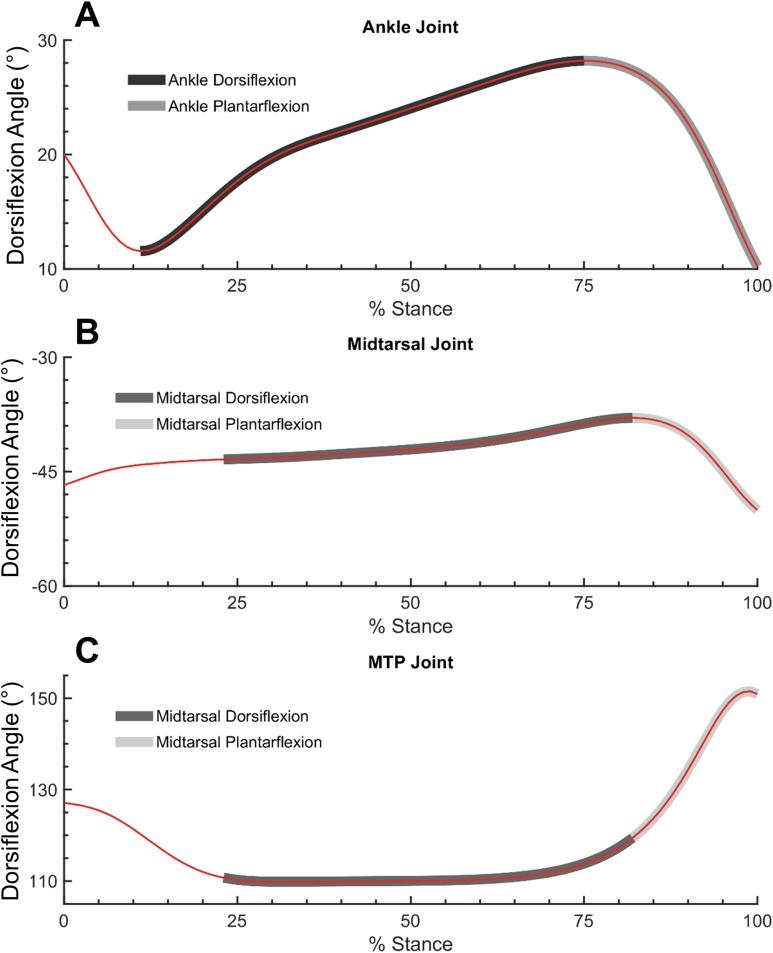
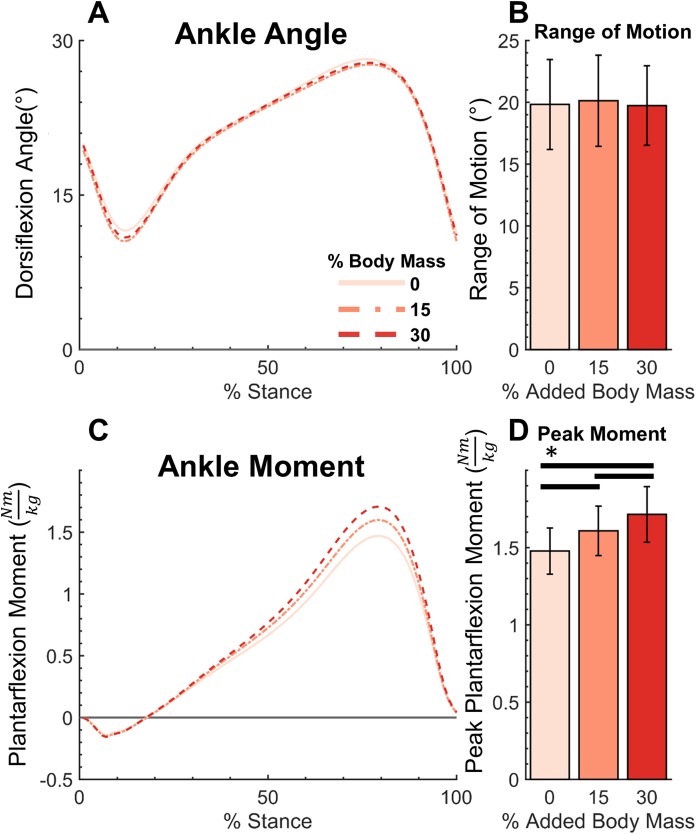
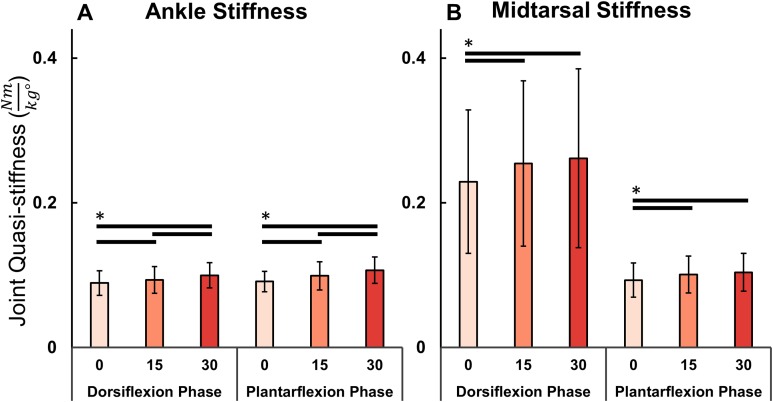
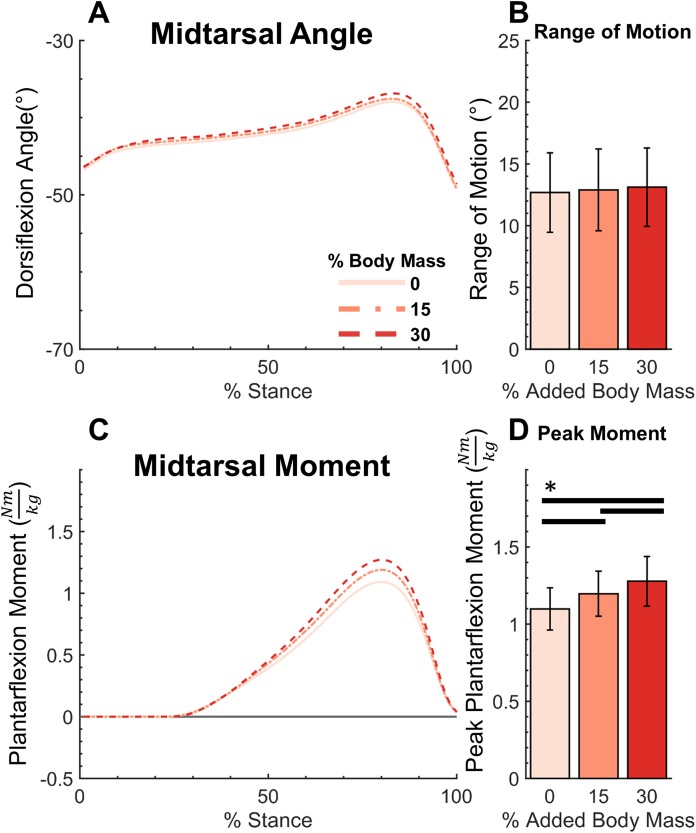
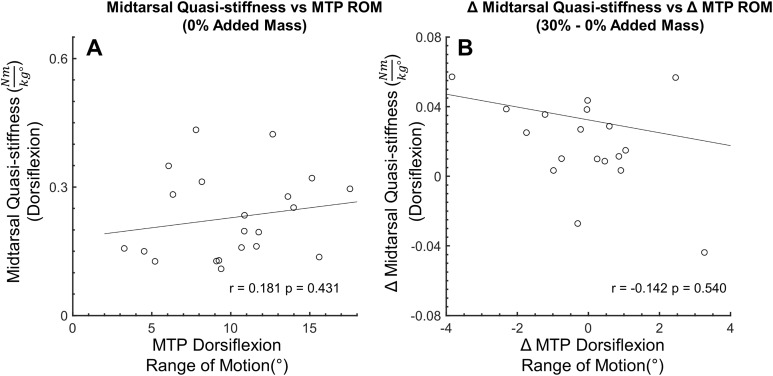
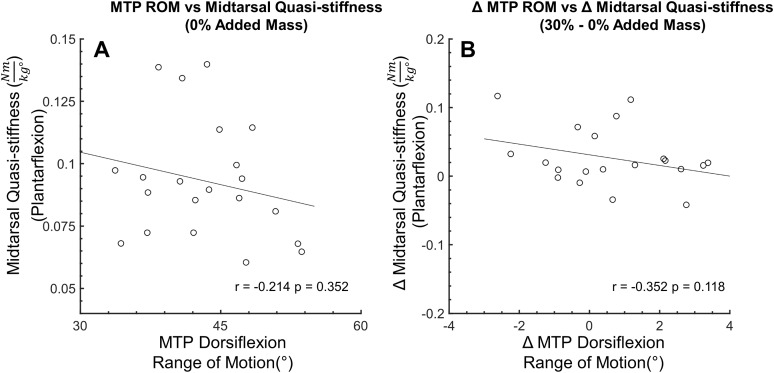
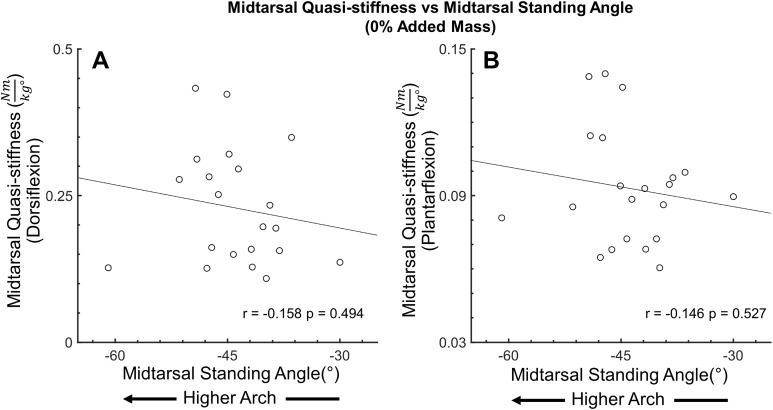
Examination of how the ankle and midtarsal joints modulate stiffness in response to increased force demand will aid understanding of overall limb function and inform the development of bio-inspired assistive and robotic devices. The purpose of this study is to identify how ankle and midtarsal joint quasi-stiffness are affected by added body mass during over-ground walking. Healthy participants walked barefoot over-ground at 1.25 m/s wearing a weighted vest with 0%, 15% and 30% additional body mass. The effect of added mass was investigated on ankle and midtarsal joint range of motion (ROM), peak moment and quasi-stiffness. Joint quasi-stiffness was broken into two phases, dorsiflexion (DF) and plantarflexion (PF), representing approximately linear regions of their moment-angle curve. Added mass significantly increased ankle joint quasi-stiffness in DF (p < 0.001) and PF (p < 0.001), as well as midtarsal joint quasi-stiffness in DF (p < 0.006) and PF (p < 0.001). Notably, the midtarsal joint quasi-stiffness during DF was ~2.5 times higher than that of the ankle joint. The increase in midtarsal quasi-stiffness when walking with added mass could not be explained by the windlass mechanism, as the ROM of the metatarsophalangeal joints was not correlated with midtarsal joint quasi-stiffness (r = -0.142, p = 0.540). The likely source for the quasi-stiffness modulation may be from active foot muscles, however, future research is needed to confirm which anatomical structures (passive or active) contribute to the overall joint quasi-stiffness across locomotor tasks.

Keywords: Ankle joint; Arch; Biomechanics; Foot; Locomotion; Midtarsal joint; Windlass mechanism.


Conflict of interest statement

The authors declare that they have no competing interests.

Figures

Figure 1
Figure 1. Ankle and midtarsal joint quasi-stiffness across all levels of added mass.
Average moment-angle curves for all 21 subjects for ankle (A) and midtarsal (B) joints. Joint quasi-stiffness was quantified in each subject by performing a linear fit in two phases of stance (dorsiflexion and plantarflexion) for each joint. The slope of each linear fit is reported as the quasi-stiffness value.
Figure 2
Figure 2. Ankle, midtarsal and metatarsophalangeal joint dorsiflexion angles during dorsiflexion and plantarflexion.
Ankle (A), midtarsal (B) and metatarsophalangeal (MTP) joint (C) dorsiflexion angles. Dark gray overlay shows dorsiflexion phase for ankle (A) and midtarsal joint (B and C). Light gray overlay shows plantarflexion phase for ankle (A) and midtarsal joint (B and C).
Figure 3
Figure 3. Ankle moment, angle, range of motion and peak moment for added body mass conditions.
Ankle dorsiflexion angle (A), range of motion (B), plantarflexion moment (C), and peak moment (D). Added body mass significantly increased peak moment (p < 0.001), but not ankle range of motion (p = 0.447). Brackets indicate significance of pairwise tests (p < 0.05).
Figure 4
Figure 4. Ankle and midtarsal joint stiffness during dorsiflexion and plantarflexion.
Ankle (A) and midtarsal (B) quasi-stiffness across dorsiflexion (DF) and plantarflexion (PF) phases for all three levels of added mass (0%: blue, 15%: green, 30%: red). A significant effect of increased body mass on quasi-stiffness was found on the ankle in DF (p < 0.001) and PF (p < 0.001), and in the midtarsal joint in both DF (p = 0.006) and PF (p < 0.001). Brackets indicate significance of pairwise tests (p < 0.05).
Figure 5
Figure 5. Midtarsal moment, angle, range of motion and peak moment for added body mass conditions.
Midtarsal dorsiflexion angle (A), range of motion (B), plantarflexion moment (C), and peak moment (D). Added body mass significantly increased peak moment (p < 0.001), but not range of motion (p = 0.275). Brackets indicate significance of pairwise tests (p < 0.05).
Figure 6
Figure 6. Secondary analysis of metatarsophalangeal joint ROM and midtarsal joint stiffness during dorsiflexion.
Secondary analysis examining the relationship between midtarsal quasi-stiffness and metatarsophalangeal joint (MTP) range of motion (ROM) during midtarsal joint dorsiflexion phase. MTP ROM is defined as the difference between the minimum and maximum joint angle within the dorsiflexion phase. No significant relationship was found between MTP ROM and MT joint stiffness (A) or between change in MTP ROM and change in MT joint stiffness (B), suggesting that factors other than MTP dorsiflexion (and the windlass mechanism) were important in modulating MT joint stiffness.
Figure 7
Figure 7. Secondary analysis of metatarsophalangeal joint ROM and midtarsal joint stiffness during plantarflexion.
Secondary analysis examining the relationship between midtarsal quasi-stiffness and metatarsophalangeal joint (MTP) range of motion (ROM) during midtarsal joint plantarflexion phase. MTP ROM is defined as the difference between the minimum and maximum joint angle across stance. No significant relationship was found between MTP ROM and MT joint stiffness (A) or between change in MTP ROM and change in MT joint stiffness (B).
Figure 8
Figure 8. Secondary analysis of midtarsal joint standing angle and midtarsal quasi-stiffness in dorsiflexion and plantarflexion.
Secondary analysis exploring the relationship between midtarsal quasi-stiffness and midtarsal standing angle (arch height) during dorsiflexion phase (A) and plantarflexion phase (B). There was no significant relationship between standing midtarsal angle and midtarsal quasi-stiffness.

References

    1. Argunsah Bayram H, Bayram MB. Dynamic functional stiffness index of the ankle joint during daily living. Journal of Foot & Ankle Surgery. 2018;57(4):668–674. doi: 10.1053/j.jfas.2017.11.034. - DOI - PubMed
    1. Bojsen-Møller F. Calcaneocuboid joint and stability of the longitudinal arch of the foot at high and low gear push off. Journal of Anatomy. 1979;129:165–176. - PMC - PubMed
    1. Bruening DA, Cooney KM, Buczek FL. Analysis of a kinetic multi-segment foot model. Part I: model repeatability and kinematic validity. Gait & Posture. 2012a;35(4):529–534. doi: 10.1016/j.gaitpost.2011.10.363. - DOI - PubMed
    1. Bruening DA, Cooney KM, Buczek FL. Analysis of a kinetic multi-segment foot model part II: kinetics and clinical implications. Gait & Posture. 2012b;35(4):535–540. doi: 10.1016/j.gaitpost.2011.11.012. - DOI - PubMed
    1. Bruening DA, Pohl MB, Takahashi KZ, Barrios JA. Midtarsal locking, the windlass mechanism, and running strike pattern: a kinematic and kinetic assessment. Journal of Biomechanics. 2018;73:185–191. doi: 10.1016/j.jbiomech.2018.04.010. - DOI - PMC - PubMed

LinkOut - more resources