

Mitigation efforts will not fully alleviate the increase in water scarcity occurrence probability in wheat-producing areas
- PMID: 31579815
- PMCID: PMC6760931
- DOI: 10.1126/sciadv.aau2406
Mitigation efforts will not fully alleviate the increase in water scarcity occurrence probability in wheat-producing areas
Abstract
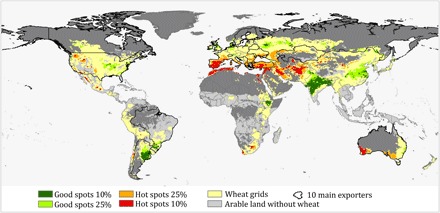
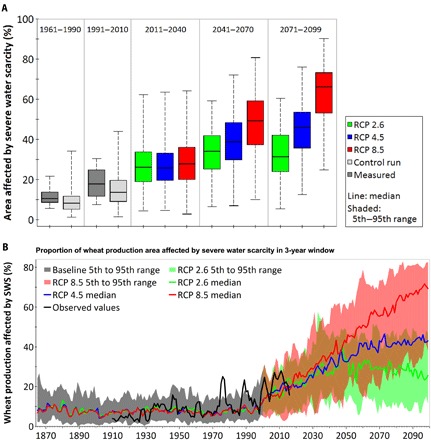
Global warming is expected to increase the frequency and intensity of severe water scarcity (SWS) events, which negatively affect rain-fed crops such as wheat, a key source of calories and protein for humans. Here, we develop a method to simultaneously quantify SWS over the world's entire wheat-growing area and calculate the probabilities of multiple/sequential SWS events for baseline and future climates. Our projections show that, without climate change mitigation (representative concentration pathway 8.5), up to 60% of the current wheat-growing area will face simultaneous SWS events by the end of this century, compared to 15% today. Climate change stabilization in line with the Paris Agreement would substantially reduce the negative effects, but they would still double between 2041 and 2070 compared to current conditions. Future assessments of production shocks in food security should explicitly include the risk of severe, prolonged, and near-simultaneous droughts across key world wheat-producing areas.
Copyright © 2019 The Authors, some rights reserved; exclusive licensee American Association for the Advancement of Science. No claim to original U.S. Government Works. Distributed under a Creative Commons Attribution NonCommercial License 4.0 (CC BY-NC).
Figures

References
-
- N. Alexandratos, J. Bruinsma, World Agriculture Towards 2030/2050: The 2012 Revision (Food Agri Org United Nations, Rome, 2012).
-
- van Ittersum M. K., van Bussel L. G. J., Wolf J., Grassini P., van Wart J., Guilpart N., Claessens L., de Groot H., Wiebe K., Mason-D’Croz D., Yang H., Boogaard H., van Oortf P. A. J., van Loon M. P., Saito K., Adimo O., Adjei-Nsiah S., Agali A., Bala A., Chikowo R., Kaizzi K., Kouressy M., Makoi J. H. J. R., Ouattara K., Tesfaye K., Cassman K. G., Can sub-Saharan Africa feed itself? Proc. Natl. Acad. Sci. U.S.A. 113, 14964–14969 (2016). - PMC - PubMed
-
- J. von Braun, The World Food Situation: New Driving Forces and Required Actions (Food Policy Report, Washington, DC, 2008).
-
- Leff B., Ramankutty N., Foley J. A., Geographic distribution of major crops across the world. Global Biogeochem. Cy. 18, 1–27 (2004).
Publication types
MeSH terms
Substances
LinkOut - more resources
Full Text Sources
Medical
