. 2019 Sep 25;5(9):eaaw0759.
doi: 10.1126/sciadv.aaw0759. eCollection 2019 Sep.

Initial soil microbiome composition and functioning predetermine future plant health

Affiliations

Initial soil microbiome composition and functioning predetermine future plant health

Zhong Wei et al. Sci Adv. .

Abstract

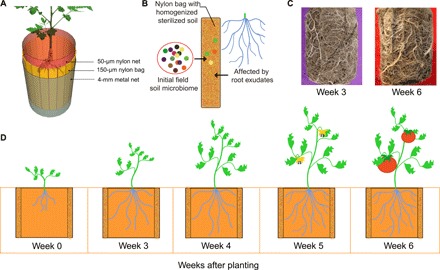
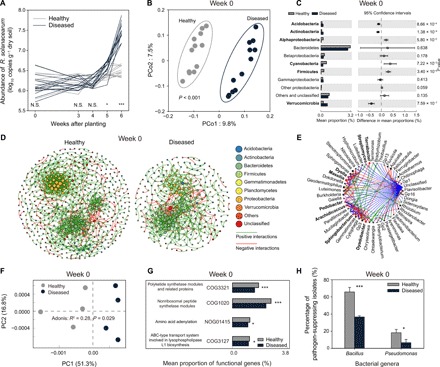
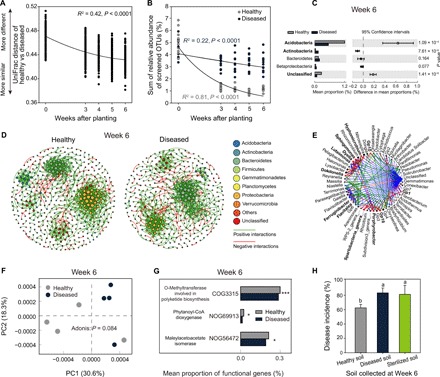
Plant-pathogen interactions are shaped by multiple environmental factors, making it difficult to predict disease dynamics even in relatively simple agricultural monocultures. Here, we explored how variation in the initial soil microbiome predicts future disease outcomes at the level of individual plants. We found that the composition and functioning of the initial soil microbiome predetermined whether the plants survived or succumbed to disease. Surviving plant microbiomes were associated with specific rare taxa, highly pathogen-suppressing Pseudomonas and Bacillus bacteria, and high abundance of genes encoding antimicrobial compounds. Microbiome-mediated plant protection could subsequently be transferred to the next plant generation via soil transplantation. Together, our results suggest that small initial variation in soil microbiome composition and functioning can determine the outcomes of plant-pathogen interactions under natural field conditions.


Figures

Fig. 1
Fig. 1. Schematic figure of the rhizobox sampling system and the experimental design.
(A) The rhizobox consisted of a three-layer cylinder with a height of 136 mm and a diameter of 110 mm. The inner layer (root compartment) is made of a 50-μm nylon mesh net, which prevents roots from entering into the middle layer, and the outer layer is made of a 4-mm metal mesh to support the rhizobox. (B) The middle sampling layer consisted of 18 individual nylon mesh bags (150 μm nylon mesh; height, 136 mm; width, 18 to 21 mm; thickness, 1 to 2 mm) containing homogenized and sterilized field soil. The soil in the nylon mesh bags of the middle layer was thus in close contact with plant roots and root exudates and was used as a proxy of rhizosphere bacterial community. (C) The central root compartment was densely colonized by plant roots after 3 weeks of transplantation of tomato seedlings to the field (photo credit: Yian Gu, Nanjing Agricultural University). (D) Initial bulk soil was collected when the experiment was conducted (0 weeks), and three middle-layer nylon bags from each rhizobox were randomly collected at every sampling time point (3, 4, 5, and 6 weeks after planting) to sample the rhizosphere soil.
Fig. 2
Fig. 2. The outcome of plant-pathogen interaction is associated with the initial soil microbiome composition and functioning.
(A) The population dynamics of R. solanacearum bacterial pathogen in the rhizosphere of healthy and diseased plants. (B) The initial soil microbiomes associated with healthy and diseased plants were clearly distinct (F1,22 = 2.3, P < 0.001, AMOVA on unweighted UniFrac); the percentage of explained variation is shown on the x and y axes. (C) Differences in the abundances of rare discriminating OTUs (linear discriminant analysis score ≥ 2, fold change ≥ 2, and significance test P < 0.05) in the initial soils (week 0) that later became associated with healthy and diseased plants. P values were calculated using Student’s t test (P < 0.05), and significantly associated phyla are highlighted in bold. (D) Co-occurrence networks of initial microbiomes that later became associated with healthy (left) and diseased plants (right). (E) Potential “driver taxa” behind pathogen suppression based on bacterial network analysis of initial microbiomes that later became associated with healthy and diseased plants. Node sizes are proportional to their scaled NESH (neighbor shift) score (a score identifying important microbial taxa of microbial association networks), and a node is colored red if its betweenness increases when comparing soil microbiomes associated with diseased to healthy plants. As a result, large red nodes denote particularly important driver taxa behind pathogen suppression, and these taxa names are shown in bold. Line colors indicate node (taxa) connections as follows: association present only in healthy plant microbiomes (red edges), association present only in diseased plant microbiomes (green edges), and association present in both healthy and diseased plant microbiomes (blue edges). (F) Distinct functional gene profiles associated with the initial microbiomes of future healthy and diseased plants. (G) The abundance of representative genes related to secondary metabolism synthesis in the initial soil microbiomes of future healthy and diseased plants. (H) The percentage of R. solanacearum pathogen-suppressing Bacillus and Pseudomonas bacteria isolated from the initial soil microbiomes of healthy and diseased plants (pairwise t test, mean ± SD, n = 3; N.S., nonsignificant; *P < 0.05; ***P < 0.001).
Fig. 3
Fig. 3. Taxonomic and functional differences between healthy and diseased plant microbiomes persist throughout the tomato growth season and can be transferred to the next plant generation via soil transplantation.
(A) Decay in the phylogenetic distance (unweighted UniFrac distance) between microbiomes associated with healthy and diseased plants. (B) Temporal dynamics of the relative abundance of rare OTUs enriched in the initial microbiomes of healthy and diseased plants. (C) Differences in the abundances of rare discriminating OTUs (linear discriminant analysis score ≥ 2, fold change ≥ 2, and significance test P < 0.05) associated with healthy and diseased plant microbiomes at the end of the experiment (week 6). P values were calculated using Student’s t test (P < 0.05), and significantly associated phyla are highlighted in bold. (D) Co-occurrence networks associated with healthy (left) and diseased plants (right) at the end of the experiment (week 6). (E) Potential driver taxa behind pathogen suppression based on bacterial network analysis of healthy and diseased plant microbiomes at the end of the experiment (week 6). Node sizes are proportional to their scaled NESH score (a score identifying important microbial taxa of microbial association networks), and a node is colored red if its betweenness increases when comparing soil microbiomes associated with diseased to healthy plants. As a result, large red nodes denote particularly important driver taxa behind pathogen suppression, and these taxa names are shown in bold. Line colors indicate node (taxa) connections as follows: association present only in healthy plant microbiomes (red edges), association present only in diseased plant microbiomes (green edges), and association present in both healthy and diseased plant microbiomes (blue edges). (F) Distinct functional gene profiles associated with healthy and diseased plant microbiomes at the end of the experiment (week 6). (G) The abundance of representative genes related to secondary metabolism synthesis of healthy and diseased plant microbiomes at the end of the experiment (week 6). (H) The disease incidence in the second plant generation after transplantation of soil from the first-generation healthy, diseased, or sterilized healthy soil (mean ± SD, n = 4). Different lowercase letters denote significance at P < 0.05 (Duncan’s multiple range test).

References

    1. D. Pennock, N. McKenzie, L. Montanarella, Status of the World's Soil Resources. Technical Summary FAO, Rome, Italy (2015).
    1. Fierer N., Embracing the unknown: Disentangling the complexities of the soil microbiome. Nat. Rev. Microbiol. 15, 579–590 (2017). - PubMed
    1. Raaijmakers J. M., Mazzola M., Soil immune responses. Science 352, 1392–1393 (2016). - PubMed
    1. Campbell C. L., Noe J. P., The spatial analysis of soilborne pathogens and root diseases. Annu. Rev. Phytopathol. 23, 129–148 (1985).
    1. Wang J.-F., Olivier J., Thoquet P., Mangin B., Sauviac L., Grimsley N. H., Resistance of tomato line Hawaii7996 to Ralstonia solanacearum Pss4 in Taiwan is controlled mainly by a major strain-specific locus. Mol. Plant-Microbe Interact. 13, 6–13 (2000). - PubMed

Publication types