. 2019 Sep 25;5(9):eaax4473.
doi: 10.1126/sciadv.aax4473. eCollection 2019 Sep.

Point-of-care biomarker quantification enabled by sample-specific calibration

Affiliations

Point-of-care biomarker quantification enabled by sample-specific calibration

Monica P McNerney et al. Sci Adv. .

Abstract

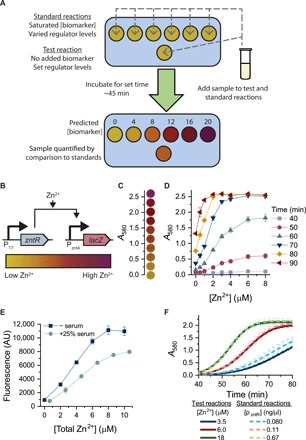
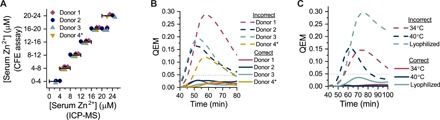
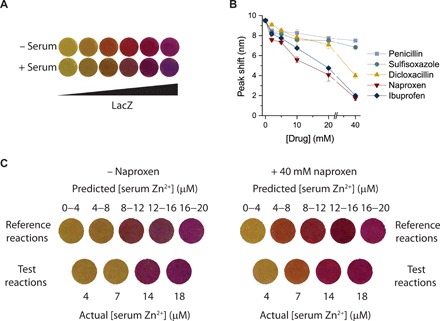
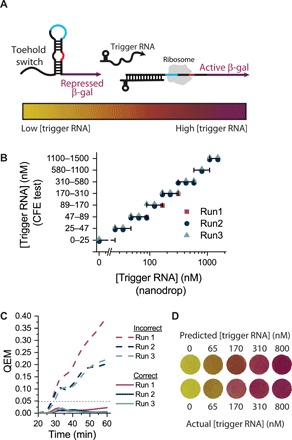
Easy-to-perform, relatively inexpensive blood diagnostics have transformed at-home healthcare for some patients, but they require analytical equipment and are not easily adapted to measuring other biomarkers. The requirement for reliable quantification in complex sample types (such as blood) has been a critical roadblock in developing and deploying inexpensive, minimal-equipment diagnostics. Here, we developed a platform for inexpensive, easy-to-use diagnostics that uses cell-free expression to generate colored readouts that are visible to the naked eye, yet quantitative and robust to the interference effects seen in complex samples. We achieved this via a parallelized calibration scheme that uses the patient sample to generate custom reference curves. We used this approach to quantify a clinically relevant micronutrient and to quantify nucleic acids, demonstrating a generalizable platform for low-cost quantitative diagnostics.


Figures

Fig. 1
Fig. 1. Proposal and development of parallel calibration approach for matrix-specific biomarker quantification.
(A) Schematic of standardization method to account for matrix effects. An array of standard reactions will have saturated biomarker concentrations and varied regulator concentrations. The test reaction will have a set regulator concentration and no added biomarker. The sample to be analyzed will be added to both the standard and test reactions so that all reactions run in the same sample matrix. After a set incubation time, the color of the test reaction can be matched to the color of the standard reactions to determine biomarker concentration in the test reaction. (B) Schematic of a zinc-responsive circuit used to control β-galactosidase production. On one plasmid, ZntR is expressed from a T7 promoter, and on a second plasmid, β-galactosidase is expressed from the ZntR-activated promoter PzntA. (C) Pictures of visible colors from reactions corresponding with different absorbance measurements. The lowest A580 readings correspond with yellow reactions (the color of CPRG), and as the A580 increases, and the reaction color turns different shades of orange, red, and purple (the color of CPR). (D) Quantitative colorimetric response to added zinc. At early time points, there is no detectable absorbance of the purple substrate CPR at tested [Zn2+], and reactions appear yellow (the color of CPRG). As the reactions proceed, they produce CPR at different rates based on the concentration of Zn2+ in the reaction, with the maximal differences visible between 60 and 70 min. An ideal assay readout time would yield outputs spanning a wide range of absorbances across as much of the [Zn2+] range as possible. (E) Fluorescent response to zinc in 25% human serum, demonstrating substantial matrix effects in serum. AU, arbitrary units. (F) Selected time course readings of test and standard reactions run in 25% serum, demonstrating the mapping between the two reaction designs.
Fig. 2
Fig. 2. Quantification approach provides high prediction accuracy at micromolar resolution of raw sample concentrations.
(A) Quantification of serum zinc concentrations for all four single-donor samples tested, evaluated at 56 min. Zinc concentration in chelex-treated samples was measured with inductively coupled plasma–mass spectrometry (ICP-MS), and defined zinc standards were added to each sample to achieve a range of concentrations. Serum from donors 1 to 3 was used in initial calibration, and serum from donor 4 was only used in test validation, indicated by the asterisk. Symbols falling inside the horizontal bars that correspond with the binned prediction ranges for each y-axis level indicate that the CFE test accurately quantified zinc in the serum sample. (B) Error quantification of all individual donor samples via the QEM. Low QEM for correct predictions and high QEM for incorrect predictions indicate unambiguously interpretable test results for a given time. (C) Error quantification in nonideal reaction conditions with serum from donor 4.
Fig. 3
Fig. 3. Addition of small molecules reverses color shifts due to serum albumin.
(A) Reactions run in serum appear different from reactions run in the absence of serum. Reactions with complete conversion of CPRG to CPR appear more purple in a 25% serum matrix. In 25% serum, the colored orange and red reaction intermediates initially observed are no longer visible. (B) Whereas the presence of serum shifts the absorbance peak of CPR approximately 10 nm, the addition of small molecules that bind albumin reverses this spectrum shift. (C) Visualization of standard reference and test reactions in 25% serum. Standard reference reactions contain a saturated amount of zinc and predetermined concentrations of the pZntR plasmid. Test reactions contain a set amount of the pZntR plasmid and specified zinc concentrations. All reactions were run for 50 min and then visualized either with or without 40 mM naproxen addition. With added naproxen, the color of test reactions matches the color of the appropriate standard reference reaction.
Fig. 4
Fig. 4. Quantification approach is generalizable to toehold switches.
(A) Schematic of toehold switch used to control β-galactosidase production. Trigger RNA unfolds the toehold switch and enables β-galactosidase translation. Increasing amounts of trigger RNA correspond with increased β-galactosidase translation. (B) Test quantification of trigger concentrations, evaluated at 40 min. Purified RNA was added to each sample at different known concentrations. Symbols falling inside the horizontal bars that correspond with the binned prediction ranges for each y-axis level indicate that the CFE test accurately quantified RNA in the sample. (C) Quantification error for toehold sensing. (D) Visualization of test and standard reactions, evaluated at 40 min. The color of test reactions matches that of the appropriate standard reference reaction.

References

    1. Waltz E., After Theranos. Nat. Biotechnol. 35, 11–15 (2017). - PubMed
    1. Carlson E. D., Gan R., Hodgman C. E., Jewett M. C., Cell-free protein synthesis: Applications come of age. Biotechnol. Adv. 30, 1185–1194 (2012). - PMC - PubMed
    1. Pardee K., Green A. A., Ferrante T., Cameron D. E., Keyser A. D., Yin P., Collins J. J., Paper-based synthetic gene networks. Cell 159, 940–954 (2014). - PMC - PubMed
    1. Pardee K., Green A. A., Takahashi M. K., Braff D., Lambert G., Lee J. W., Ferrante T., Ma D., Donghia N., Fan M., Daringer N. M., Bosch I., Dudley D. M., O’Connor D. H., Gehrke L., Collins J. J., Rapid, low-cost detection of zika virus using programmable biomolecular components. Cell 165, 1255–1266 (2016). - PubMed
    1. Gootenberg J. S., Abudayyeh O. O., Lee J. W., Essletzbichler P., Dy A. J., Joung J., Verdine V., Donghia N., Daringer N. M., Freije C. A., Myhrvold C., Bhattacharyya R. P., Livny J., Regev A., Koonin E. V., Hung D. T., Sabeti P. C., Collins J. J., Zhang F., Nucleic acid detection with CRISPR-Cas13a/C2c2. Science 356, 438–442 (2017). - PMC - PubMed

Publication types

LinkOut - more resources