. 2019 Aug;1(8):811-829.
doi: 10.1038/s42255-019-0099-7. Epub 2019 Aug 19.

Hypothalamic dopamine signaling regulates brown fat thermogenesis

Affiliations

Hypothalamic dopamine signaling regulates brown fat thermogenesis

Cintia Folgueira et al. Nat Metab. 2019 Aug.

Abstract

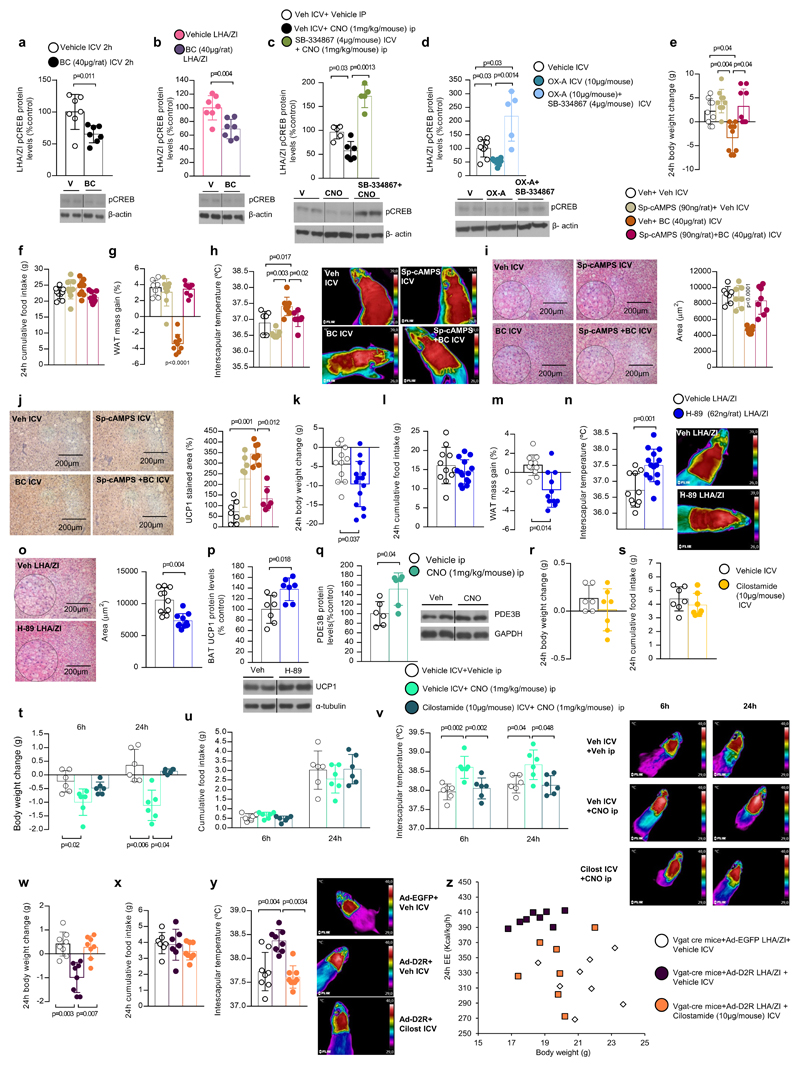
Dopamine signaling is a crucial part of the brain reward system and can affect feeding behavior. Dopamine receptors are also expressed in the hypothalamus, which is known to control energy metabolism in peripheral tissues. Here we show that pharmacological or chemogenetic stimulation of dopamine receptor 2 (D2R) expressing cells in the lateral hypothalamic area (LHA) and the zona incerta (ZI) decreases body weight and stimulates brown fat activity in rodents in a feeding-independent manner. LHA/ZI D2R stimulation requires an intact sympathetic nervous system and orexin system to exert its action and involves inhibition of PI3K in the LHA/ZI. We further demonstrate that, as early as 3 months after onset of treatment, patients treated with the D2R agonist cabergoline experience an increase in energy expenditure that persists for one year, leading to total body weight and fat loss through a prolactin-independent mechanism. Our results may provide a mechanistic explanation for how clinically used D2R agonists act in the CNS to regulate energy balance.


Conflict of interest statement

The authors declare no conflict of interests.

Figures

Figure 1
Figure 1. Chronic central infusion of bromocriptine reduces diet-induced obesity.
(a-d) Effect of a 14-day intracerebroventricular infusion of bromocriptine (BC) (40 μg/rat/day) and subcutaneous injection of SR59230A hydrochloride (3 mg/kg) on body weight (a), cumulative food intake (b) (n=8); representative histology of BAT lipid content and quantification of lipid droplet average area (c) (n=7), scale bars, 200 μm; protein levels of BAT UCP1, FGF21, PRDM16 and PGC1α in rats fed a chow diet (d) (n=7). (e-l) Effect of a 10-day intracerebroventricular infusion of bromocriptine (40 μg/rat/day) and subcutaneous injection of SR59230A hydrochloride (3 mg/kg) on cumulative food intake (e); body weight change (f); white mass gain (g); energy expenditure (EE) (h); respiratory quotient (RQ) (i), locomotor activity (j) (n=7 Veh, n=8 BC and n=7 BC+ SR59230A hydrochloride treatment); representative histology of BAT lipid content and quantification of lipid droplet average area (k) (n=7 each treatment), scale bars, 200 μm; protein levels of BAT UCP1, FGF21, PRDM16 and PGC1α (l) (n=7 Veh, n=8 BC and n=7 BC+ SR59230A hydrochloride treatment) in rats fed a high fat diet (HFD). (m-q) Effect of a 7-day intracerebroventricular infusion of bromocriptine (40 μg/mouse/day) on body weight change (m); cumulative food intake (n); white mass change (o); representative histology of BAT lipid content and quantification of lipid droplet average area (p) scale bars, 200 μm, and protein levels of BAT UCP1 (q) (n= 5 WT Veh and WT BC mice, n= 4 TKO Veh and n=6 TKO BC mice). Protein data were expressed in relation (%) to control (vehicle-treated) animals. α-tubulin was used to normalize protein levels. Dividing lines indicate splicings within the same gel. Values are represented as the mean ± SD. Statistical differences according to a one-way ANOVA followed by Bonferroni post hoc multiple comparison test (a,b,c,e,f,g,h,i,k,j), analysis of covariance (ANCOVA) with non-fat mass as covariate (h), or a Kruskal-Wallis followed by Dunn post hoc test for multiple comparison (d,e,l,m,n,o,p,q). Values are represented as the mean ± SEM. *P < 0.05, **P < 0.01, ***P < 0.001 (a,f).
Figure 2
Figure 2. Stimulation of D2R in the LHA/ZI stimulates BAT activity.
(a-e) Effect of the specific injection of bromocriptine (BC) (40 μg/rat) in the LHA/ZI on body weight change (a) and food intake (b) (n=9 each treatment); infrared thermal images and quantification of BAT interscapular temperature (c) (n=5); representative histology of BAT lipid content and quantification of lipid droplet average area (d) (n=5), scale bars, 200 μm; protein levels of BAT UCP1 (e) (n=7) after 24 hours. (f-h) Effect of the specific injection of bromocriptine (40 μg/rat) in the VMH on body weight change (f), food intake (g), and infrared thermal images and quantification of BAT interscapular temperature after 24 hours (h) (n=9 each treatment). (i-t) Representative mCherry expression in the hypothalamic LHA/ZI after stereotaxic injection of hSYN-DIO-hM3D(Gq)-mCherry AVV, scale bar 0.2 mm (i). Effect of the stereotaxical injection of hSYN-DIO-Hm3D(Gq)-mCherry AVV in the LHA/ZI of D2R-CRE mice on body weight change (j), food intake and water intake (k), infrared thermal images and quantification of BAT interscapular temperature (l), body temperature (m) (n=7 per group); respiratory quotient (n), locomotor activity (o) and energy expenditure (p) (n=5) and correlation between energy expenditure and locomotor activity in the dark phase, in the light phase and energy expenditure during 2 hours of light phase (Pearson correlation test) (q); representative histology of BAT lipid content (r) (n=6) scale bars, 200 μm; protein levels of BAT UCP1 (s), plasma prolactin levels (t) (n= 7 Veh and n=6 CNO) after 24 hours and body temperature and BAT interscapular temperature in cold exposure (4ºC) (n=9) (u). Protein data were expressed in relation (%) to control (vehicle-treated) animals. α- tubulin was used to normalize protein levels. Dividing lines indicate splicings within the same gel. The experiments were repeated five times (i). Data are mean ± SD. Statistical differences according to a two-sided Student´s t-test (e,f,g,h,j,l,m,u) or two-sided Mann-Whitney U test (a,b,c,d,k,n,o,p,q,r,s).
Figure 3
Figure 3. Knock down of D2R in the LHA/ZI blunts bromocriptine-induced weight loss.
(a) Representative photomicrograph of brain section showing the injection of the viral vectors that encodes GFP expression precisely placed in the LHA/ZI, scale bar, 0.1 mm and (b) D2R protein levels in the LHA/ZI 3 weeks after the viral infection (n=7 per group). (c-i) Effect of the injection of adenoviral particles encoding for GFP- or D2R-KD in the LHA/ZI of rats treated with ICV bromocriptine (BC) (40 μg/rat) on body weight change (c), food intake (d), WAT weight (e) and infrared thermal images and quantification of BAT interscapular temperature (f) (n= 6 GFP Veh, n=8 GFP BC, n=9 D2R-KD Veh and n=9 D2R-KD BC); representative histology of BAT lipid content and quantification of lipid droplet average area (g) (n=5) scale bars, 200 μm; BAT UCP1 protein levels (h) (n= 6 in each treatment) and c-FOS immunoreactive cells (IR) in the raphe pallidus (RPa) and inferior olive (IO) with representative sections (i) (Gi, gigantocellular reticular nucleus; IO, inferior olive; py, pyramidal tract; RPa, raphe pallidus; scale bar, 100 μm (n=5). (j) Double immunostaining of HA and orexin, MCH, Vgat and Vglut2 in D2R-Cre: Ribotag mice, scale bars: 100 μm, insets, 40 μm, high magnification, 8 μm). α-tubulin and β-actin were used to normalize protein levels. Protein data were expressed in relation (%) to control (vehicle-treated) animals. Dividing lines indicate splicings within the same gel. The experiments were repeated six times (a,j). Data are mean ± SD. Statistical differences on the basis of a one-way ANOVA followed by Bonferroni post hoc multiple comparison test (c,d,f,g) or two-tailed Student´s t-test (b,e,h,i).
Figure 4
Figure 4. D2R action in GABAergic neurons requires orexin to modulate BAT.
(a) Photomicrograph showing the colocalization of GFP and Vglut2 in the LHA/ZI. (b-e) Effect of the injection of Ad-hSyn-DIO-EGFP or Ad-hSyn-DIO-D2R-EGFP in the LHA/ZI of vglut2-ires-cre mice on body weight change (b), food intake (c), BAT temperature (d) (n=10) and BAT UCP1 protein levels (e) (n=4). (f) Photomicrograph showing the colocalization of GFP and Vgat in the LHA/ZI. (g) Profiles from sorted non-infected/EGFP (cortex) and infected/EGFP sites (hypothalamus) and mRNA expression of Vgat, Vglut2 and Drd2 in Vgat-ires and Vglut2-ires cre mice injected with Ad-hSyn-DIO-EGFP in the LHA/ZI (n=4). (h-k) Effect of the injection of Ad-hSyn-DIO-EGFP or Ad-hSyn-DIO-D2R-EGFP in the LHA/ZI of vgat-ires-cre mice on body weight change (h), food intake (i), BAT temperature (j) (n=12) and BAT UCP1 protein levels (k) (n=4). (l-o) Effect of the injection of Ad-hSyn-DIO- EGFP or Ad-hSyn-DIO-shD2R-EGFP in the LHA/ZI of vgat-ires-cre mice on body weight change (l), food intake (m) (n=7), BAT temperature (n) and BAT UCP1 protein levels (o) (n= 6). (p-t) Effect of a 24-hour ICV injection of bromocriptine (BC) (40 μg) on body weight change (p), food intake (q), infrared thermal images and quantification of BAT temperature (r), histology of BAT lipid content and quantification of lipid droplet average area (s) (n=4); and BAT UCP1 protein levels (t) in wild type (n=4) and orexin knockout (n=6) mice. (u-x) Effect of the injection of AAV-hSYN-DIO-Hm3D(Gq)-mCherry and the ICV injection of the orexin receptor antagonist SB-334867 (4 μg) on body weight change (u) and infrared thermal images and quantification of BAT temperature (v) (n=5-6); histology of BAT lipid content and quantification of lipid droplet average area (w) and immunostaining of UCP1 and quantification in BAT (x) (n=8) after 24 hours. Dividing lines indicate splicings within the same gel. The experiments were repeated six times (a,h). Data are mean ± SD. Statistical differences on the basis of a two-tailed Student´s t-test (b,c,d,h,i,j,k), a Kruskal-Wallis followed by Dunn post hoc test for multiple comparison (c,p,q), two-way ANOVA (r), two-sided Mann-Whitney U test (e,g,l,m,n,o,s,t) or a one-way ANOVA followed by Bonferroni post hoc multiple comparison test (u,v,w,x).
Figure 5
Figure 5. Protein kinase A mediates the effects of bromocriptine on BAT.
(a-d) Phosphorylated levels of CREB in the LHA/ZI after: 2-hour ICV (a) and 24-hour specific injection of bromocriptine (BC) (40 μg) in the LHA/ZI (n=7) (b); injection of AAV-hSYN-DIO-hM3D (Gq)-mCherry and the ICV injection of SB-334867 (4 μg) (n=5-6) (c); ICV injection of orexin (OX) (10 μg) and SB-334867 (4 μg) after 24 hours (n=5-9) (d). (e-j) Effect of the ICV injection of BC (40 μg) and Sp-cAMPS (90 ng) on body weight change (e), food intake (f) and white mass gain (g) (n= 9); and BAT temperature (h) (n=7-8); histology of BAT lipid content and quantification of lipid droplet area (i) and immunostaining of UCP1 and quantification in BAT (j) (n=7) after 24 hours. (k-p) Effect of the LHA/ZI injection of the specific PKA inhibitor H-89 (62 ng) on body weight change (k), food intake (l), white mass gain (m), and BAT temperature (n) (n=11-12); histology of BAT lipid content and quantification of lipid droplet area (o) (n= 10), and protein levels of BAT UCP1 (p) (n=7) after 24 hours. (q) Effect of the injection of AAV-hSyn-DIO-hM3D (Gq)-mCherry in the LHA/ZI of D2R-cre mice on PDE3B levels in the LHA/ZI (n=6). (r-s) Effect of the ICV injection of Cilostamide (10 μg) on body weight (r) and food intake (s) (n=7). (t-v) Effect of the injection of AAV-hSyn-DIO-Hm3D (Gq)-mCherry in the LHA/ZI of D2R-cre mice and the ICV injection of Cilostamide (10 μg) on body weight (t), food intake (u) and BAT temperature (v) (n=6). (w-z) Effect of the injection of Ad-hSyn-DIO-EGFP or Ad-hSyn-DIO-D2R-EGFP in the LHA/ZI of Vgat-ires-cre mice and ICV Cilostamide (10 μg) on body weight (w), food intake (x), BAT temperature (y) and energy expenditure (EE) after 24hours (z) (n= 7-8). Dividing lines indicate splicings within the same gel. Data are mean ± SD. Statistical differences according to a two-tailed Student´s t-test (a,b,q,r,s), a one-way ANOVA followed by Bonferroni post hoc multiple comparison test (c,e,f,g,h,i,j,w,x,y), a Kruskal-Wallis followed by Dunn post hoc test for multiple comparison (d, t,u,v,) or two-sided Mann-Whitney U test (k,l,m,n,o,p) and analysis of covariance (ANCOVA) with body weight as covariate (z).
Figure 6
Figure 6. S6 mediates the effects of bromocriptine on BAT.
(a-i) rpS6 phosphorylated levels in the LHA/ZI after: ICV injection of bromocriptine (BC) (40 μg) assessed by immunohistochemistry (n=7) (a) and western blot (n=4) (b); 24-hour specific injection of BC (40 μg) in the LHA/ZI (n=7) (c); injection of Ad-GFP or Ad-shD2R in the LHA/ZI of rats treated with ICV bromocriptine (40 μg) (n= 6 GFP Veh, n=7 GFP BC, n=7 D2R-KD Veh and n=7 D2R-KD BC) (d); 24-hour ICV injection of BC (40 μg) in wild type (n=4) and orexin (OX) knockout mice (n=6) (e); injection of AAV-hSYN-DIO-hM3D (Gq)-mCherry and the ICV injection of SB-334867 (4 μg) (n=4 Veh, n=4 CNO and n=5 CNO+SB-334867) (f); ICV injection of OX (10 μg) and SB-334867 (4 μg) (n=6) (g); LHA/ZI injection of the specific PKA inhibitor H-89 (62 ng) (n=7) (h); and ICV injection of BC (40 μg) and the specific PKA activator Sp-cAMPS (90 ng) after 24 hours (n=6) (i). (j) Total and rpS6 phosphorylated levels in the LHA/ZI 3 weeks after the viral infection (n=7). (k-o) Effect of the injection of adenoviral particles encoding for Null or S6K1 in the LHA/ZI of rats treated with ICV BC (40 μg) on body weight change (k), food intake (l) and infrared thermal images and quantification of BAT interscapular temperature (m) (n= 8 ad null Veh, n=9 ad null BC, n=8 ad S6K1 Veh and n=9 ad S6K1 BC), histology of BAT lipid content and quantification of lipid droplet average area (n), and BAT UCP1 protein levels (o) (n=7). Dividing lines indicate splicings within the same gel. Data are mean ± SD. Statistical differences according to a two-tailed Student´s t-test (a,c,d), a two-sided Man-Whitney test (b,e,h,j), a Kruskal-Wallis followed by Dunn post hoc test for multiple comparison (f,g,i) or a one-way ANOVA followed by Bonferroni post hoc multiple comparison test (k,l,m,n,o).
Figure 7
Figure 7. Cabergoline decreases body weight and increases resting energy expenditure in patients.
(a) Waterfall plot of the body weight changes experimented by each patient (1-31) of the retrospective study between baseline and following 0.5 mg twice weekly cabergoline treatment for 12 months. (b) Waterfall plot of the body weight changes experimented by each patient (1-21) of the prospective study during the first 3 months of cabergoline treatment instauration with 0.5 mg cabergoline twice weekly. (c) REE in patients before and after cabergoline treatment compared to the REE predicted from the Harris Benedict equation. (d) Correlation between REE and weight loss in patients treated with cabergoline.

Similar articles

Cited by

References

    1. Palmiter RD. Is dopamine a physiologically relevant mediator of feeding behavior? Trends in neurosciences. 2007;30:375–381. - PubMed
    1. Mirmohammadsadeghi Z, Shareghi Brojeni M, Haghparast A, Eliassi A. Role of paraventricular hypothalamic dopaminergic D1 receptors in food intake regulation of food-deprived rats. European journal of pharmacology. 2018;818:43–49. - PubMed
    1. Zhu X, Ottenheimer D, DiLeone RJ. Activity of D1/2 Receptor Expressing Neurons in the Nucleus Accumbens Regulates Running, Locomotion, and Food Intake. Frontiers in behavioral neuroscience. 2016;10:66. - PMC - PubMed
    1. Land BB, et al. Medial prefrontal D1 dopamine neurons control food intake. Nature neuroscience. 2014;17:248–253. - PMC - PubMed
    1. Fetissov SO, Meguid MM, Sato T, Zhang LH. Expression of dopaminergic receptors in the hypothalamus of lean and obese Zucker rats and food intake. American journal of physiology Regulatory, integrative and comparative physiology. 2002;283:R905–910. - PubMed

Publication types