. 2020 Jan;250(1):79-94.
doi: 10.1002/path.5352. Epub 2019 Nov 14.

Genetic or pharmacologic blockade of enhancer of zeste homolog 2 inhibits the progression of peritoneal fibrosis

Affiliations

Genetic or pharmacologic blockade of enhancer of zeste homolog 2 inhibits the progression of peritoneal fibrosis

Yingfeng Shi et al. J Pathol. 2020 Jan.

Abstract

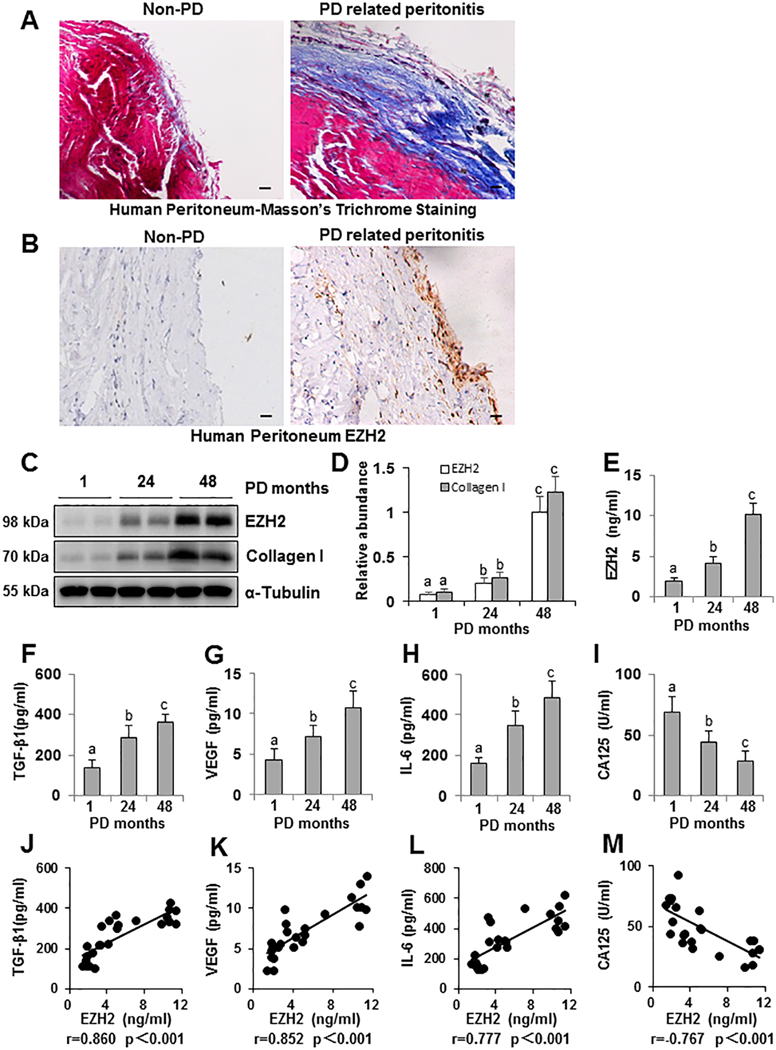
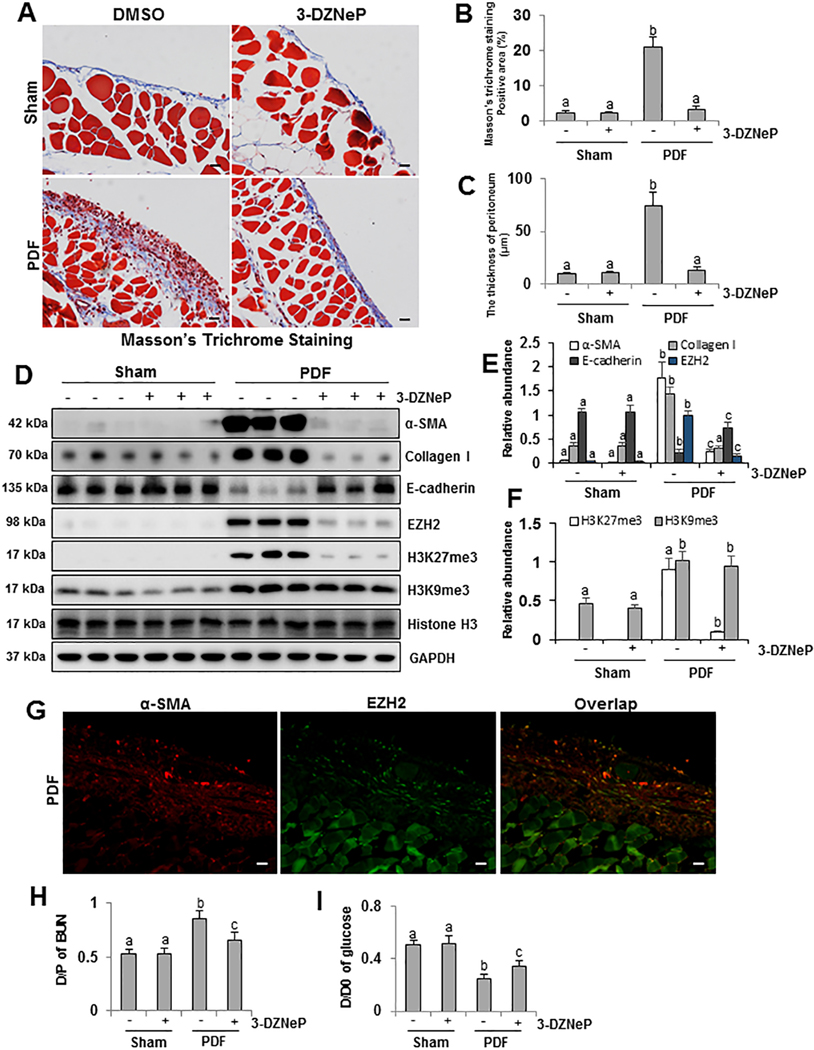
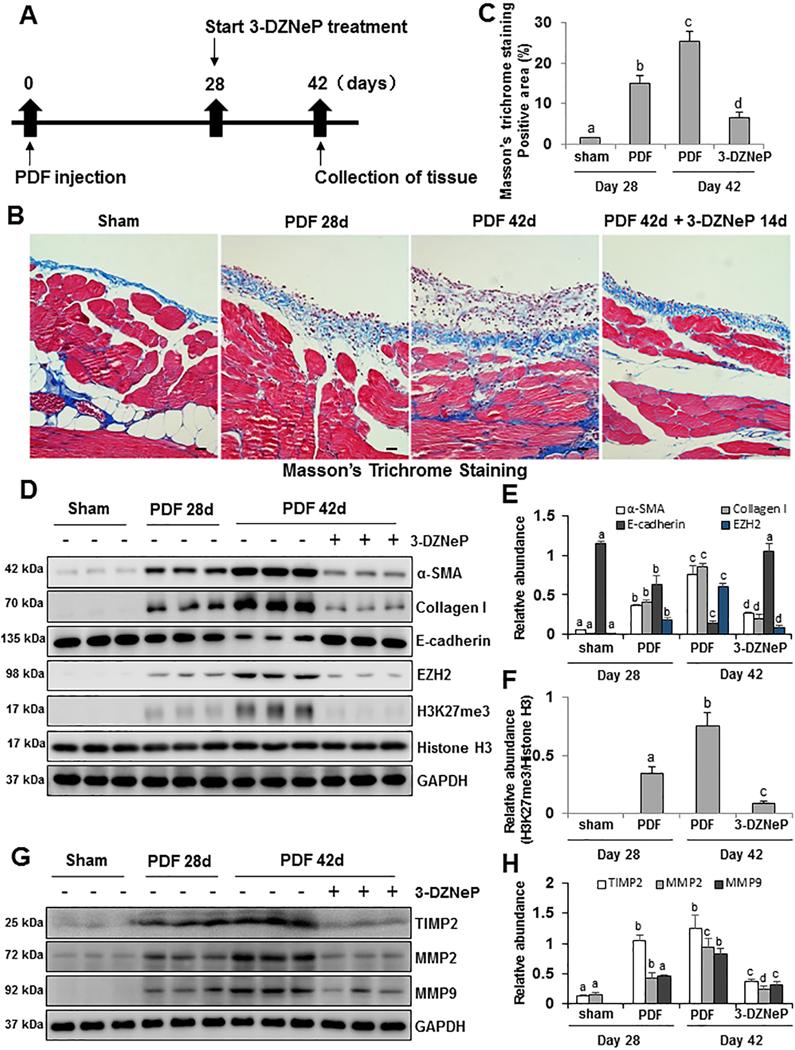
Dysregulation of histone methyltransferase enhancer of zeste homolog 2 (EZH2) has been implicated in the pathogenesis of many cancers. However, the role of EZH2 in peritoneal fibrosis remains unknown. We investigated EZH2 expression in peritoneal dialysis (PD) patients and assessed its role in peritoneal fibrosis in cultured human peritoneal mesothelial cells (HPMCs) and murine models of peritoneal fibrosis induced by chlorhexidine gluconate (CG) or high glucose peritoneal dialysis fluid (PDF) by using 3-deazaneplanocin A (3-DZNeP), and EZH2 conditional knockout mice. An abundance of EZH2 was detected in the peritoneum of patients with PD associated peritonitis and the dialysis effluent of long-term PD patients, which was positively correlated with expression of TGF-β1, vascular endothelial growth factor, and IL-6. EZH2 was found highly expressed in the peritoneum of mice following injury by CG or PDF. In both mouse models, treatment with 3-DZNeP attenuated peritoneal fibrosis and inhibited activation of several profibrotic signaling pathways, including TGF-β1/Smad3, Notch1, epidermal growth factor receptor and Src. EZH2 inhibition also inhibited STAT3 and nuclear factor-κB phosphorylation, and reduced lymphocyte and macrophage infiltration and angiogenesis in the injured peritoneum. 3-DZNeP effectively improved high glucose PDF-associated peritoneal dysfunction by decreasing the dialysate-to-plasma ratio of blood urea nitrogen and increasing the ratio of dialysate glucose at 2 h after PDF injection to initial dialysate glucose. Moreover, delayed administration of 3-DZNeP inhibited peritoneal fibrosis progression, reversed established peritoneal fibrosis and reduced expression of tissue inhibitor of metalloproteinase 2, and matrix metalloproteinase-2 and -9. Finally, EZH2-KO mice exhibited less peritoneal fibrosis than EZH2-WT mice. In HPMCs, treatment with EZH2 siRNA or 3-DZNeP suppressed TGF-β1-induced upregulation of α-SMA and Collagen I and preserved E-cadherin. These results indicate that EZH2 is a key epigenetic regulator that promotes peritoneal fibrosis. Targeting EZH2 may have the potential to prevent and treat peritoneal fibrosis. © 2019 Pathological Society of Great Britain and Ireland. Published by John Wiley & Sons, Ltd.

Keywords: angiogenesis; enhancer of zeste homolog 2; epithelial-to-mesenchymal transition; peritoneal fibrosis; profibrotic signaling pathways.


Figures

Figure 1.
Figure 1.. High expression of EZH2 is detected in peritoneum of patients with PD associated peritonitis and EZH2 also positively correlates with enhanced expression of TGF-β1, VEGF, IL-6 and negatively with CA125 in human PD effluents.
(A) Photomicrographs (200X) show Masson trichrome staining of the peritoneum in both non-PD patients and patients with PD associated peritonitis. (B) Photomicrographs (200X) illustrate EZH2 staining of the peritoneal tissues in both non-PD patients and patients with PD associated peritonitis patients. (C) Human PD effluent was subjected to immunoblot analysis with antibodies against EZH2, Collagen I or α-Tubulin. (D) Expression levels of EZH2 and Collagen I were quantified by densitometry and normalized with α-Tubulin. Human PD effluent was subjected to the ELISA, as described under Materials and Methods, at different PD time points, respectively, 1 month (n=9), 24 months (n=8) and 48months (n=8). The expression levels of EZH2 (E), TGF-β1 (F), VEGF (G), IL-6 (H), and CA125 (I) are indicated in each group. Correlation analysis was conducted between EZH2 and TGF-β1 (J), VEGF (K), IL-6 (L) as well as CA125 (M). Data are represented as the mean ± S.E.M. Means with different superscript letters are significantly different from one another (P< 0.05). All scale bars = 20 μm.
Figure 2.
Figure 2.. Administration of 3-DZNeP inhibits EMT and improves functional impairments of peritoneal membrane in the high glucose PDF-injured peritoneum.
(A) Photomicrographs (200X) show Masson trichrome staining of the peritoneum in each group. (B) The graph shows the positive area of the Masson-positive submesothelial area (blue) from ten random fields of six mice peritoneal samples. (C) The graph shows the thickness of the compact zone measured from ten random fields of six mice peritoneal samples. (D) Peritoneum tissue lysates were prepared and subjected to immunoblot analysis with antibodies against α-SMA, Collagen I, E-cadherin, EZH2, H3K27me3, H3K9me3, Histone H3 or GAPDH. (E) Expression levels of α-SMA, Collagen I, E-cadherin and EZH2 were quantified by densitometry and normalized with GAPDH. (F) Expression levels of H3K27me3 and H3K9me3 were quantified by densitometry and normalized with Histone H3. (G) Co-immunofluorescence photomicrographs (200X) illustrate co-staining of α-SMA and EZH2 in the peritoneum from peritoneal fibrosis mice induced by high glucose PDF injection. (H) The dialysate-to-plasma (D/P) ratio of blood urea nitrogen (BUN). (I) Ratio of dialysate glucose at 2 hour after PDF injection to dialysate glucose at 0 hour (D/D0). Data are represented as the mean ± S.E.M (n = 6). Means with different superscript letters are significantly different from one another (P< 0.05). All scale bars = 20 μm.
Figure 3.
Figure 3.. Inhibition of EZH2 suppresses TGF-β1/Smad3 and Notch1/Jagged-1 signaling pathway and inhibits phosphorylation of EGFR as well as Src in the fibrotic peritoneum.
(A) Peritoneum tissue lysates were prepared and subjected to immunoblot analysis with antibodies against TGF-βRI, p-Smad3, Smad3, Smad7, or GAPDH. (B) Peritoneal tissue lysates were subjected to the determination of TGF-β1 levels by the ELISA. (C) Expression levels of TGF-βRI and p-Smad3 were quantified by densitometry and normalized respectively with GAPDH and Smad3. (D) Expression level of Smad7 was quantified by densitometry and normalized with GAPDH. (E) The prepared peritoneum tissue lysates were subjected to immunoblot analysis with antibodies against p-EGFR, EGFR, p-Src, Src, or GAPDH. These proteins were quantified by densitometry. (F) p-EGFR and p-Src levels were normalized with their total protein levels. (G) Peritoneum tissue lysates were prepared and subjected to immunoblot analysis with antibodies against Notch1, Jagged-1 or GAPDH. (H) Expression levels of Notch1 and Jagged-1 were quantified by densitometry and normalized with GAPDH. Data are represented as the mean ± S.E.M (n = 6). Means with different superscript letters are significantly different from one another (P< 0.05).
Figure 4.
Figure 4.. 3-DZNeP inhibits inflammation and angiogenesis as well as lymphocyte and macrophage infiltration in the model of PDF-induced peritoneal fibrosis.
(A, B) Peritoneum tissue lysates were subjected to immunoblot analysis with antibodies against p-STAT3, STAT3, p-NF-κB, NF-κB, or GAPDH. These proteins were quantified by densitometry. (C) p-STAT3 and p-NF-κB levels were normalized with their total protein levels. Peritoneal lysates were subjected to the ELISA as described under Materials and Methods. (D) The expression levels of IL-6, TNF-α, IL-1β and MCP-1 are indicated in each group. (E) Photomicrographs (200X) illustrate CD3 staining of the peritoneal tissues from sham-operated or 4.25% PDF-treated mice with/without 3-DZNeP administration. The count of CD3-positive cells was calculated from ten random fields of six mice peritoneal samples. (F) Photomicrographs (200X) illustrate CD68 staining of the peritoneal tissues. The count of CD68-positive cells was calculated from ten random fields of six mice peritoneal samples. (G) Photomicrographs (200X) illustrate VEGF staining of the peritoneal tissues. The count of VEGF-positive cells was calculated from ten random fields of six mice peritoneal samples. (H) Photomicrographs (200X) illustrate CD31 staining of the peritoneal tissues. The count of CD31-positive vessels was calculated from ten random fields of six mice peritoneal samples. Data are represented as the mean ± S.E.M (n = 6). Means with different superscript letters are significantly different from one another (P< 0.05). All scale bars = 20 μm.
Figure 5.
Figure 5.. Delayed treatment with 3-DZNeP attenuates and reverses progression of peritoneal fibrosis and suppresses EMT.
(A) Schematic of the experimental design for delayed treatment with 3-DZNeP. To investigate the therapeutic effect of 3-DZNeP on peritoneal fibrosis mice models, 3-DZNeP was administered starting at 28 days after injection with 4.25% high glucose dialysate and then given daily for 14 days. At 42 days, animals were euthanized for collection of peritoneum. (B) Photomicrographs (200X) show Masson trichrome staining of the peritoneum in each group. (C) The graph shows the positive area of the Masson-positive submesothelial area (blue) from ten random fields of six mice peritoneal samples. (D) Peritoneum tissue lysates were subjected to immunoblot analysis with specific antibodies against α-SMA, Collagen I, E-cadherin, EZH2, H3K27me3, Histone H3 or GAPDH. (E) Expression levels of α-SMA, Collagen I, E-cadherin and EZH2 were quantified by densitometry and normalized with GAPDH. (F) Expression level of H3K27me3 was quantified by densitometry and normalized with Histone H3. (G) Peritoneum tissue lysates were prepared and subjected to immunoblot analysis with antibodies against TIMP2, MMP2, MMP9, or GAPDH. (H) Expression levels of TIMP2, MMP2 and MMP9 were quantified by densitometry and normalized with GAPDH. Data are represented as the mean ± S.E.M (n = 6). Means with different superscript letters are significantly different from one another (P< 0.05). All scale bars = 20 μm.
Figure 6.
Figure 6.. Comparison of peritoneal fibrosis in EZH2-WT and EZH2-KO mice after high glucose PDF injury.
EZH2 knockout mice were generated by breeding our EZH2loxP/loxP mice with tamoxifen-inducible Col1a2-Cre mice (Col1a2-CreER+/−) and then backcrossing progeny to EZH2loxP/loxP mice to obtain Col1a2-Cre+: EZH2loxP/loxP mice (EZH2-KO) and Col1a2-Cre-: EZH2loxP/loxP mice (EZH2-WT). Both of EZH2-KO and EZH2-WT mice were received daily intraperitoneal injection of 100ml/kg peritoneal dialysis solution with 4.25% glucose for 28 days to establish peritoneal fibrosis model. (A) Photomicrographs (200X) show Masson trichrome staining of the peritoneum in each group. (B) The graph shows the positive area of the Masson-positive submesothelial area (blue) from ten random fields of six mice peritoneal samples. (C) The graph shows the thickness of the compact zone measured from ten random fields of six mice peritoneal samples. (D) Peritoneum tissue lysates were prepared and subjected to immunoblot analysis with antibodies against α-SMA, Collagen I, EZH2, H3K27me3, Histone H3 or GAPDH. (E) Expression levels of α-SMA, Collagen I and EZH2 were quantified by densitometry and normalized with GAPDH. (F) Expression level of H3K27me3 was quantified by densitometry and normalized with Histone H3. (G) Peritoneum tissue lysates were prepared and subjected to immunoblot analysis with antibodies against TIMP2, MMP2, MMP9, or GAPDH. (H) Expression levels of TIMP2, MMP2 and MMP9 were quantified by densitometry and normalized with GAPDH. Data are represented as the mean ± S.E.M (n = 6). Means with different superscript letters are significantly different from one another (P< 0.05). All scale bars = 20 μm.

Similar articles

Cited by

References

    1. Liu FX, Gao X, Inglese G, et al. A global overview of the impact of peritoneal dialysis first or favored policies: an opinion. Perit Dial Int 2015; 35: 406–420. - PMC - PubMed
    1. Nakayama M, Zhu WJ, Watanabe K, et al. Dissolved molecular hydrogen (H2) in Peritoneal Dialysis (PD) solutions preserves mesothelial cells and peritoneal membrane integrity. BMC Nephrol 2017; 18: 327. - PMC - PubMed
    1. Saxena AB. Recent advances in the management of peritoneal dialysis patients. F1000Prime Rep 2015; 7: 57. - PMC - PubMed
    1. Zhou Q, Bajo MA, Del Peso G, et al. Preventing peritoneal membrane fibrosis in peritoneal dialysis patients. Kidney Int 2016; 90: 515–524. - PubMed
    1. Yao Q, Pawlaczyk K, Ayala ER, et al. The role of the TGF/Smad signaling pathway in peritoneal fibrosis induced by peritoneal dialysis solutions. Nephron Exp Nephrol 2008; 109: e71–78. - PubMed

Publication types

MeSH terms