

Estimating Long-Term Drinking Patterns for People with Lifetime Alcohol Use Disorder
- PMID: 31580211
- PMCID: PMC6842126
- DOI: 10.1177/0272989X19873627
Estimating Long-Term Drinking Patterns for People with Lifetime Alcohol Use Disorder
Abstract
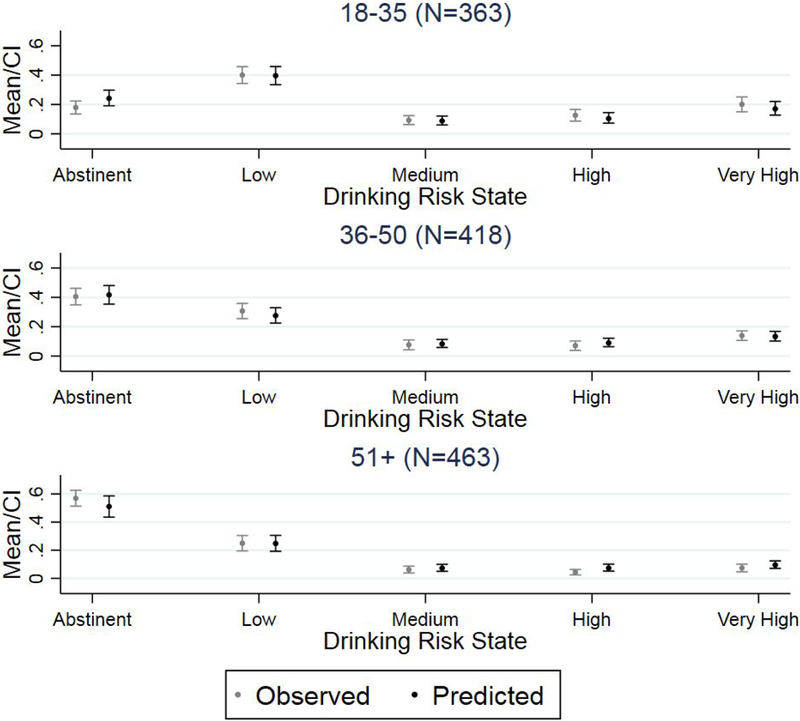
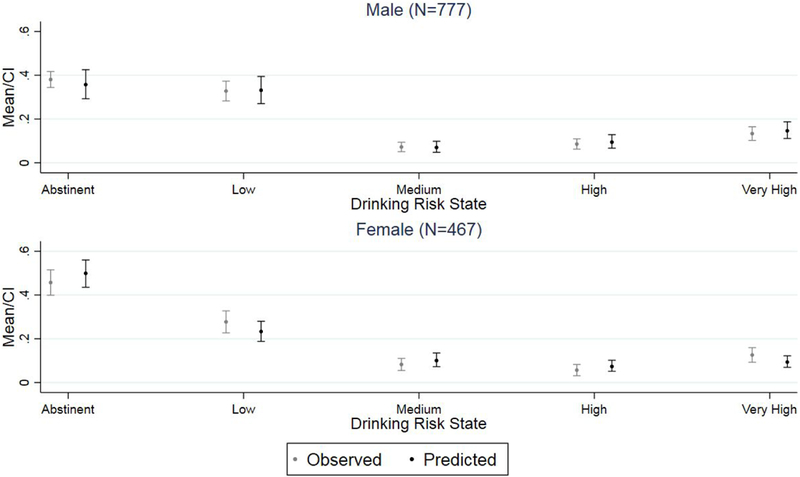
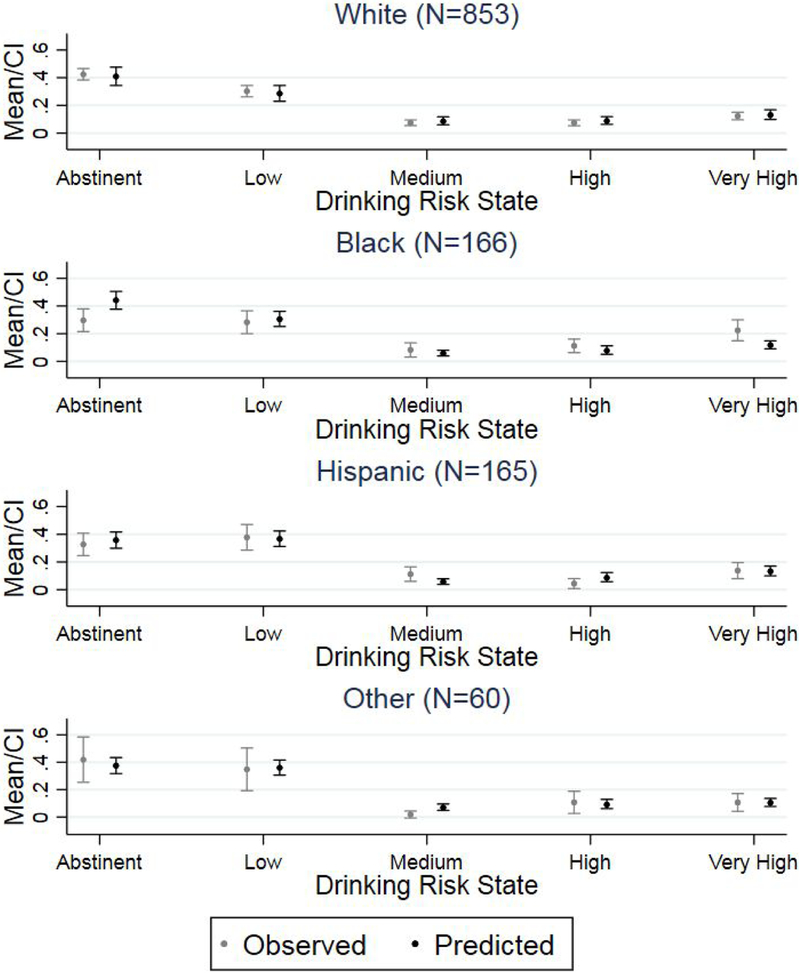
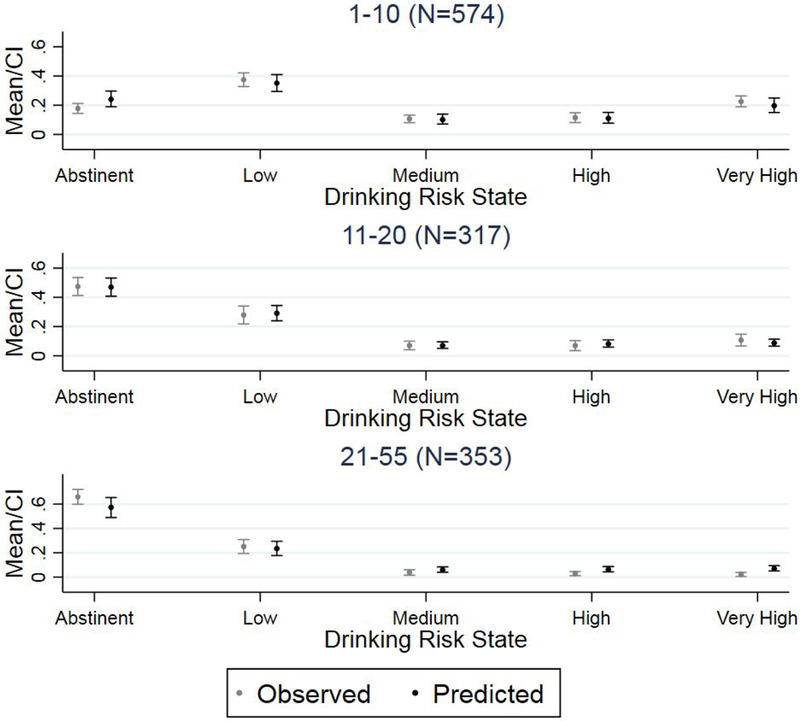
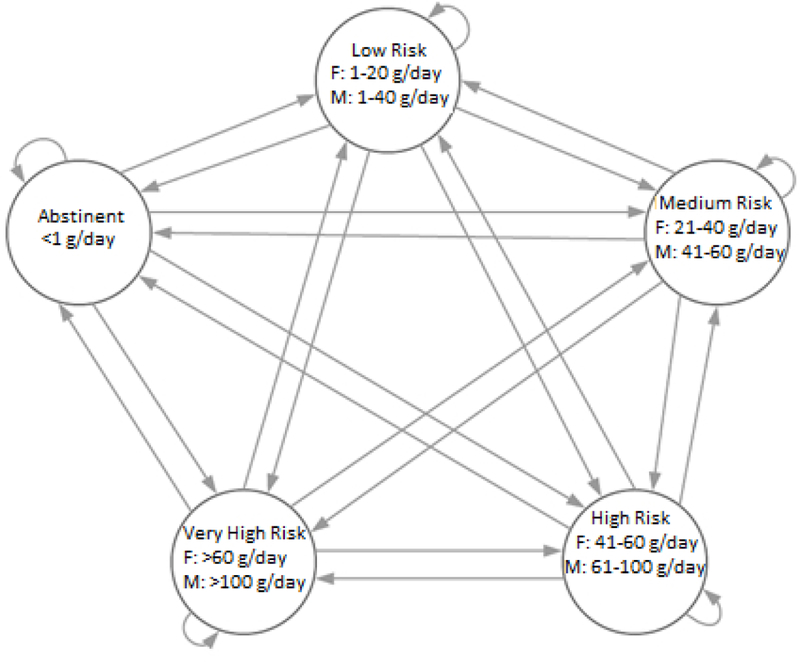
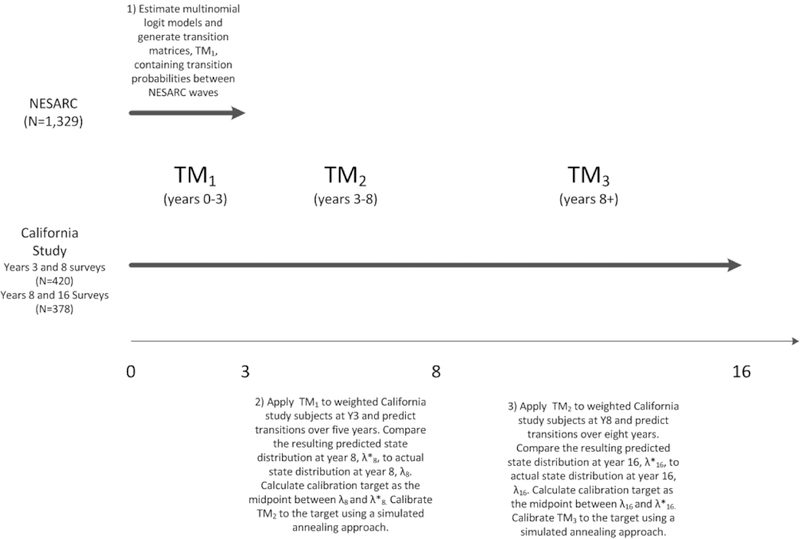
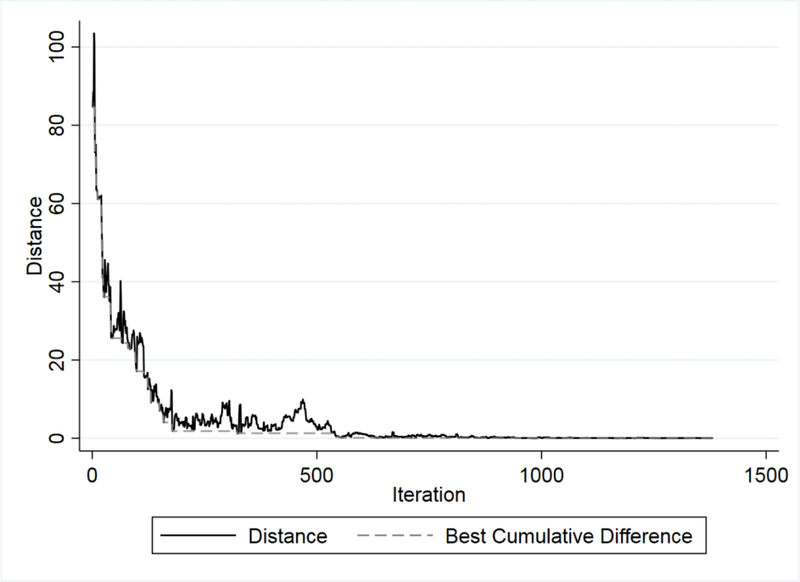
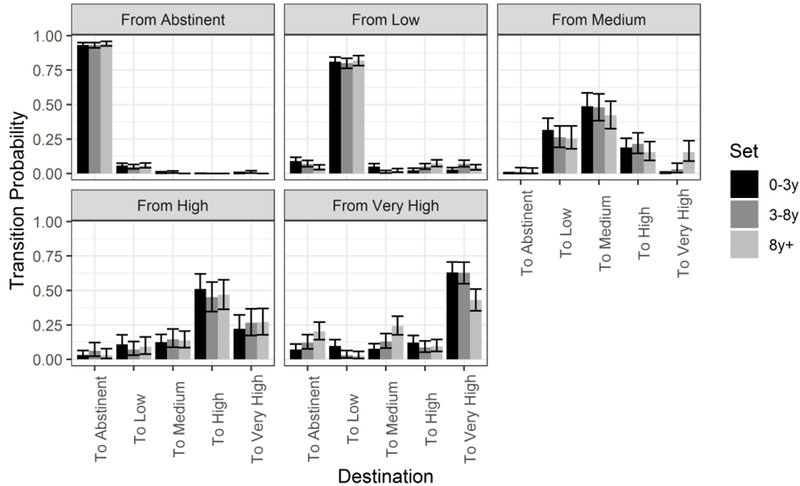
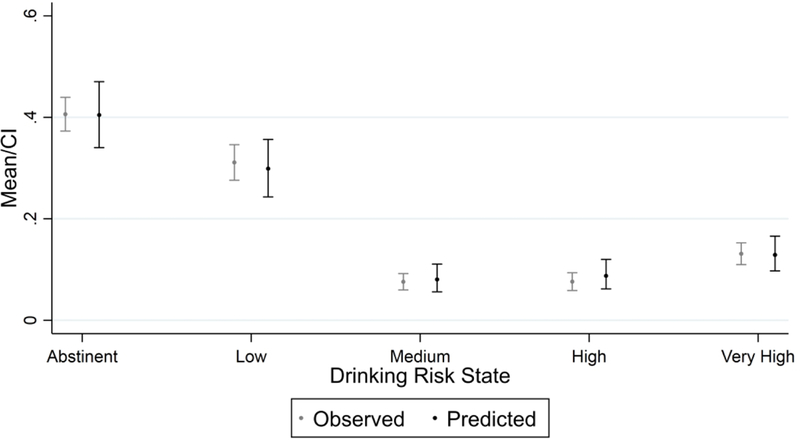
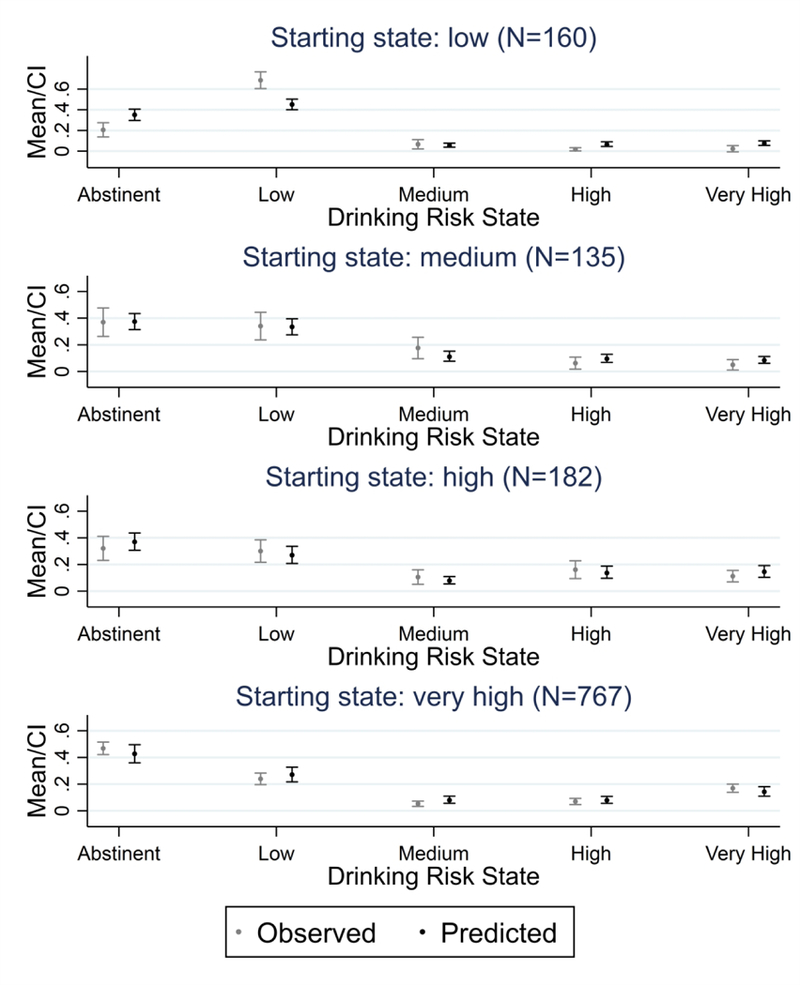
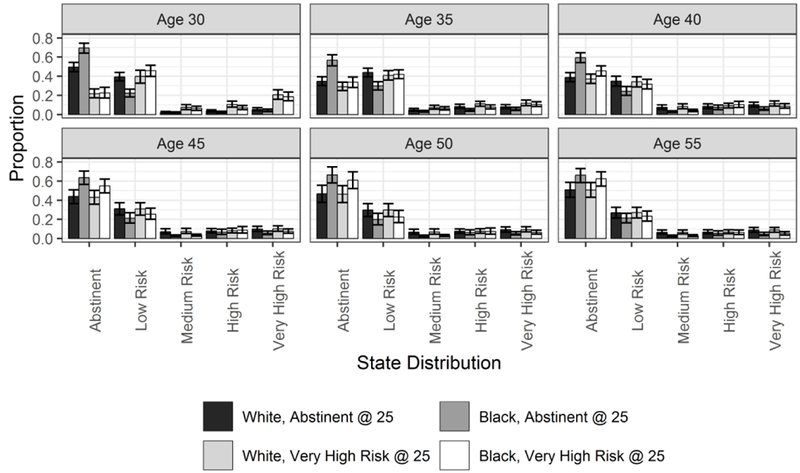
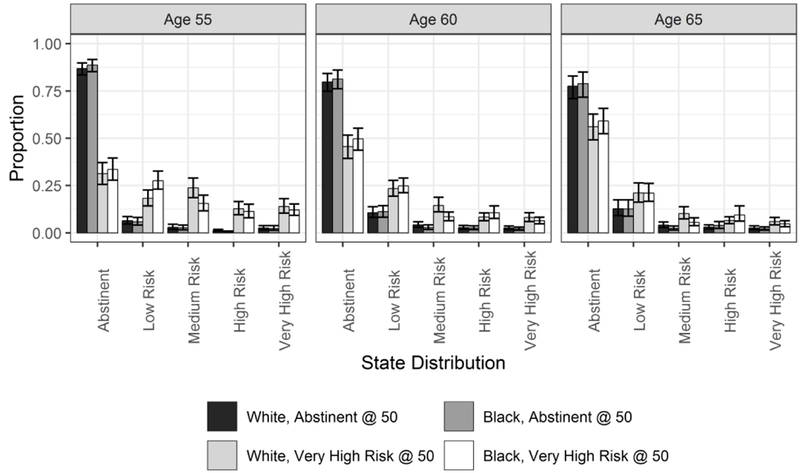
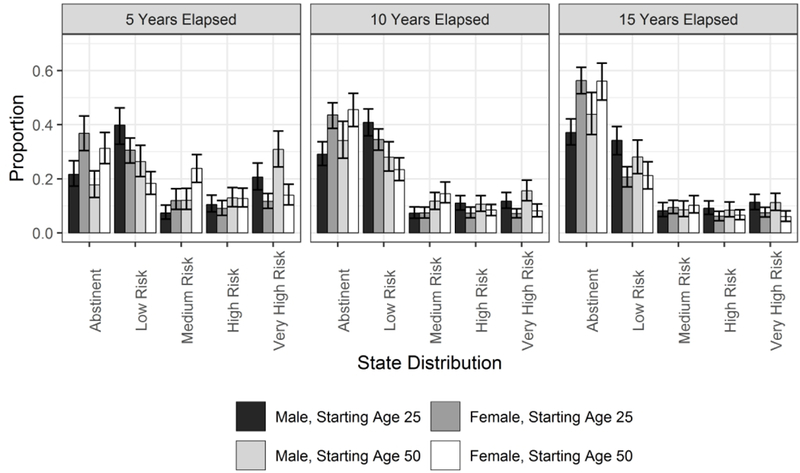
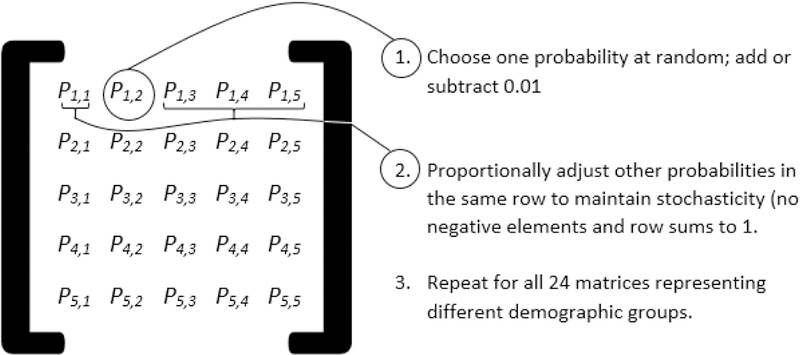
Background. There is a lack of data on alcohol consumption over time. This study characterizes the long-term drinking patterns of people with lifetime alcohol use disorders who have engaged in treatment or informal care. Methods. We developed multinomial logit models using the National Epidemiologic Survey on Alcohol and Related Conditions (NESARC) to estimate short-term transition probabilities (TPs) among the 4 World Health Organization drinking risk levels (low, medium, high, and very high risk) and abstinence by age, sex, and race/ethnicity. We applied an optimization algorithm to convert 3-year TPs from NESARC to 1-year TPs, then used simulated annealing to calibrate TPs to a propensity-scored matched set of participants derived from a separate 16-year study of alcohol consumption. We validated the resulting long-term TPs using NESARC-III, a cross-sectional study conducted on a different cohort. Results. Across 24 demographic groups, the 1-year probability of remaining in the same state averaged 0.93, 0.81, 0.49, 0.51, and 0.63 for abstinent, low, medium, high, and very high-risk states, respectively. After calibration to the 16-year study data (N = 420), resulting TPs produced state distributions that hit the calibration target. We find that the abstinent or low-risk states are very stable, and the annual probability of leaving the very high-risk state increases by about 20 percentage points beyond 8 years. Limitations. TPs for some demographic groups had small cell sizes. The data used to calibrate long-term TPs are based on a geographically narrow study. Conclusions. This study is the first to characterize long-term drinking patterns by combining short-term representative data with long-term data on drinking behaviors. Current research is using these patterns to estimate the long-term cost effectiveness of alcohol treatment.
Keywords: alcohol use disorder; calibration; drinking patterns; transition probabilities.
Conflict of interest statement
Conflict of Interests
The authors declare no conflicts of interest.
Figures
Similar articles
-
Transition probabilities for four states of alcohol use in adolescence and young adulthood: what factors matter when?Addiction. 2015 Aug;110(8):1272-80. doi: 10.1111/add.12985. Addiction. 2015. PMID: 25959142
-
Changes in drinking patterns in the first years after onset: a latent transition analysis of National Epidemiologic Survey on Alcohol and Related Conditions (NESARC) data.Psychol Addict Behav. 2014 Sep;28(3):696-709. doi: 10.1037/a0035069. Epub 2014 May 19. Psychol Addict Behav. 2014. PMID: 24841179
-
Prospective follow-up of empirically derived Alcohol Dependence subtypes in wave 2 of the National Epidemiologic Survey on Alcohol And Related Conditions (NESARC): recovery status, alcohol use disorders and diagnostic criteria, alcohol consumption behavior, health status, and treatment seeking.Alcohol Clin Exp Res. 2010 Jun;34(6):1073-83. doi: 10.1111/j.1530-0277.2010.01183.x. Epub 2010 Apr 9. Alcohol Clin Exp Res. 2010. PMID: 20374206
-
Treatment for alcohol-related problems: special populations: research opportunities.Recent Dev Alcohol. 2003;16:313-33. doi: 10.1007/0-306-47939-7_22. Recent Dev Alcohol. 2003. PMID: 12638644 Review.
-
Estimation of Transition Probabilities for State-Transition Models: A Review of NICE Appraisals.Pharmacoeconomics. 2021 Aug;39(8):869-878. doi: 10.1007/s40273-021-01034-5. Epub 2021 May 19. Pharmacoeconomics. 2021. PMID: 34008137 Review.
Cited by
-
Calibration and Validation of the Colorectal Cancer and Adenoma Incidence and Mortality (CRC-AIM) Microsimulation Model Using Deep Neural Networks.Med Decis Making. 2023 Aug;43(6):719-736. doi: 10.1177/0272989X231184175. Epub 2023 Jul 11. Med Decis Making. 2023. PMID: 37434445 Free PMC article.
-
The Rising Costs of Alcohol-Associated Liver Disease in the United States.Am J Gastroenterol. 2024 Feb 1;119(2):270-277. doi: 10.14309/ajg.0000000000002405. Epub 2023 Aug 21. Am J Gastroenterol. 2024. PMID: 37463414 Free PMC article.
-
Modeling the impact of a long-term horizon and multiple treatment episodes on estimates of the cost-effectiveness of alcohol treatment in the United States.Alcohol Clin Exp Res (Hoboken). 2023 Nov;47(11):2121-2137. doi: 10.1111/acer.15186. Epub 2023 Nov 12. Alcohol Clin Exp Res (Hoboken). 2023. PMID: 38226759 Free PMC article.
-
Behavioral stability of alcohol consumption and socio-demographic correlates of change among a nationally representative cohort of US adults.Addiction. 2023 Jan;118(1):61-70. doi: 10.1111/add.16024. Epub 2022 Aug 28. Addiction. 2023. PMID: 35975709 Free PMC article.
References
-
- Gakidou E, Afshin A, Abajobir AA, Abate KH, Abbafati C, Abbas KM, et al. Global, regional, and national comparative risk assessment of 84 behavioural, environmental and occupational, and metabolic risks or clusters of risks, 1990–2016: a systematic analysis for the Global Burden of Disease Study 2016. Lancet. 2017. September 16;390(10100):1345–422. - PMC - PubMed
-
- World Health Organization. Global status report on alcohol and health. Geneva, Switzerland: World Health Organization; 2014.
-
- Sacks JJ, Gonzales KR, Bouchery EE, Tomedi LE, Brewer RD. 2010 national and state costs of excessive alcohol consumption. Am J Prev Med. 2015. November;49(5):e73–e9. - PubMed
-
- Center for Behavioral Health Statistics and Quality. Key substance use and mental health indicators in the United States: Results from the 2017 National Survey on Drug Use and Health. Rockville, MD: Substance Abuse and Mental Health Services Administration; 2018.
Publication types
MeSH terms
Grants and funding
LinkOut - more resources
Full Text Sources
Medical
