. 2019 Oct 15;91(20):12971-12979.
doi: 10.1021/acs.analchem.9b03037. Epub 2019 Oct 3.

Synthetic Cannabinoid Receptor Agonists Detection Using Fluorescence Spectral Fingerprinting

Synthetic Cannabinoid Receptor Agonists Detection Using Fluorescence Spectral Fingerprinting

Benedict May et al. Anal Chem. .

Abstract

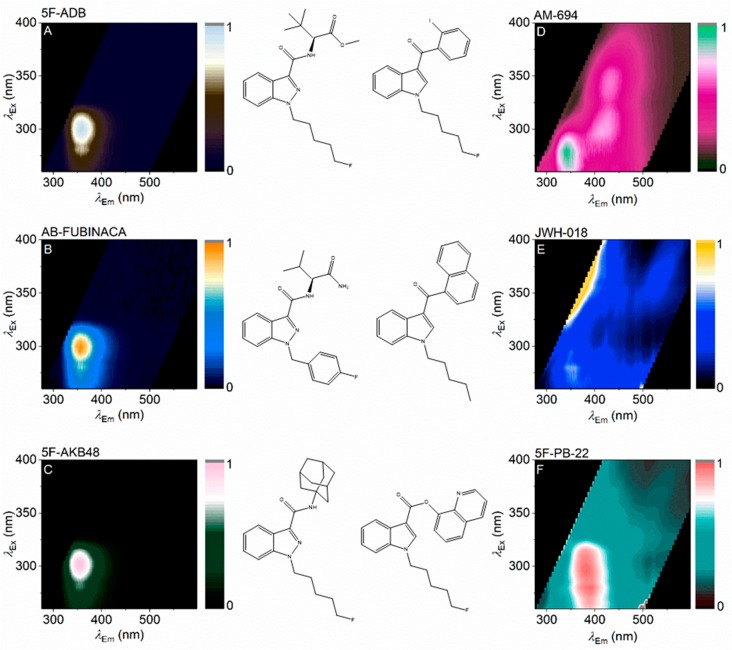
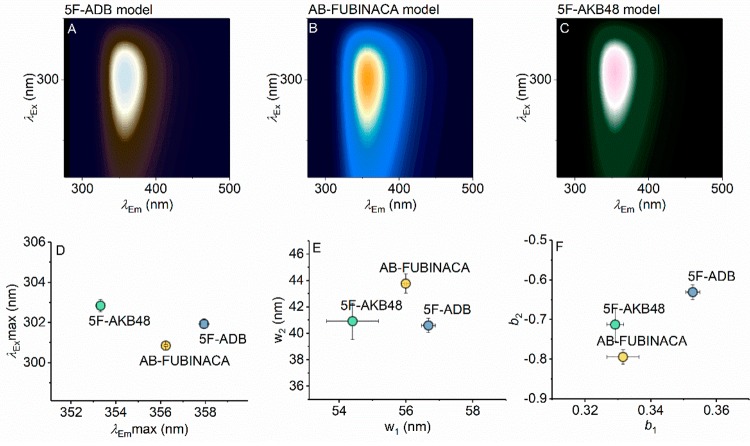
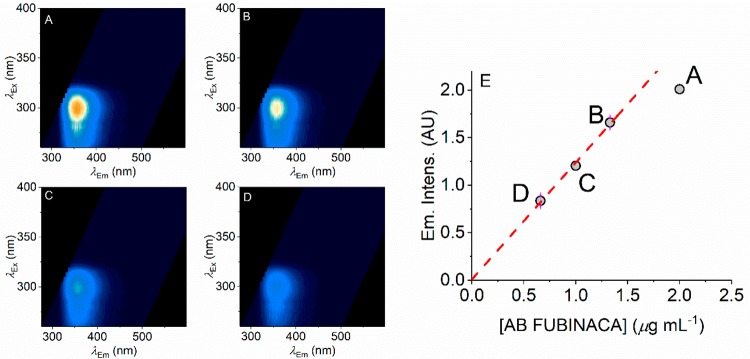
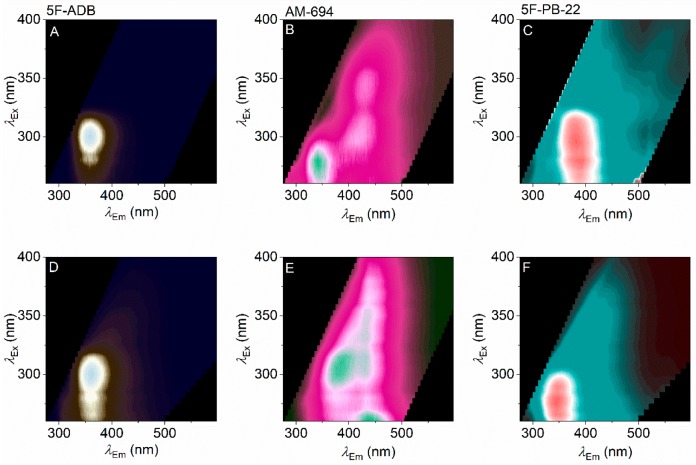
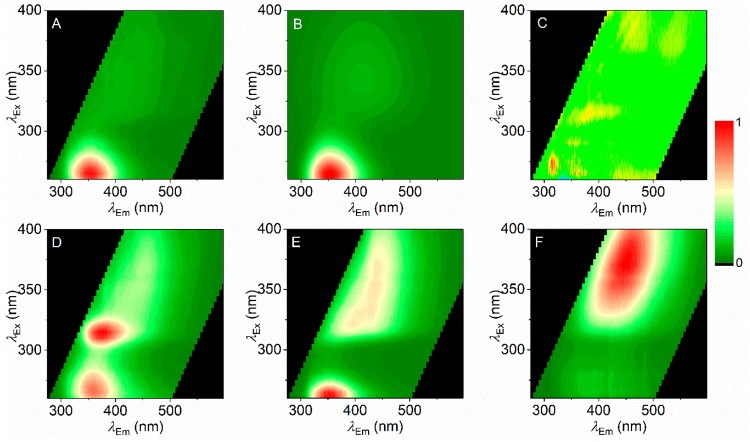
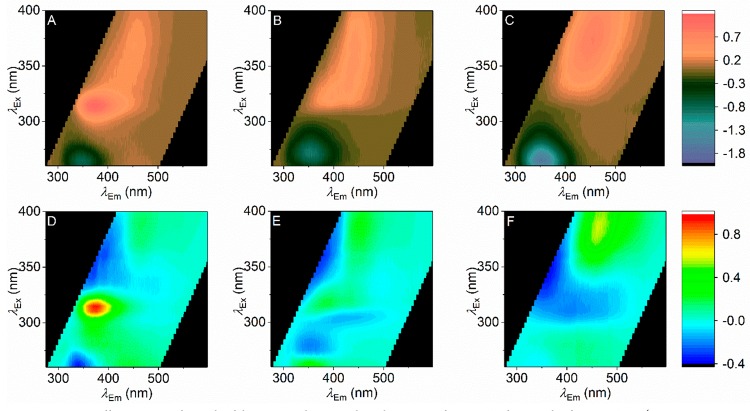
Synthetic cannabinoid receptor agonists (SCRAs), termed "Spice" or "K2", are molecules that emulate the effects of the active ingredient of marijuana, and they have gained enormous popularity over the past decade. SCRAs are Schedule 1 drugs that are highly prevalent in the U.K. prison system and among homeless populations. SCRAs are highly potent and addictive. With no way to determine the dose/amount at the point-of care, they pose severe health risks to users, including psychosis, stroke, epileptic seizures, and they can kill. SCRAs are chemically diverse, with over a hundred compounds used as recreational drugs. The chemical diversity of SCRA structures presents a challenge in developing detection modalities. Typically, GC-MS is used for chemical identification; however, this cannot be in place in most settings where detection is critical, e.g., in hospital Emergency Departments, in custody suites/prisons, or among homeless communities. Ideally, real time, point-of-care identification of SCRAs is desirable to direct the care pathway of overdoses and provide information for informed consent. Herein, we show that fluorescence spectral fingerprinting can be used to identify the likely presence of SCRAs, as well as provide more specific information on structural class and concentration (∼1 μg mL-1). We demonstrate that that fluorescence spectral fingerprints, combined with numerical modeling, can detect both parent and combusted material, and such fingerprinting is also practical for detecting them in oral fluids. Our proof-of-concept study suggests that, with development, the approach could be useful in a range of capacities, notably in harm reduction for users of Spice/K2.


Conflict of interest statement

The authors declare no competing financial interest.

Figures

Figure 1
Figure 1
Structural overview of SCRAs. A range of specific substituents are given in Table S1.
Figure 2
Figure 2
FSFs for a range of SCRAs. FSFs are shown next to the associated SCRA structure with either an indazole (A–C) or indole (E, F) at the core position (Figure 1). Coloration represents relative emission with the maximum at 1.
Figure 3
Figure 3
Surface fits of eq 1 to the data shown in Figure 2A–C (panel A, 5F-ADB; panel B, AB-FUBINACA; panel C, 5F-AKB48). The resulting parameters from fitting to eq 1 are shown in panels D–F, for maxima of excitation/emission, spectral width, and skewness, respectively. Error bars are the standard deviation from fitting three to five different concentrations of each SCRA (∼1–5 μg mL–1). Color levels as in Figure 2 (relative emission).
Figure 4
Figure 4
Concentration dependence of AB FUBINACA FSFs. (A–D) FSFs for different concentrations of AB FUBINACA with decreasing concentration shown in panels A → D. (E) Plot of concentration versus peak emission intensity. The red dashed line shows the linear dependence of the lower (first three) concentrations with the higher concentration deviating from linearity as discussed in the main text. Color levels as in Figure 2B (relative emission).
Figure 5
Figure 5
Effect of pyrolysis on SCRA FSFs. (A–C) FSFs for parent compounds as in Figure 2 (panel A, 5F-ADB; panel B, AM-694; panel C, 5F-PB-22). (D–F) Corresponding FSFs of combusted material via our smoking model. Color levels as in Figure 2 (relative emission).
Figure 6
Figure 6
Detecting combusted SCRAs in oral fluid. (A) FSF of a combined oral fluid sample from a number of volunteers (individual FSFs shown in Figure S5). (B) Model of the oral fluid sample from fitting eq 1 to panel A. (C) Residuals arising from the fit of eq 1 (panel B) to the oral fluid FSF (panel A). (D–F) FSFs for combusted SCRAs in the presence of oral fluid (panel D, 5F-ADB; panel E, AM-694; panel F, 5F-PB-22).
Figure 7
Figure 7
(A-C) Difference FSFs for each of the SCRAs shown as the subtraction of Figure 6A from each of Figure 6D–F (panel A, 5F-ADB; panel B, AM-694; panel C, 5F-PB-22). (D–F) Residuals arising from the fit of the model shown in Figure 6B to each of the SCRA + oral fluid FSFs shown in Figure 6D–F (panel D, 5F-ADB; panel E, AM-694; panel F, 5F-PB-22).

References

    1. Smith J. P.; Sutcliffe O. B.; Banks C. E. Analyst 2015, 140, 4932–4948. 10.1039/C5AN00797F. - DOI - PubMed
    1. Risoluti R.; Gullifa G.; Battistini A.; Materazzi S. Anal. Chem. 2019, 91, 6435–6439. 10.1021/acs.analchem.9b00197. - DOI - PubMed
    1. Krauss S. T.; Remcho T. P.; Lipes S. M.; Aranda R.; Maynard H. P.; Shukla N.; Li J.; Tontarski R. E.; Landers J. P. Anal. Chem. 2016, 88, 8689–8697. 10.1021/acs.analchem.6b01982. - DOI - PubMed
    1. Fride E. Eur. J. Pharmacol. 2004, 500, 289–297. 10.1016/j.ejphar.2004.07.033. - DOI - PubMed
    1. Pertwee R. G. Int. J. Obes. 2006, 30, S13–S18. 10.1038/sj.ijo.0803272. - DOI - PubMed

Publication types

MeSH terms